We may need a little more information to know the short term direction in various sectors, since the markets all seem to currently be somewhere on Middle Ground. Lets take a look at a few charts and you’ll see what I mean.
This was the NASDAQ March 3rd – 1st target met – a possible pullback to test the break out or 50sma
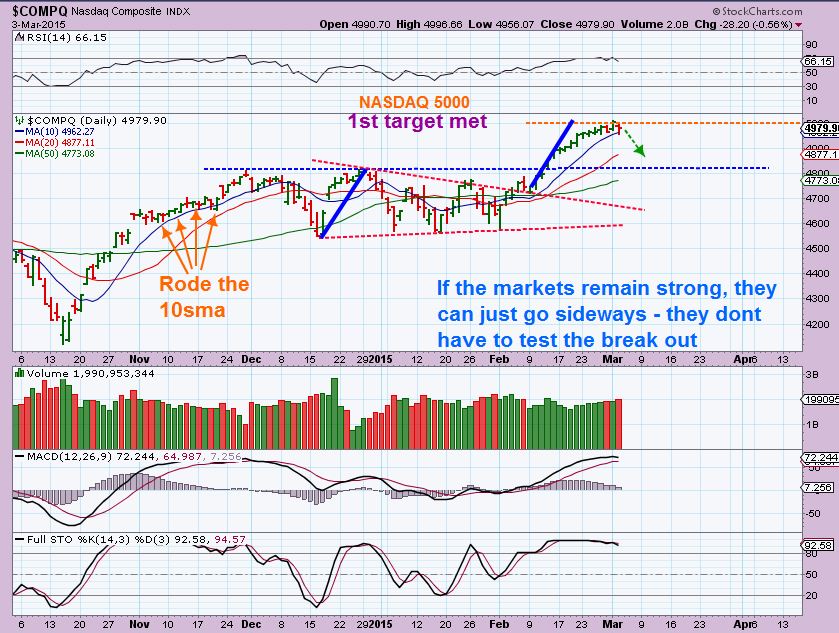
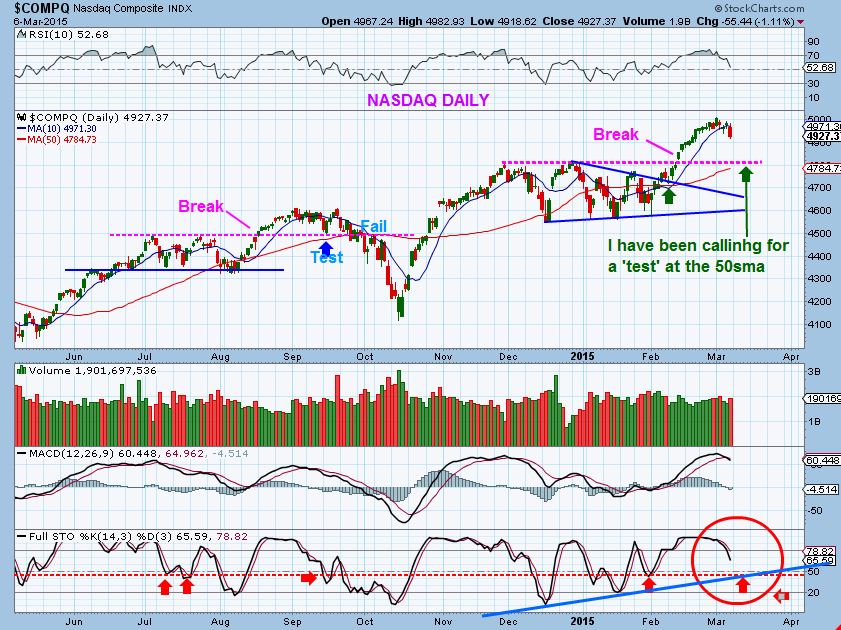
This was the NASDAQ Friday …
Very similar to last Summers break out, I mentioned that it will likely ‘test’ the break out.
The question on the above chart is: Will it “test ” & go higher or fail again like last summer? The stochastic seems to want more downside at least to fulfill that test. Cycle wise I am expecting a drop longer term into an intermediate low.
1. DO we get a test & bounce to 5200? ……..or……….
2. Test , bounce & fail like last summer? Feels like we are on Middle ground.
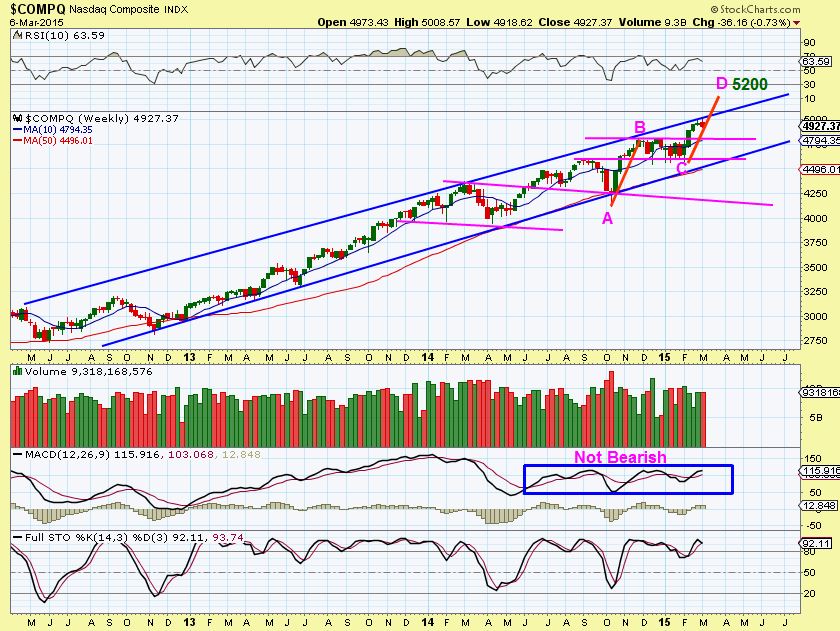
NASDAQ WEEKLY – 5200 still looks possible, even after a ‘test’, but not absolute.
What about the SPX? It is not as strong as the NASDAQ which ran straight up. The SPX rolled sideways as of MARCH 3 as shown below, but had a daily reversal so I wondered… will they buy the dips?
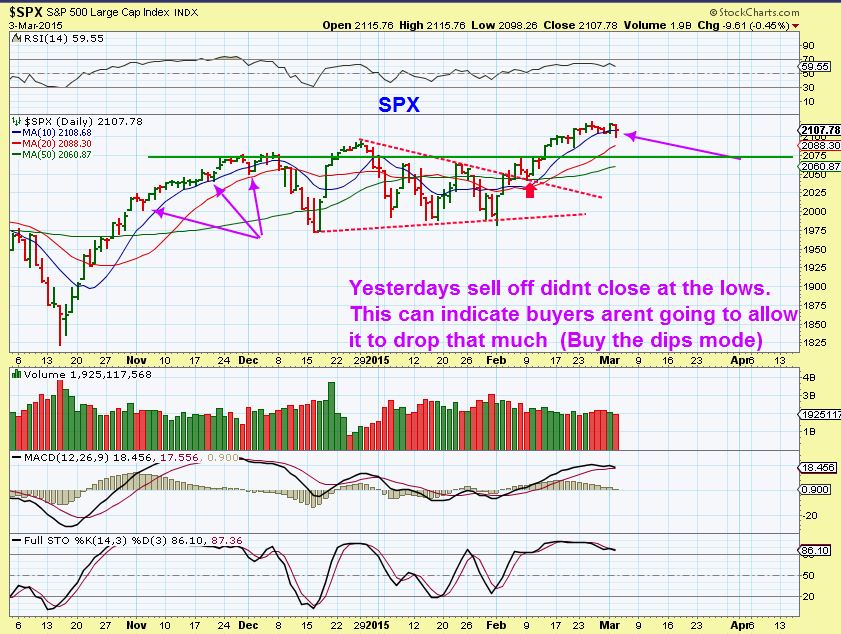
Though the NASDAQ went green for a couple of days after March 3 , the SPX just dropped to that 50sma already. Do you see this chart below?
Middle Ground. Why? Because it may bounce off of the 50sma soon, but the MACD & Stochastics wants lower price. Maybe it would be just a bounce? It is not clear, but Cycle-wise…I expect we could see lower prices as this Cycle drops to find its lows later.
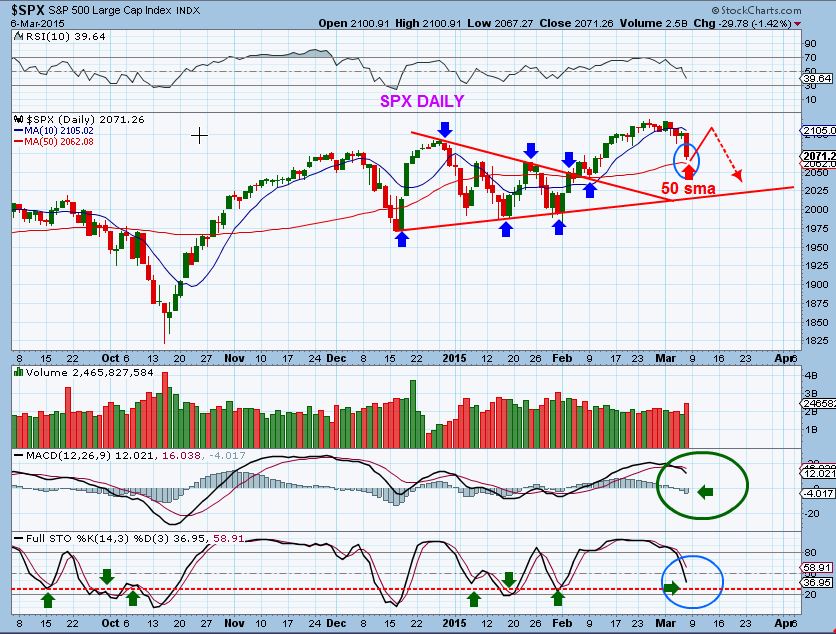
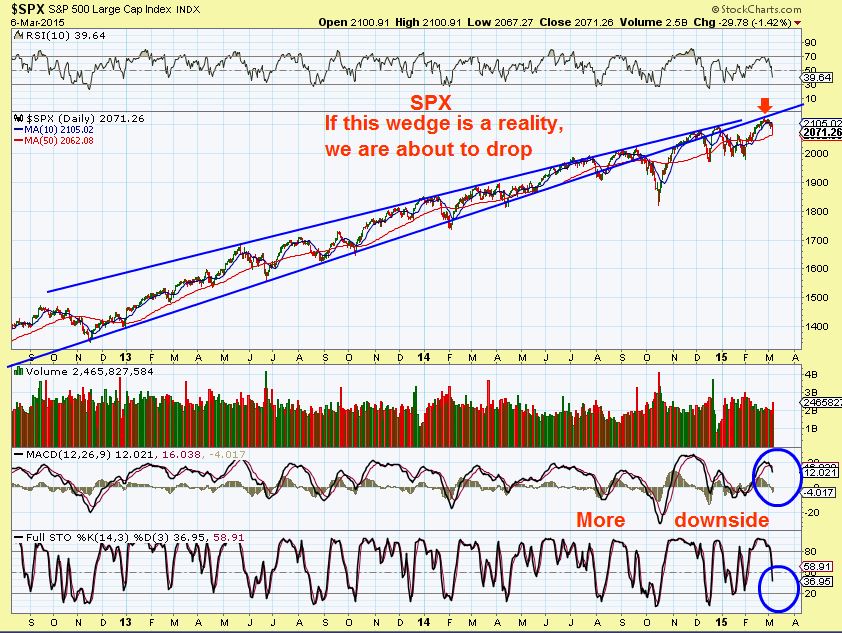
This chart of a wedge would be very bearish. We ‘tagged’ the bottom trend line and it could indicate much lower price .
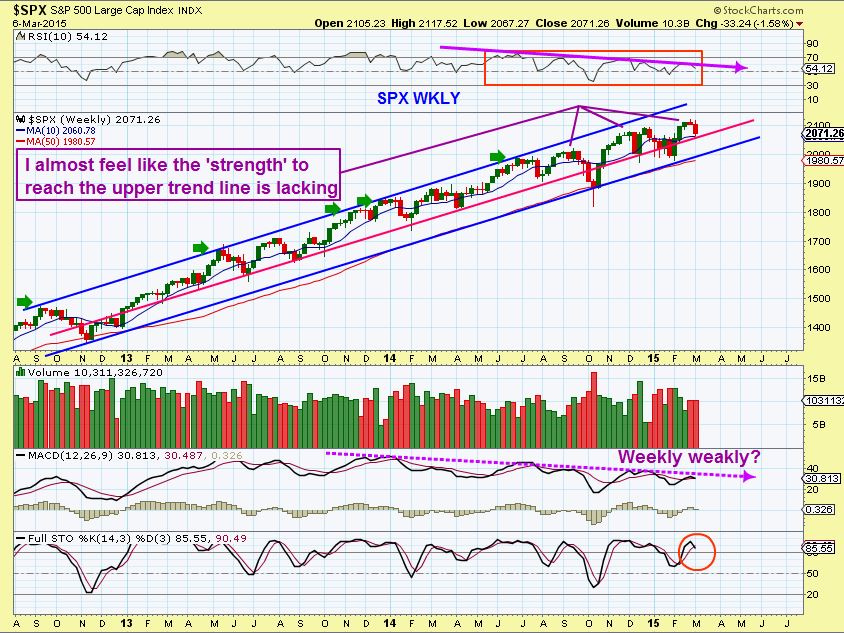
The SPX WEEKLY has not been strong enough to reach its Upper Blue Trend Line on a wkly chart. Weakening MACD, RSI, and Price would indicate a possible weekly top is forming. How big of a drop & exactly when? Its difficult to tell from Middle Ground.
I want to talk about OIL & Our ENERGY stocks for a couple of reasons.
A sideways move can be good. It can help put in a bottom after a steep sell off (we have seen this in many energy stocks). Sideways moves build energy for the next move, and it can become a trending move. I have been expecting this in the Energy sector, but a few things need to be mentioned. Lets look at OIL-
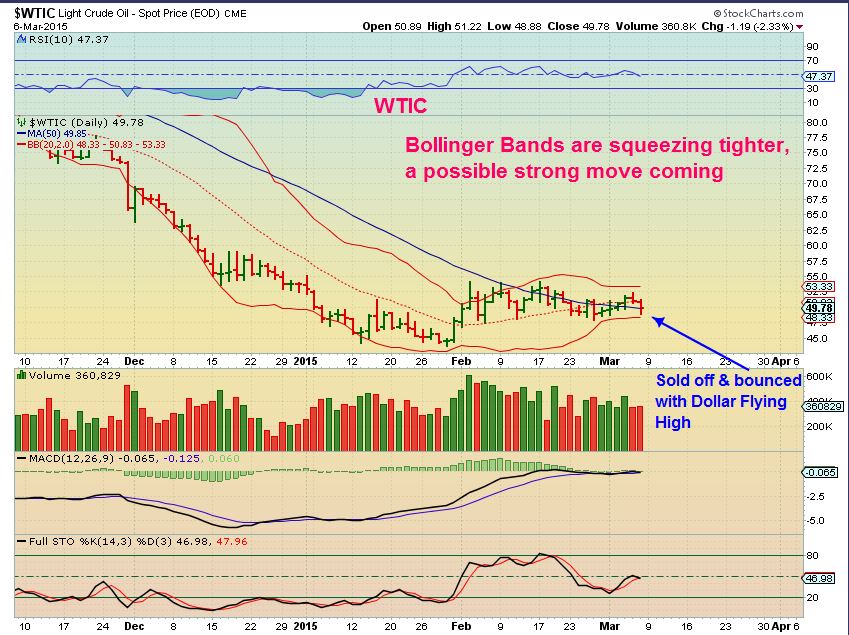
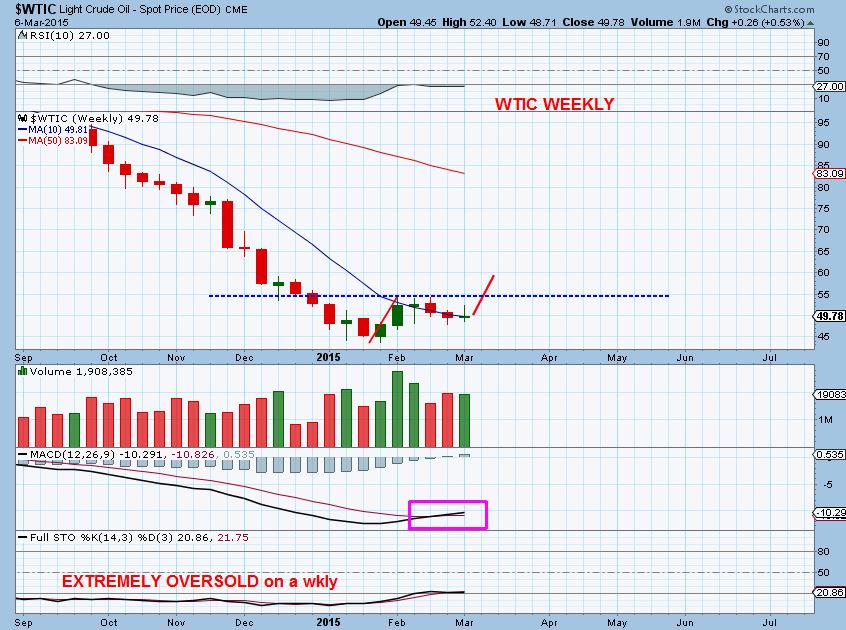
$WTIC- The B.B.’s are tight and OIL looks ready to break soon. Obviously it can go in either direction, but I think OIL actually put in a yearly low, so I would expect a break higher . Yes- It could break lower & double bottom, but Cycle-wise, there is time for a quick burst higher & then after breaking above the B.B.’s, a drift back to a DCL , possibly “testing the break out. This is oil.
OIL WKLY chart looks like it also wants higher prices after a recent low was put in.
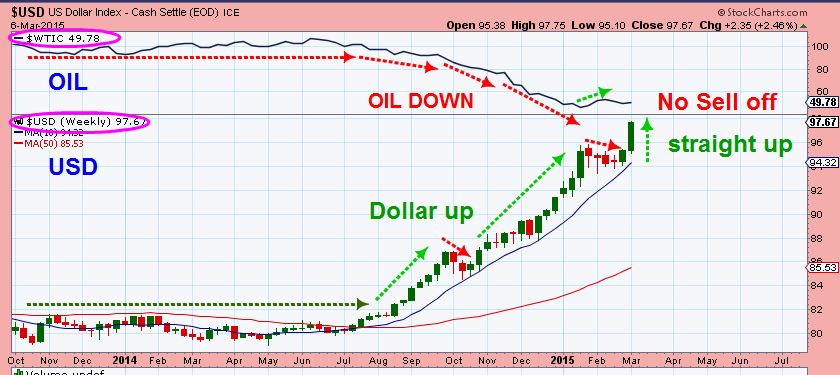
Think about this : Last week the Dollar took off like a ROCKET to new highs, and OIL didnt drop to new lows.
In fact, here is the weekly view of both- so the Dollar took off upside for 2 weeks, and OIL didnt blink. (Click to enlarge)
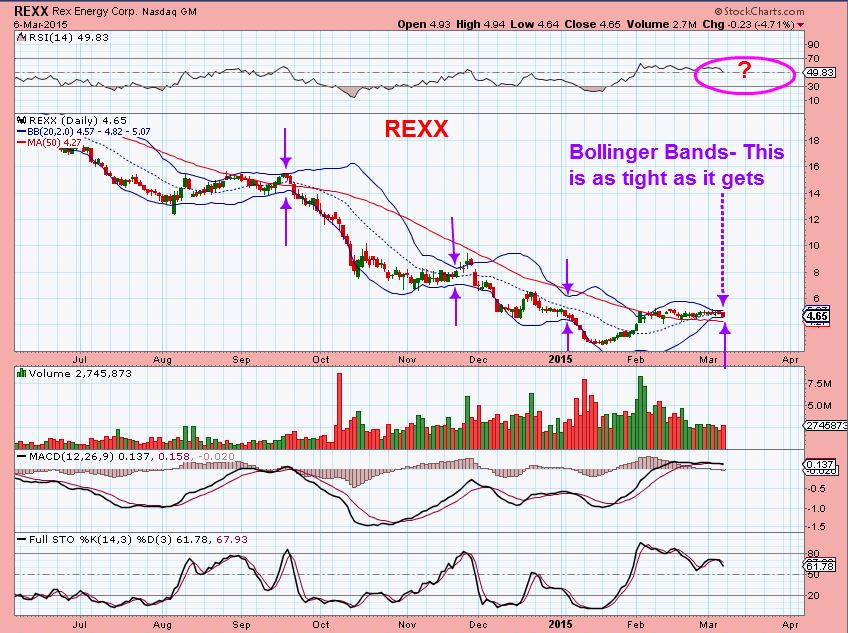
I wanted to mention something as a side point. Sideways moves can cause a tight squeeze on the bollinger bands.
Bollinger Band Squeezes can lead to explosive moves ( in either direction). The tough part is …in which direction?
B.B. Observation:
REXX is an extremely Tight B.B. ( I own this). The MACD is steady , but the RSI turned down. I have expected a break higher, earnings are already out and it has been a steady consolidation. As an owner of REXX, I am watching this one closely. I hate to say this, but I expect a break really soon, and in the past , B.B. Squeezes have in the past broken out falsely only to run in the opposite direction. This could get tough.
Look at this chart during September & November. The B.B. got tight, broke higher…then crashed. It did a false break in one direction & then ran the other way. What does that mean?? I am worried that This “Could” falsely break lower now and then run higher, but I have to honor my 50sma stop. If it breaks lower below the 50sma & below $4, I am stopped out. If it then turns higher & Runs strongly, I can re-enter, but I just wanted to point out the B.B. & crazy moves that often come from a Tight B.B. This is about as tight as it gets!
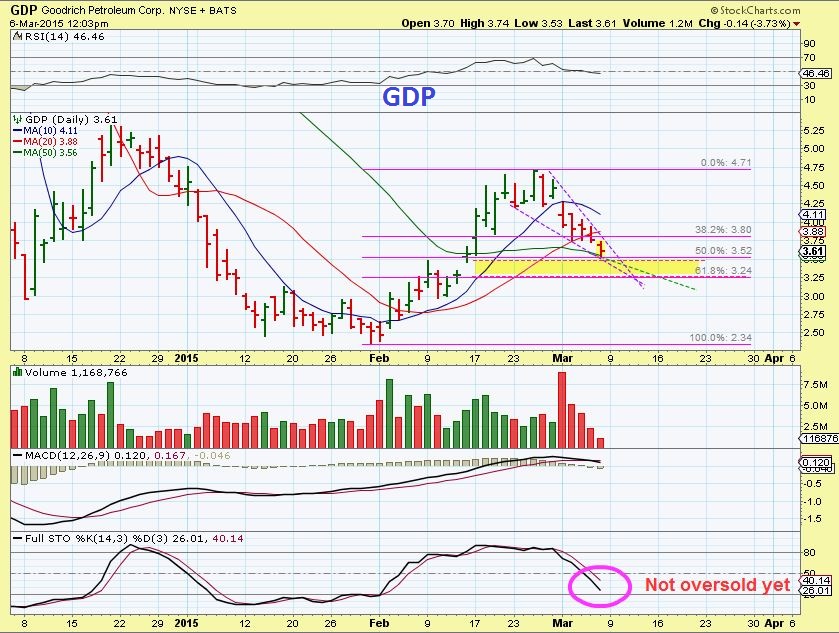
Got a few emails about GDP– it dropped to the 50sma. I did say to expect in prior reports on all Energy stocks as they rise above the 50sma. It often gets tested. GDP on March 3.
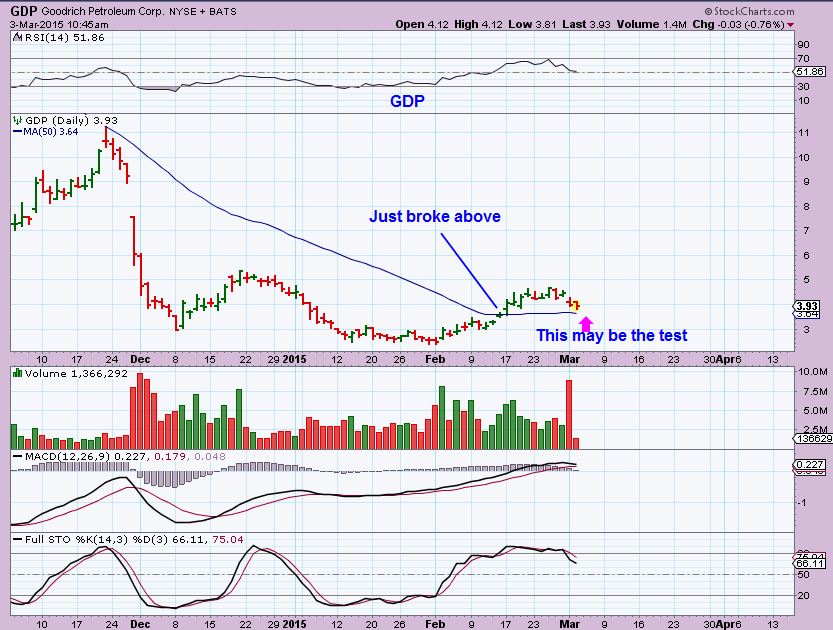
GDP still looks like it wants higher price if this wedge plays out– ( Gap below & 61.8% re-trace). Bounced off of the 50sma. I would sell it below the 50sma if it fells that gap & doesnt recover. This may depend on how OIL plays out.
GOLD , SILVER, & MINERS
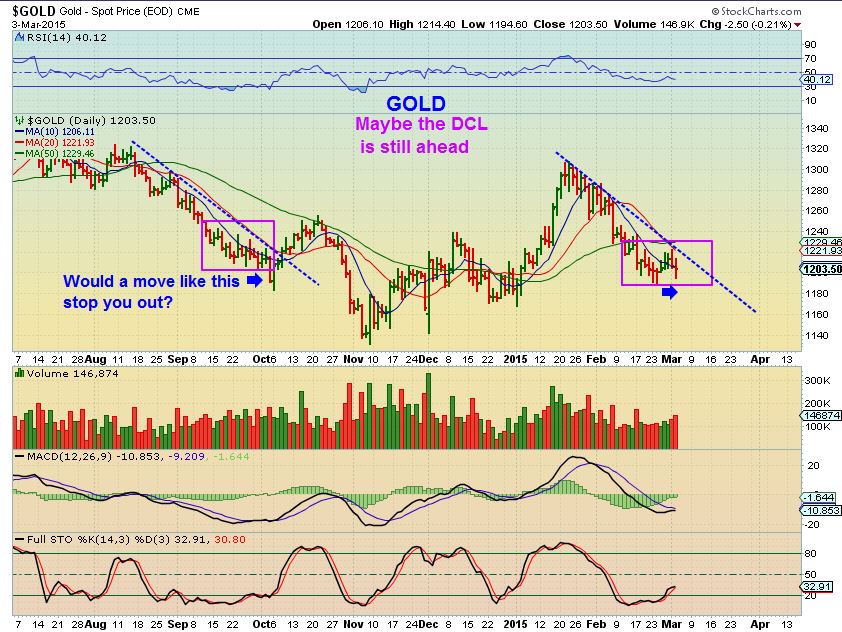
GOLD – Sold off hard Friday & various cycle commentators have various cycle counts. It is very uncertain cycle wise, so lets just examine what is in front of us.
Do you recall on MARCH 2 & again on March 3 , I said we could get a slam down that would scare many & shake them out? I posted this …
We got it –
(But is that it, a daily cycle low in this area?). We cant tell, we are again on Middle Ground. If Gold sells down Monday and reverses higher, this may happen ( Blue bounce) …the daily cycle low, tag 50sma and roll over to ICL.
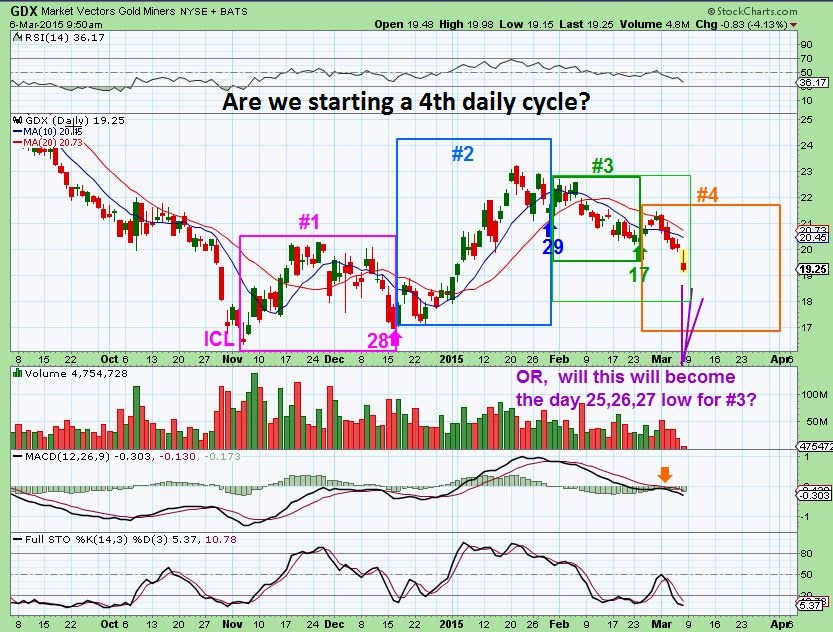
Are we really starting a 3rd daily cycle? Could this be the 4th & Final daily cycle that rolls into an ICL? Hard to tell in Middle ground, but I think its possible.
WHAT Could we expect if we had the cycle low FEB 24 & we just rolled over on day 8?  Many things actually, because that would put us on at the start of a deeper sell off. We could finally get this .
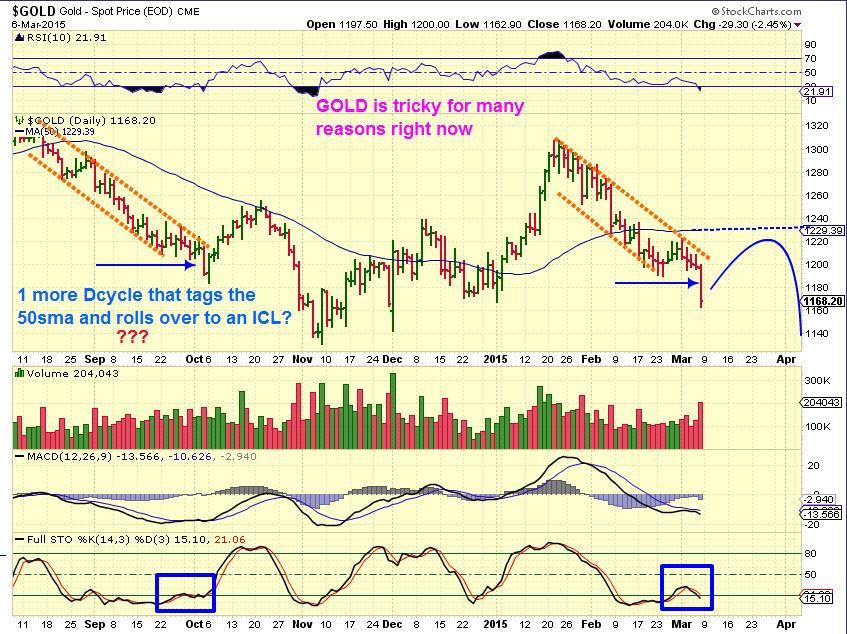
GOLD WEEKLY WATERFALL – look at those STEEP WEEKLY DROPS on the left. We’d hit that $1000 mark at the next ICL.
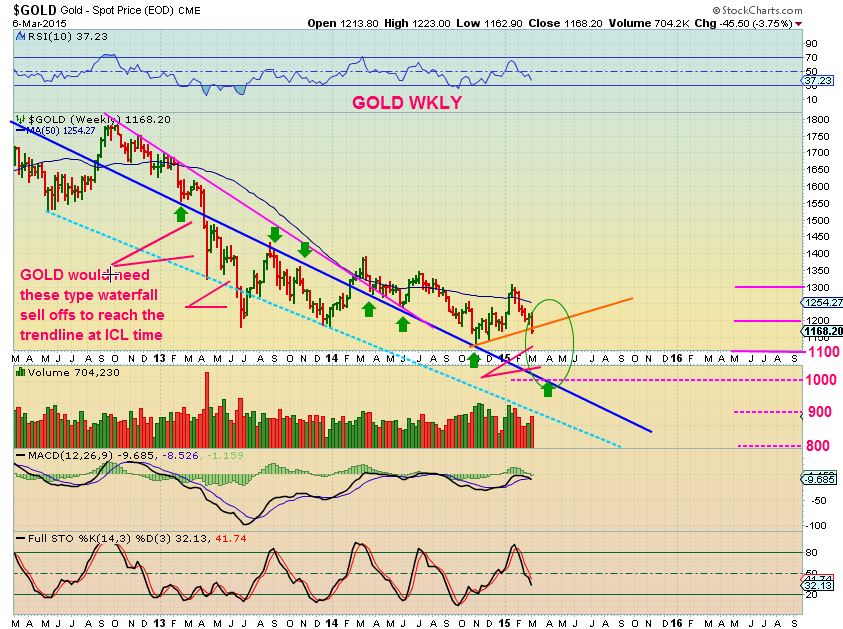
We just lost our “shake out & Recovery” That I wrote about in December.
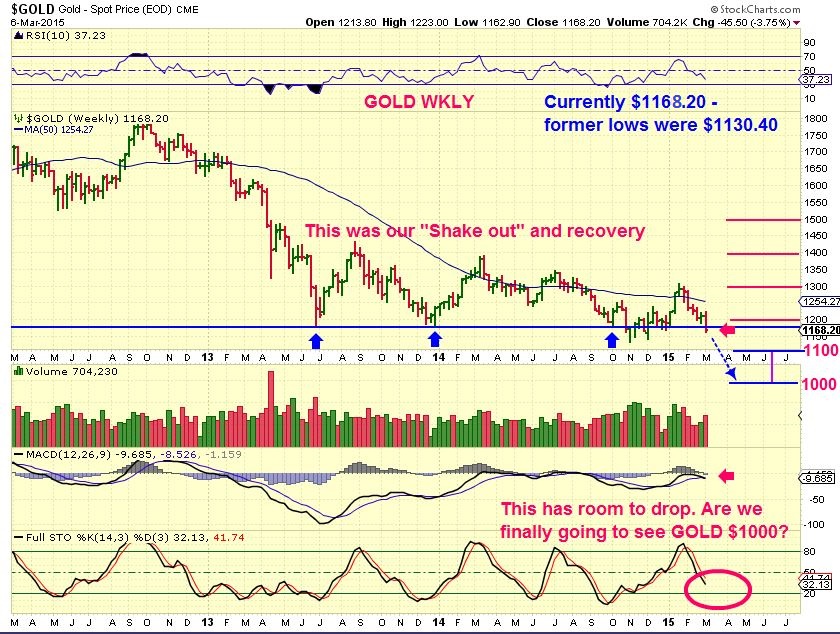
In Fact, We closed at $1168.20, only $38 dollars above November lows of $1130.40. $38 can be lost in a day in $gold, we all know that. Lets see what happens from here.
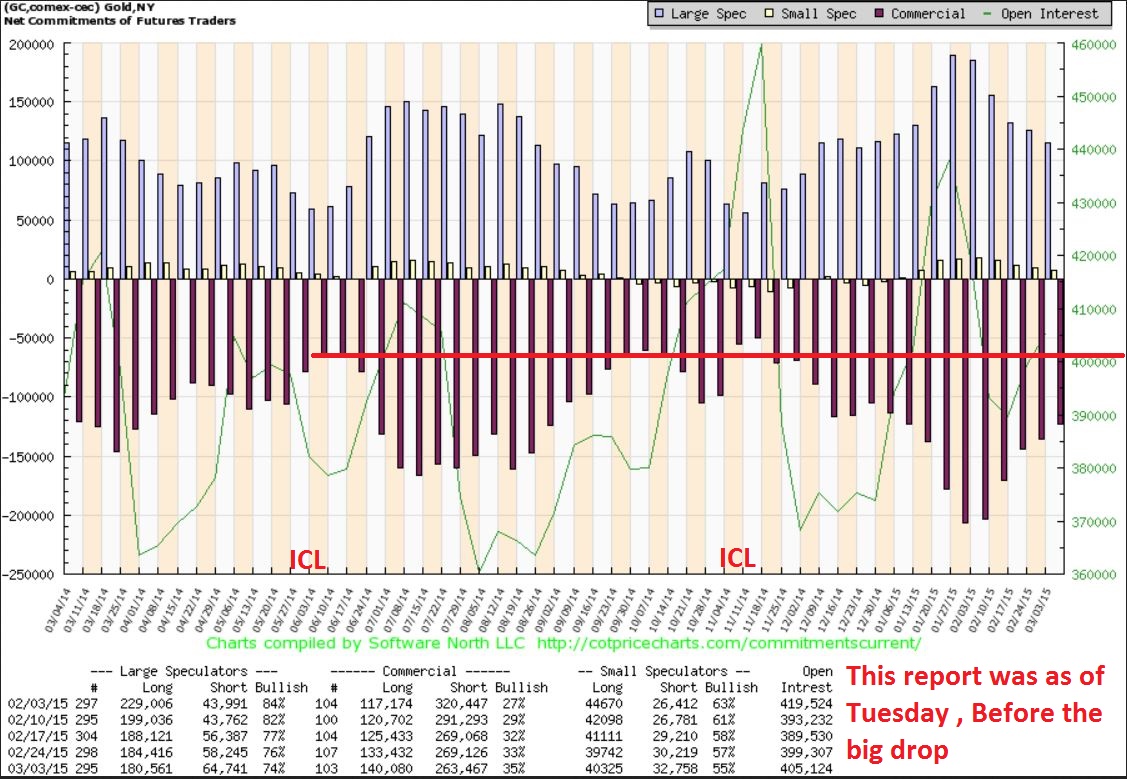
Good to see that the C.O.T. is nearing the point where those deep meaningful lows came in, and this report is as of Tuesday . This chart doesnt include the 3 day sell off with the HUGE down day Friday.
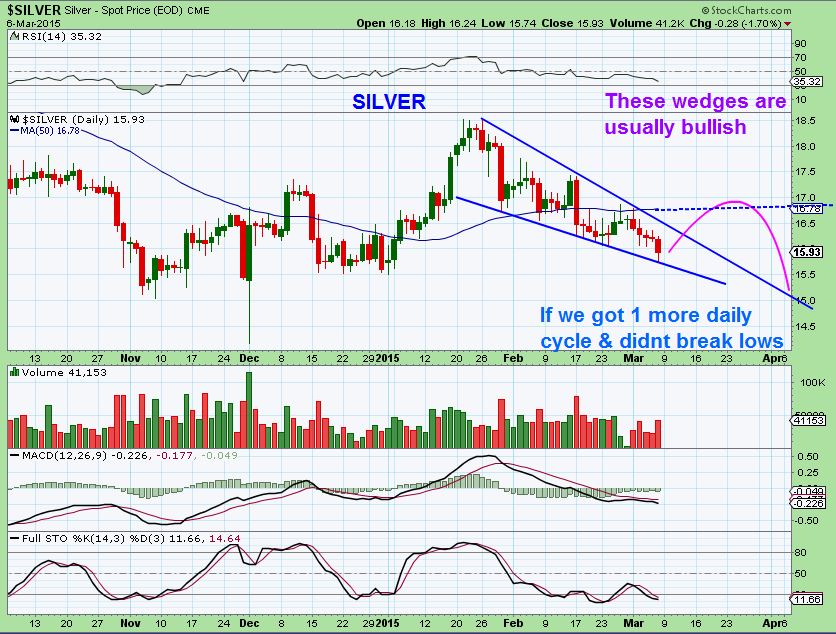
$SILVER actually doesnt look all that bad tech analysis wide . A break out higher from the wedge & “Test” and we could be at a great buy point.
Conclusion:
It is not clear exactly which direction the markets want to go from here in the short term. The markets started pulling back, and the SPX is already trying to test the 50sma. Is it a 1/2 cycle low and another thrust higher is coming, or more drop to come? Time will help. I am still holding OIL/ENERGY stocks, and as I mentioned , this long sideways move can build energy for the next move. I want to watch things as they play out. Oil looks good on that weekly chart, but cycle wise time is draining away. I’d like to see OIL take off upside , or it could double bottom in a cycle low . I also do see many nice charts that look like ‘long positions’ are working well.
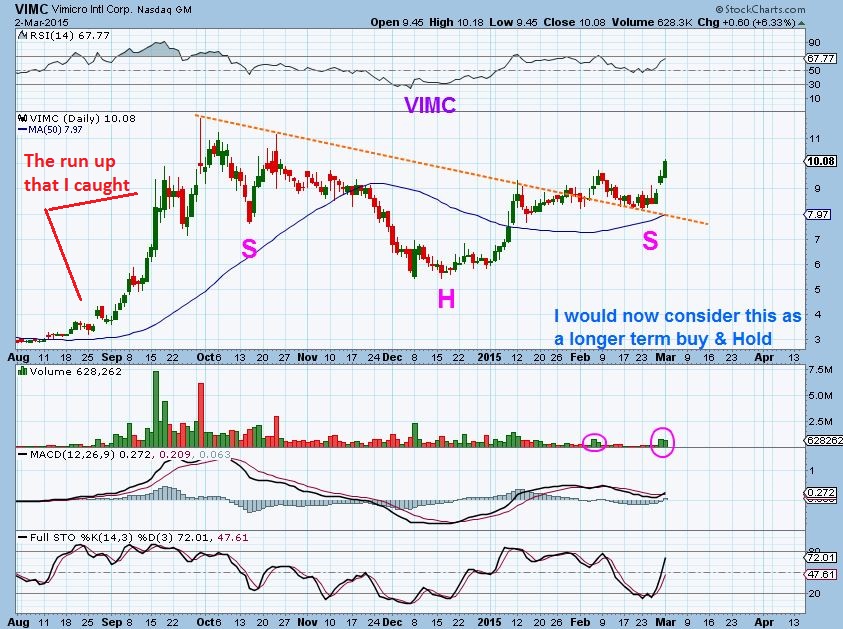
I pointed out VIMC ( March 2 chart below ) and it popped and is drifting lower -Giant inverse H&S?
Also many others like DANG, PXLW, GTN, etc still look bullish. Many bullish Bio-tech stocks have nice set ups, but so did BLRX ( see that 3 month chart ) . Biotechs are tricky with FDA announcements and failed drug tests they can gap big time in either direction. A basket or ETF is best for certain volatile sectors like Bio Tech, Energy, Miners in my opinion.
We’ll have to see what this week brings and based on the moves in the markets and GOLD/ SILVER / MINERS/ $USD this past Friday, it should be interesting to see how this all plays out. When I looked at all of the charts, it just felt like we were teetering on Middle Ground.
~Alex
Jobs report Friday 
 Peace Of Mind
Scroll to top
Do you still feel the gold miners will start an uptrend in April?
Hi Wish…
At this point yes, but it was somewhat based on cycle timing , so I have to see how the next daily cycle plays out. There is confusion as to whether we are starting a 3rd dcycle? has it started 8 days ago or so & its failing? If we reverse higher right here, will that be a 4th dcl?
Back in January when I was thinking that we find a more meaningful low in April- I expected 4 daily cycles ( Each roughly 30 trading days long).
So, its wait and see on the energy sector. Will you let us know when you sell or get stopped out?
My positions have stops below the 50sma – not tight tight, but a close below and I am usually out
Hi Alex, you wrote: “Good to see that the C.O.T. is nearing the point where those deep meaningful lows came in, and this report is as of Tuesday . This chart doesnt include the 3 day sell off with the HUGE down day Friday”. I don’t understand this would you explain a bit more for me? See you later. THANKS
B.T.W. a great report, especially the “conclusion” I like, very good!
Some look at the COT to see whether smart money is heavily LONG or SHORT GOLD (and you dont want to really trade against the smart money positions). It is only released on Fridays . I marked on the chart the areas where ICL ( LOWS) came in, and the chart represents up until Tuesday onward, so after the selling Wed, Thurs , Fri – the chart would even be better now.
Thanks Alex…… that means the chart look even better now, we go up in de PM? Please let me know.
No, it is released weekly. It means a low could come in weeks, it’s just 1 more step on the way to that deeper, and more meaningful low
ALEX….. 2 questions:
How looks the chart of Nat.Gas?
Other question: When I’m breakeven with PM stocks, should I sell? Thus…., I mean by any bounce of Gold shall I get out the PM stocks?
Natgas still not so great.
I wouldnt hold PM stocks for more than a trade at this time.
Lightened up on some of my energy stocks. EXXI broke the trend line lower, KEG doesn’t look good. Still in SFY and SOL. Alex, what do you think of the triple bottom on RDS.A Shell oil?
That might have been a good choice, EXXI did break the trendline and the MACD crossed down. I am watching REXX with a feeling that it wants to test the 50sma , but the volume seems a little strong for 1/2 day, I may cut 1/2 my position that I bought lower, since hat B.B. set up is explosive . I just want to make sure it goes in the right direction first.
Only green ones that I kind of feel are acting correctly , or ‘as expected’ today are SZYM, AXAS , TGS, Gevo (GBR?). Some others still look fine, but I dont like waiting this long for a move that really seems like it should have happened by now.
RDS.A- Thats trying for a quad bottom? Thats a tough call, it is oversold and did crash the B.B. so should bounce, but I’m starting to wonder if the energy sector will move higher soon or double bottom first.
It appears to me that Uranium miners, Gold miners, and Energy stocks are all headed to double bottoms.
Bill, gold and miners chart looks about as bad here as anything I’ve ever seen. GDX still has about $1.40 to go to match Nov lows, GDXJ only 78 cents. It’s pretty much an absolutely certainty that they’ll test that level if not crash right through it. That puts NUGT at $6.90 or there abouts.
Alex,
Just hoping for your thoughts on BAS?
Thx
BAS looks like EXXI did late last week.
Just put up a 50sma , nothing much to say until it violates it.
szym one of my bright spots, but I sold it together with wres to offset the loss there. Looking at BAS and GDP, GDP down to $3, while the private placement was done around 4. Some people are not going to be happy. Still playing with chump change as I don’t know the energy sector as I do the PM space.
SZYM my only green today. I looked at AXAS- it went below the 50sma and recovered and then ran nicely for the last 2 days.
These seem to be drawn back to the 50sma , and I really just wanted them to break above, drop & test, and move higher, so I am now watching this long sideways move & thinking …” Are these going to do what I expected?” REXX & SFY both are sitting at the 50sma…so I am not stopped out, but I cut my REXX position to lock in gains .
In other words, even though they may be bottoming, the process of this bottom may include a double bottom for some of these. ( Maybe not all of then, like I said, AXAS looks nice. REXX & SFY sit right on the 50sa, etc ….GDP is below the 50sma though now. 3 month inverse H&S? Tough call on some of these.
I got to buy some GDP here, the pp was actually at 4.15, somebody is going to want this back up soon.
bought 2k at 3.01 GDP plus a little BAS
Lot of folks still in energy? I have been fully stopped out at this point. With the run up GDP had a few weeks ago, can’t believe I found a way to actually lose money on that stock. I guess REXX is still technically on the 50-day, but it is down sloping, I left at 50 day from my purchase so I crashed out this PM. Heavy volume, closed near lows, oil up, broad market up. Ugly!