Yesterday at 7 a.m. I saw that the futures for the DJIA, SPX, and NASDAQ were green, but I said that I expected them to would sell off and close red for the day. They did. What about now , the futures are Green again pre-market, Are we due for a bounce? Lets look at some charts…
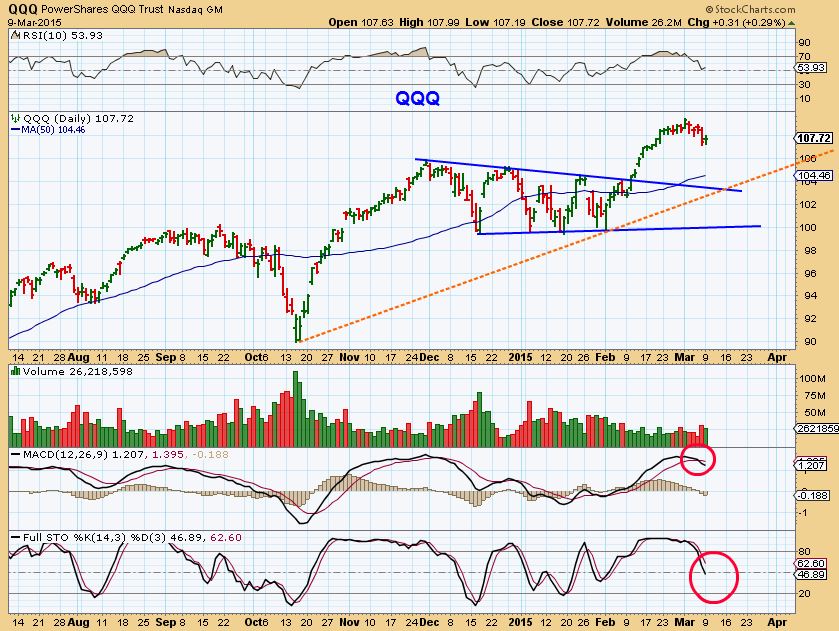
March 9 , QQQ looking for more downside. Notice the yellow dotted line and blue trend line break out
Lets look at the various markets as of yesterday …
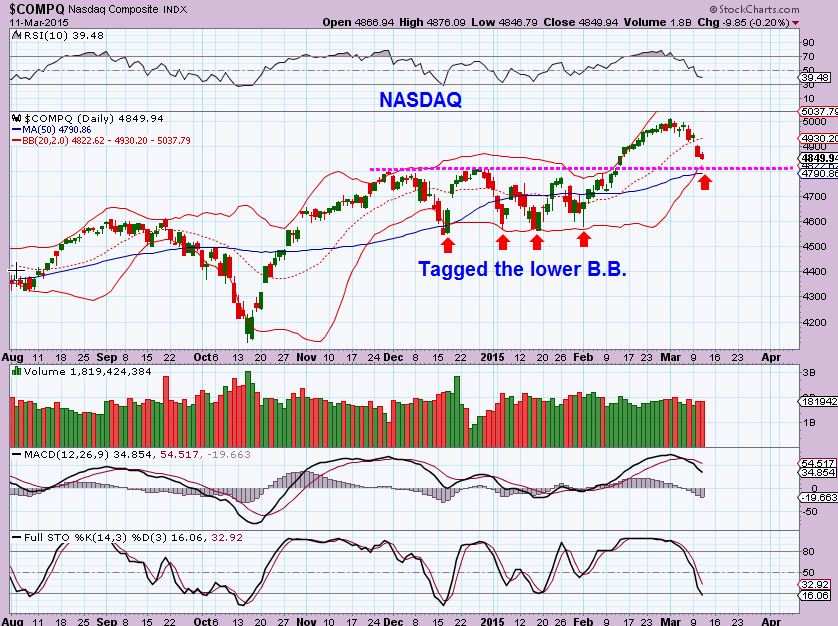
NASDAQ march 11 – we could actually bounce here since the lower B.B. is rising, but I still wouldn’t doubt the green futures turn red and allow a buy near the magenta line . We are fairly oversold.
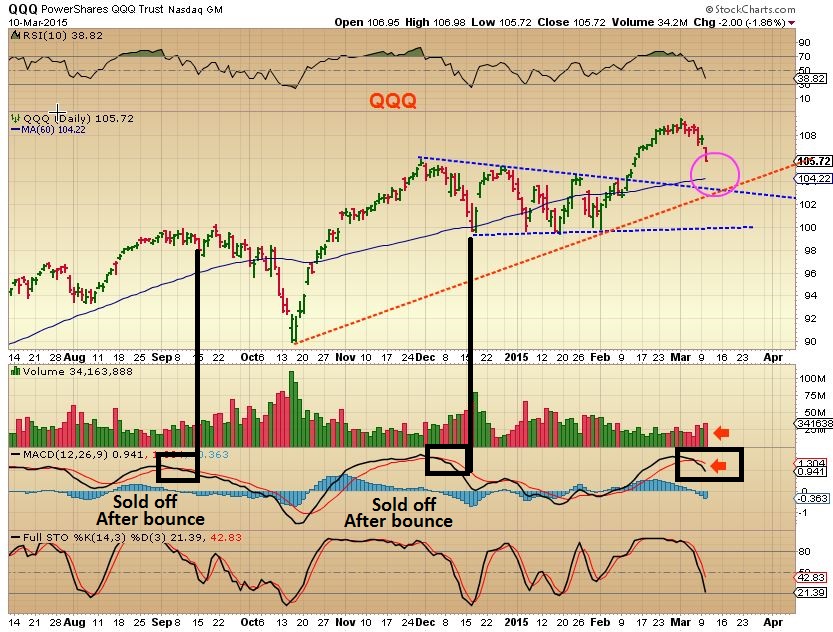
This was Tuesdays QQQ chart. I pointed out the 104- 105 area and we dropped to 105.70.
If I was buying TQQQ for a trade, I might have started a position yesterday because this tested the break out, but we may sell down lower today , like yesterday, even though the futures are green as I write.
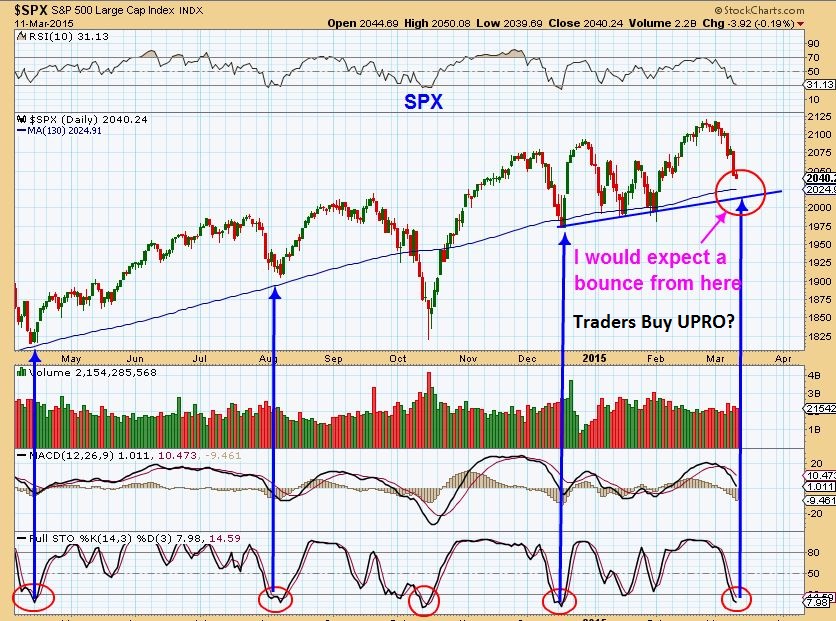
SPX – also looks like it could drop a bit more before a bounce, but yesterday moved into an area that I might start a position .
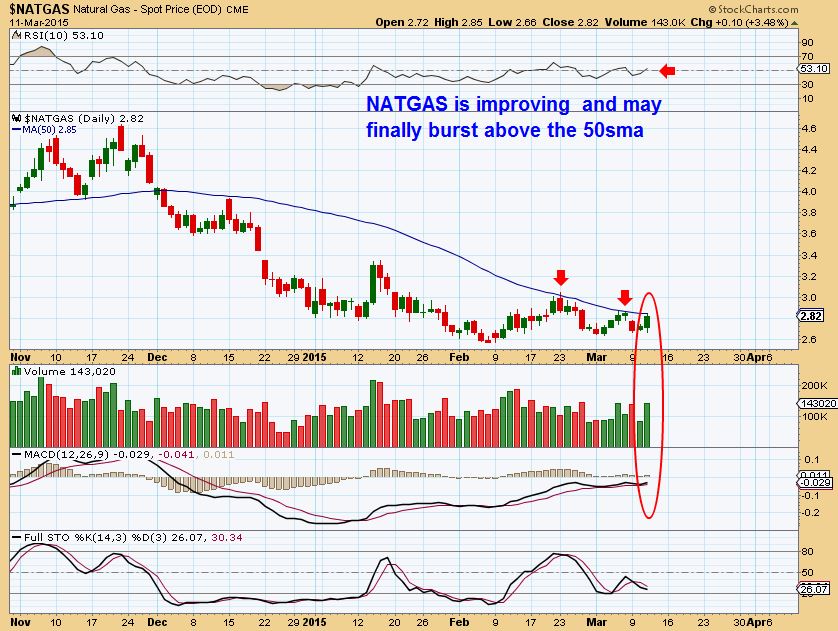
I was thinking that the NATGAS chart was looking weak, unable to break above the 50sma. Futures are RED, but this now looks like it wants to break above the 50sma. INVENTORY REPORT today at 10 a.m. WILL this push it higher? I like the looks of this set up again, I will buy if it rises above the 50sma. The hard part is that most of us trade NATGAS via UGAZ , and it can drop 10-15% per day in this sideways move and has been volatile, so beware and Know & trade only according to your risk parameters.
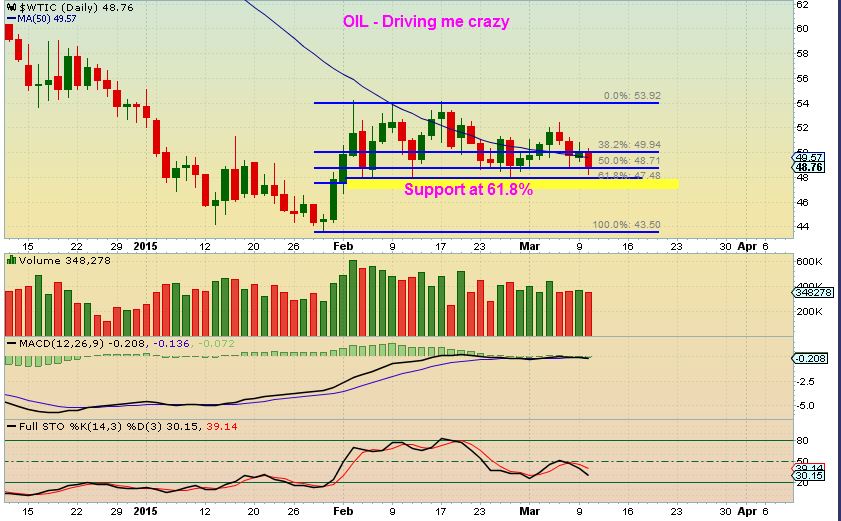
I posted this chart for OIL. It was driving me crazy just going sideways and having me cash out on most of my energy stocks as they dropped towards their 50sma area (and some below) . Notice YELLOW SUPPORT
OIL dropped to support & put in a small reversal candle. If they cant sell it down, will it move higher in this range?
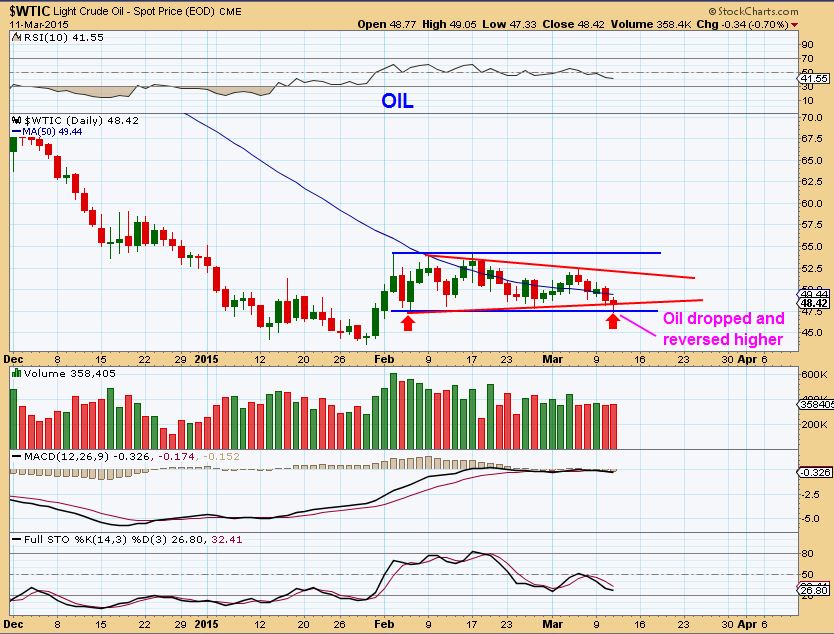
Normally I wouldnt feel strongly 1 way or the other, but yesterday many Energy stocks started to perk up again. Stocks like BASS , AXAS, EXXI , etc are right at their 50sma and getting oversold. A move by REXX, KEG , ERF and so on back above their 50sma could be an easy recovery. The point is that the ‘set ups’ again look rather promising .
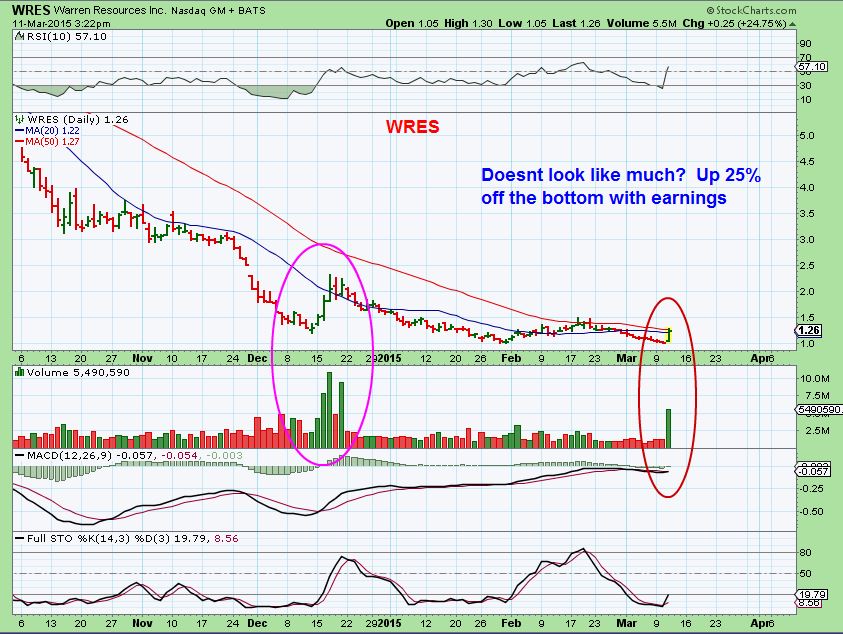
WRES had earnings release & it was positive. It double bottomed with Jan lows.
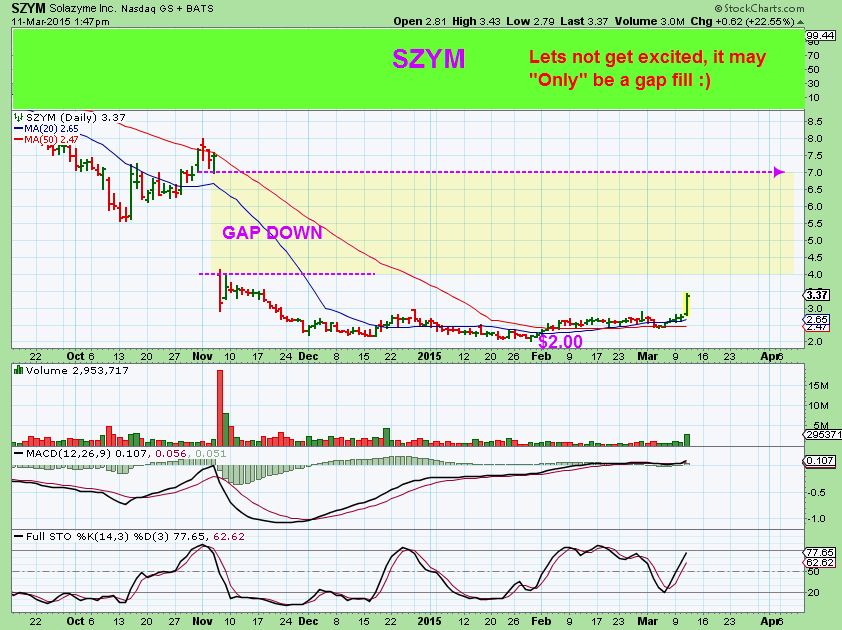
SZYM– I loved that base , and it dropped to the 50sma and reversed. Yesterday POPPED on above average volume. ( ignore the writing, it was a joke to a friend)
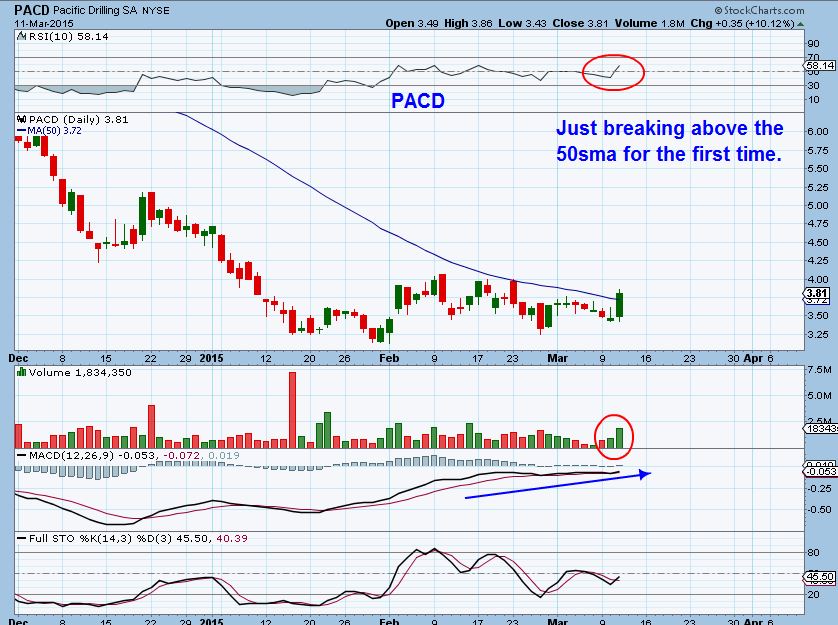
I started searching ENERGY stocks again at the end of the day to see if I liked any as of the close yesterday. I liked this “Lagger”. lagger because it hasnt moved above the 50sma yet…until yesterday. I quickly checked to see if they released earnings yet, and they did..SO I bought it near the close.
PACD- I like this set up. Remember: These usually break out, run, and return to “Test” the 50sma. They all did, right? SO I will sell if it runs strongly. Also I may be early.
Think about this :
We are in the game of probabilities & likelihood– No Guarantees! That said, I look at what might be likely to happen, so when I see in Energy many stocks starting to top & return to the 50sma , I start cashing in. When I see MANY of them linger at the 50sma and start to recover? It is then that chances increase that the selling is slowing and we may get a bounce, another leg up, a buy opportunity that is low risk. Why low risk? If you see 8 out of 10 stocks regain the 50sma, you can buy one near the 50sma and your stop loss is right below.
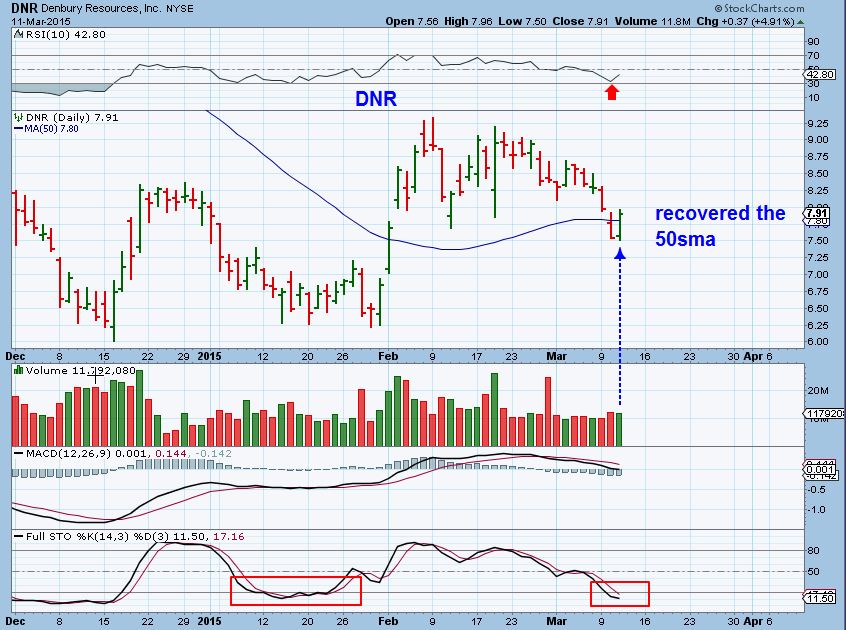
I looked at EXXI, it reversed & looks ready to possibly recover the 50sma. KEG was up 10% & may regain its 50sma, ERF & DNR are there too, so not just 1 or 2, but quite a few are starting to look like they want higher price and selling may be drying up…
DNR for ex:
GOLD -SILVER- MINERS
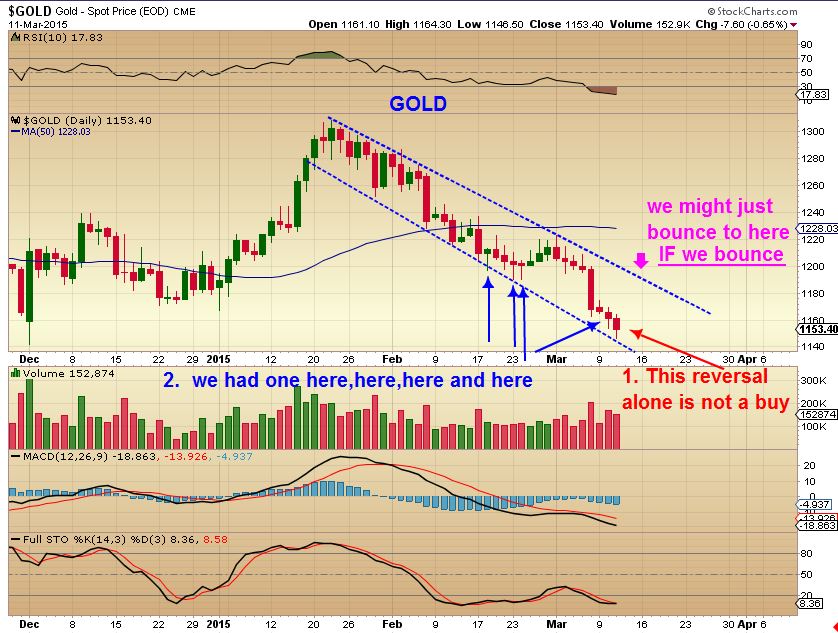
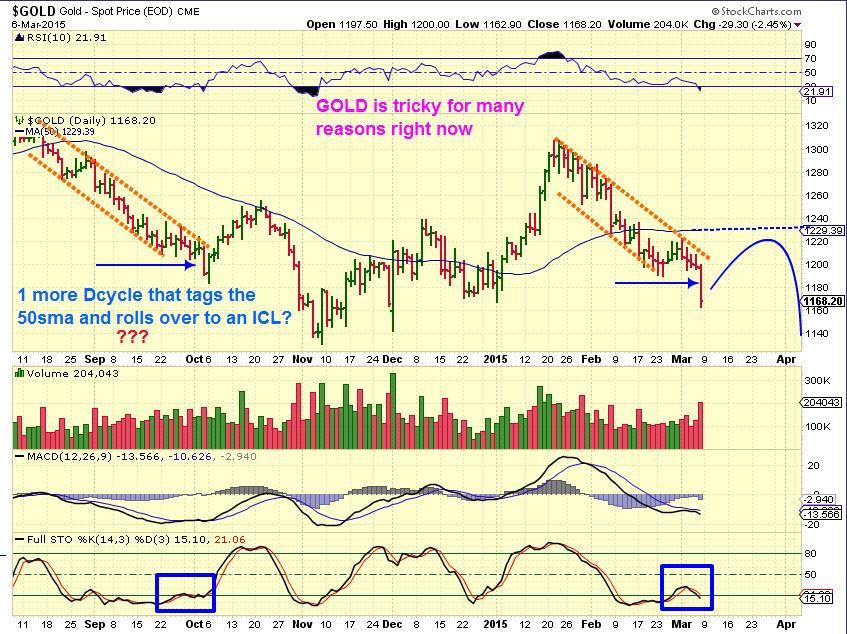
GOLD – dropped to $1146.50 & reversed higher
SILVER – Reversal after running the stops?
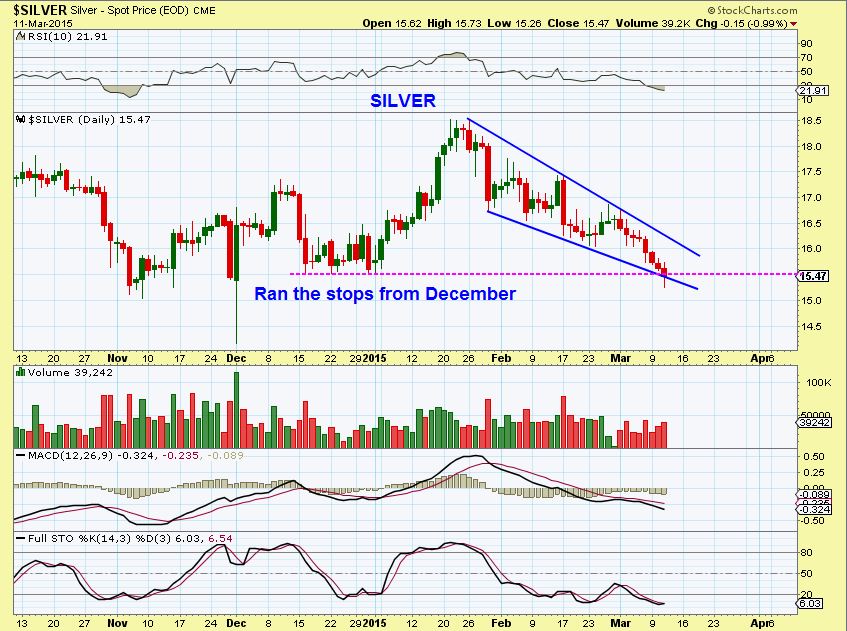
I already showed this on March 6, it still applies. Basically this is a strong bounce ( we may not get a strong bounce if we are in a 4th daily cycle here). See what happened in October & imagine it now.
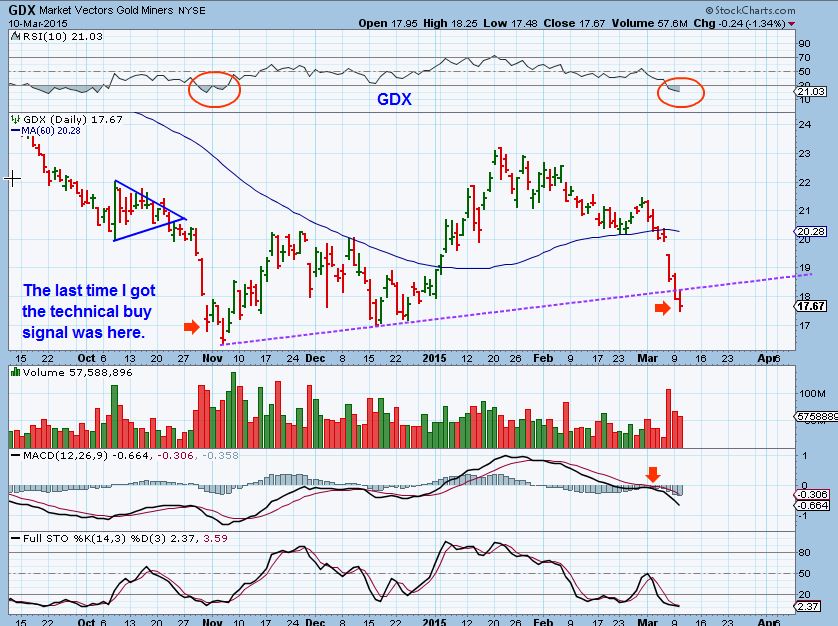
If you read the ‘comments’ section of the reports as the day goes on, you likely saw where I said I took my long trade in Miners 3xETF yesterday near the open ( NUGT) . I bought when GOLD dropped $10 and Miners sold off too. Why catch that falling knife ( & why didnt I recommend?). I got a very reliable ‘trigger’ for a buy, but it has No upside price target & can be a very quick scalp, not for everyone. It is an indicator that tells you when to buy ( Blind ), and a day or a couple of days later, that same indicator triggers a sell regardless of price ( could be today or tomorrow). SO I expected a “BOUNCE” in GDX using that indicator…but to answer the question , “When will you sell?” Is unknown. Either when that indicator triggers my sell or when I want to based on what I see.
Yesterday I DID PUT IN MY REPORT that I got that trigger to buy, especially a gap down. I warned that last time I got the trigger, it popped for 1 day and then dropped for 2. I Posted this chart. THAT is why I didnt want to recommend it. If you bought and it dropped for 2 days? Its not for everyone.
I want to point something else out as a cautionary note.
GDX yesterday- looks very convincing . Hit new lows and reversed, nice volume, oversold. IS THIS A GUARANTEE of a run up to the 50sma?
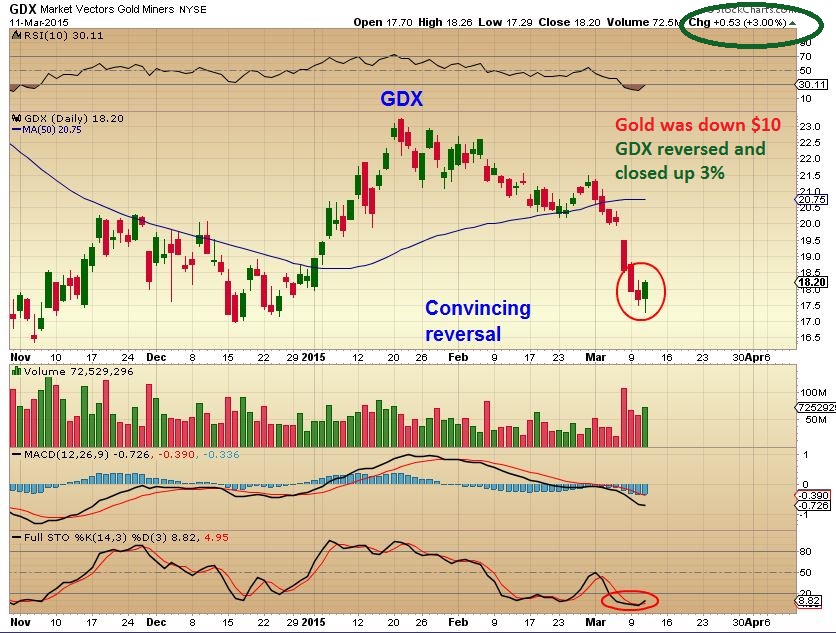
NO Guarantee. Sure, I could expect a test of the 50sma, but I use this chart as a reality post to keep us well grounded. If we are starting a 4th daily cycle ( weaker one), you may hear Gold Bulls in yahoo blogs, etc screaming that GDX bottomed and a new run is starting. NOTICE the FLAG PATTERN on the left in October 2014. If this flag pattern happens again, your 3x ETF and ‘call options” could just be another loss.
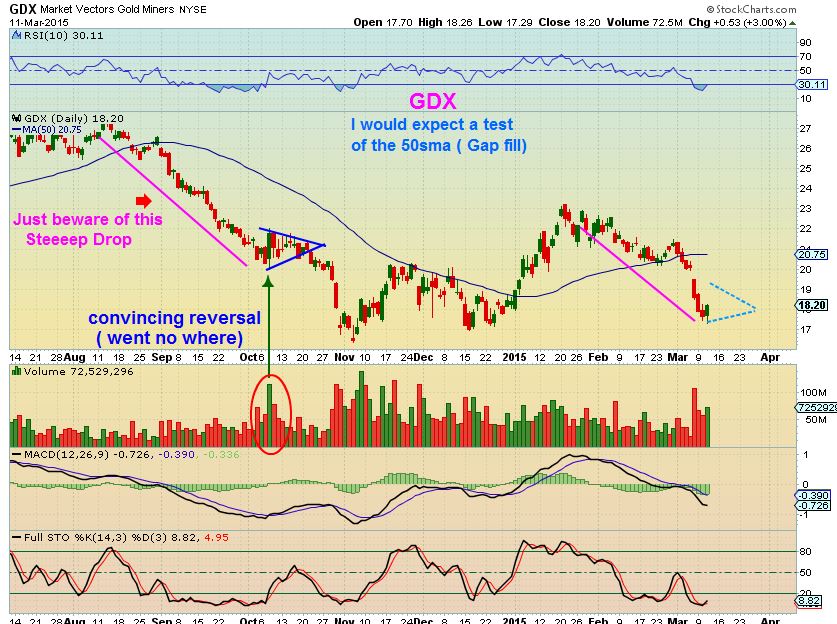
SO thats how I feel about METALS & MINERS. I think we are due for a bounce, but how much? I cannot know. That flag pattern in the above chart looked convincing with that high volume reversal. It was likley the shorts covering and the BUYERS never really stepped in. Beware and watch for that if you are trading the Metals/Miners.
I like to provide low risk entries to keep losses small and potential gains bigger, so I am again looking at the energy stocks and we may find another leg up to continue the ‘base building process’ that we have seen in this sector. Watch for the stocks I mentioned above in the energy section to cross back above their 50sma if you are interested in this trade. I will let you know if I see anything more that stands out.
Thanks for your patience while waiting for Metals commentary. Happy Trading.
~ALEX
P.S. KEN, RIG reversed yesterday right at JAN 15 lows . Thats a low risk buy with a stop right below
I Love Bases 
 Best Fit
Scroll to top

BAS NADL EXXI RES all look good on the hour chart. I bought some Yesterday. Hoping for a run up to the 50sma. Keep us posted
Yes, when 1 or 2 shape up, I dont give it too much credit, but when selling slows down in 8 out of 10? Things start to look more bullish. The ones you mentioned do look interesting. Like I said, I bought PACD as it crossed the 50sma, now I just need follow through.
Brilliant support Alex and data/info/background. Brilliant. Thank you.
Thank You Jonathan, I appreciate that. This choppy stuff can get really confusing or frustrating for traders and investors, so I’m just trying to find the most likely scenarios going forward. Its a little tough, so thanks for the kind feedback.
I was hoping for a little more of a drop in the spx before buying upro……if this holds close to the end of the day, I’ll probably buy near the close……do you agree
Very possible, but Its not possible to know for sure. It is on the lower B.B. & reversed hogher , so it could be a chance at a bounce or double top, etc.
When I dont know for sure, I just take a first position , but keep my position small and if it drops more I decide then to add to my position or cut it loose. Its tough with UPRO or any leveraged etf because the moves are exaggerated.
ALEX…. did you read the Nat.Gas inventory?
Thanks
no
Geurt, did you read it? Oil is taking a hit, so I assume more inventory than expected..
Was the inventory on oil not yesterday Bill ???
Good Morning Alex,
I did get filled yesterday morning on RIG. I did not buy the leap call options but bought the stock based on the 20% dividend !!!! My stop is some what deeper than usual based on my thinking this “could” be a long term hold for me and may add a bit if it drops below the Jan. low.
Thanks for looking at it for me/us.
I can see it at a support area here, and it reversed higher so it looked pretty good,
The other way that I was looking at it was…”Is this an A-B-C-D down?” That could lead to under $13, but I think it is less likley . refresh to see the chart.
.
Yes I agree. I have the same trend line as you also.
The energy complex “could” take another hit lower which then RIG will follow but I do like the risk ratio at this point……that could change in a NY minute though ! 🙂
RIG a 20% Div, wow. Might be a good long time buy and hold here for some.
Alex, I got into NUGT Yesterday morning. Up good already, please let me know if you get a sell signal. I’ll add it to my decision process. Thanks.
I didnt get a signal, but I sold mine when it was up over $1 from my buy . I think it could go higher, but the signal I would be waiting for is more ‘time’ than price and if you look back at al other daily cycle lows, they tend to POP / Drop / then go higher. I just wanted to scalp with that signal , because it is pretty reliable that a low is imminent.
If you want to know what the signal is, I can tell you- no problem, but it’s based on GDX, not NUGT. You must use a gdx chart.
I actually think it MIGHT be bull flagging on say a 3 day / 15 minute chart – I will be away this afternoon, so I just wanted to scalp.
hi Alex.
yes plz.. tell us what your GDX signal is!
The sell signal from here is simple.
USE GDX and put the RSI on 2 , so its an RSI(2) reading. When it hits overbought at 80% , it doesnt matter where price is…you just sell. It is often a 2 or 3 day trade. Look at Feb 24,25,26,27 with RSI 2, and you’ll see how it ran to 80% . REFRESH FOR CHART.
It is a “SCALP” only trade, so it can get you out too early too, but it is to scalp a move off of the bottom.
I am gone for the afternoon, best wishes all.
Yes, of course Id like to know.
Bill…. look at GDP…. is this a head and shoulder?
Geurt, I don’t see it? What time frame? hourly chart?
Sorry Bill now I see your comments.
Look at a 6 months daily chart.
let me know Bill.
Thanks.
I dont think so, I don’t see it! I think the chart does look good though. Looks like a double bottom. Then look for it to go up.
Alex, not at the sell point YET? Looks like GDX tends to double bottom each time it bottoms. Kind of a loop at the lows? See the purple curves on the chart. Could be doing the same. I am concerned that there is no momentum raising this stock.
I said that in my comment to you this morning. maybe you didnt understand me…I will copy/paste what I said ….
” if you look back at all other daily cycle lows, they tend to POP /
Drop / then go higher. I just wanted to scalp with that signal ,
because it is pretty reliable that a low is imminent.”
.
when I said they POP, Drop< then go higher, that is what I meant. Thats why I sold.
Got it! Thanks
GDX, going to a double bottom. Looks just like before (see chart below). This may put us in position timing wise for the next big run up. I’ll rebuy NUGT there with tight stop and risk lower. Nothing to get excited about, could be a double! 😉
I am watching the same thing…how GDX approaches that area. At the DCL , you almost always get that initial bounce, and then a drift lower to shake out longs that jumped on the top of that bounce. Then you get a real run higher , but I am still cautious about it possibly being a 4th daily cycle. I do not buy 3x and hold for long in those times.
What do you think, pretty close to a double bottom? NUGT starting to rebound! Will this be the 4th or the 1st DC?
Bill, don’t forget FED coming up next Wed. Anything even pretending to look like a rate increase will slam this complex, even if the over reaction isn’t rational.
Sold my energy stocks, this doesn’t look good. I think WTI is going to $43
Hey Bill,
Yep, below the 50sma and the stops took me out ( except SZYM & PACD…my stop on PACD is below the 10sma). Sold some szym for profit taking, but holding original purchase.
The second run up didnt come to be (except maybe EXXI had one and a couple of others). And I re-read the report above where I pointed out possible strength returning with DNR recapturing the 50sma& KEG turning higher. DNR lost that 50sma yesterday and they all looked weaker again.
OIL does look like a break down into a daily cycle low and could double bottom . Lows in Jan were $43.58 I believe. Now I’m looking to see if that support holds and how do the energy stocks look during that sell off. They should hold up better than oil or its not a good sign.
Still holding SZYM, YGE and PEIX. Have YGE on a short leash. Right at 50DMA. PEIX and SZYM both look like they are bull flagging after their big pops. Any opinions Alex?
When I am looking at SZYM, I look at AMRS, PEIX , CLNE also, because they are clean fuel too and did the earnings POP first. They POPPED, sold off to near the gap fill , and test the break out area.
I like the way CLNE, AMRS, PEIX have pulled back, so it gives me confidence that SZYM should be fine (may test the break out / Gap fill at the 10sma short term unfortunately).
Thanks Alex. Same thoughts here.
Refresh for a chart…it looks great long term, testing the break out , but I want it to hold there (I may add there)
nice…tx
Yup, that’s what I’m thinking. See the chart below H&S
Yes
Yup! Maybe lower? Fundamentals are horridly bearish right now.
Yesterday in the S & P we had a TSI crossover (7,4,7), regained and held above the 50ma….so I bought a starter position in UPRO…..looking for a second conformation, obviously not getting any now…..what are your thoughts on what’s going on in the market today.
If you look at the report above , I have charts of SPX, NASDAQ, QQQ & targets that I was looking for. We havent reached them yet.
If we close here today or near where they are now,, it causes the wkly charts to close at its weekly lows, and a small drop next week and reversal would match the above charts. I actually thought yesterdays reversal looked real and would hold, but maybe the above charts will still play out.
I think it was bullish, that the market started to turn towards the end of the day…..and the BoW number for SPY was building….over 3 billion in BoW numbers for the last 2 weeks…if we’re are not there, I think we are close to a bottom
Harry, agree, almost jumped on it also, but then held off to see Monday’s morning. Decided I’d rather risk missing any potential gap up (and go!) Mon vs the risk of selling off further once I started position.
Hate to be Negative Nancy here but the whole commodity complex looks to he rolling over to me, and $$ parabola not helping!! I’m not only out of the energy stocks, I’m short crude on this weeks breakdown. Also short Natty gas, recently playing the 2.84-2.68 range has worked, closed out half gas puts Fri at the morning lows, holding half into next week. I hate chasing mainstream but also opened UUP long, not that I think this can keep going but more as a hedge in case it does.
Personally, I thought the action in miners and really more actual gold was near putrid last week. Remebering that this is the ‘bounce’ here. I’m also firmly entrenched in the 4th DCL camp. In Jan the market sell off lent spt to gold, here it is not which worries me (again $$ is also an issue). If broad market regains composure next week (watching Alex’s target), could also hurt. Fed on Wed is the wild card for all. While looking more towards shorting pops in miners not getting carried away ahead of Fed probably a good idea. The most troubling is lack of 4th DCL bounce bodes very poorly for the complex when it drops into the ICL, there isn’t much room below without near bear market lows!!
Sorry had to comment Sat but was not avail during trading hours last 2 days. Have a good weekend all.
Thx for sharing.