Lets review some charts and examine what possibly fits next weeks possibilities.
SPX chart from March 11, looking for a buy point
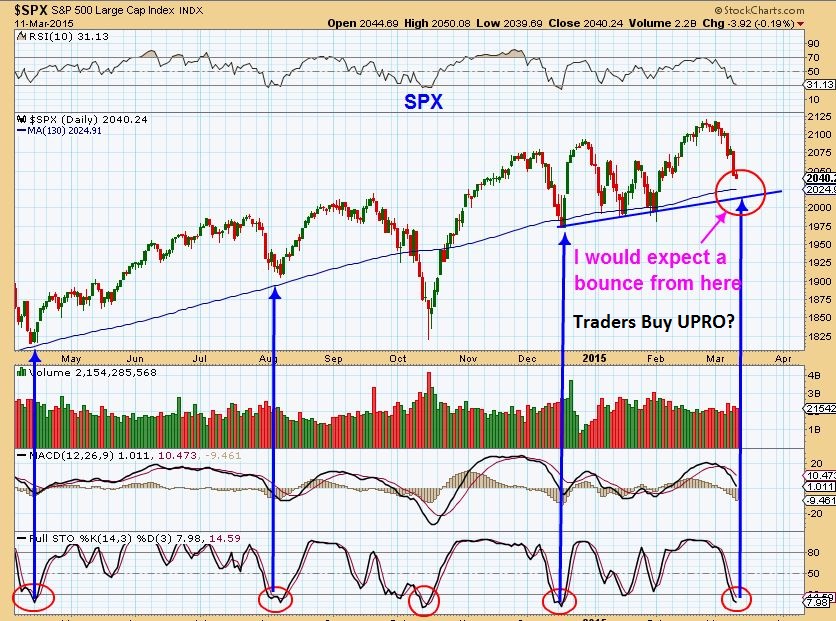
SO where does the SPX stand now?…
SPX– It didnt drop to where I thought it would, in the past it hit the blue line. however…
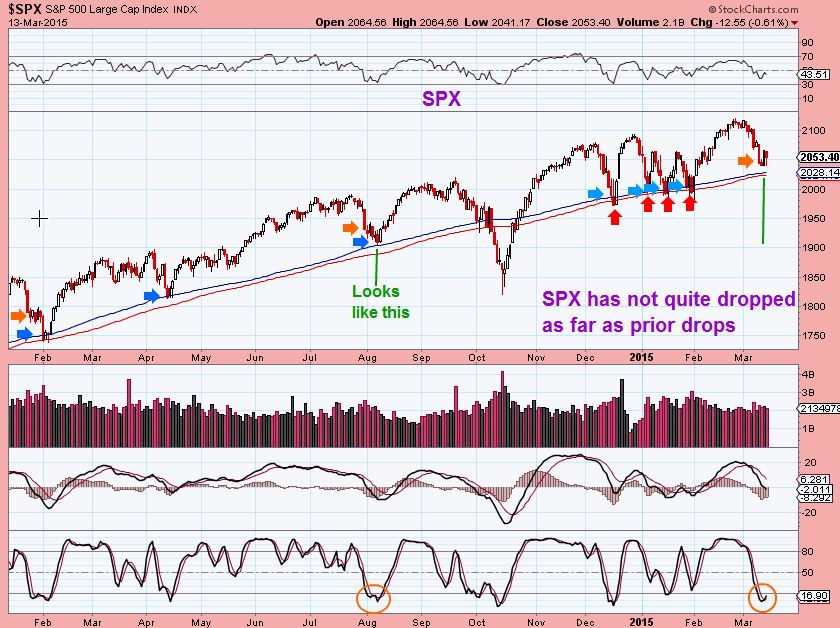
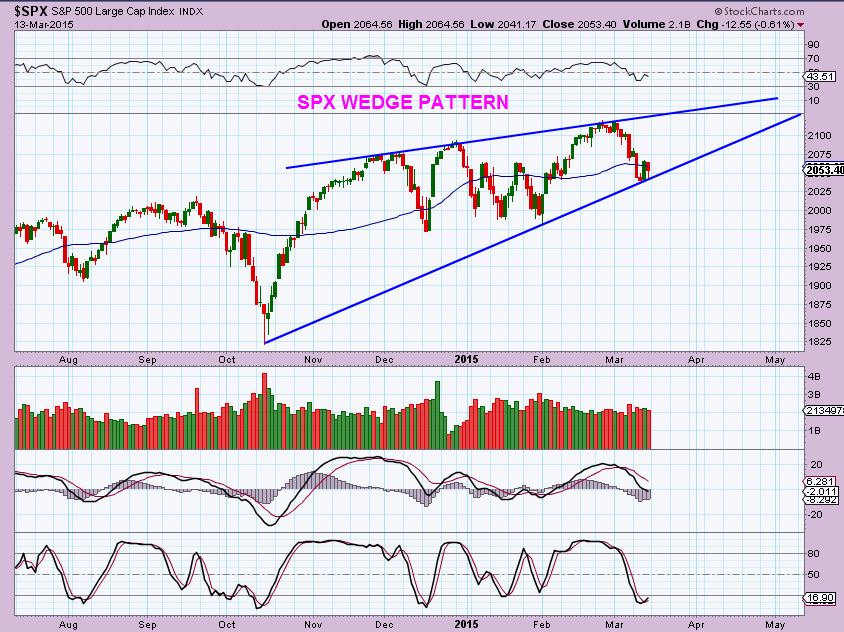
It may have stopped dropping because its on a trend line. A bounce from here could be part of a wedge pattern. Each time we slightly break new highs…it fails. For those trading , keep that in mind.
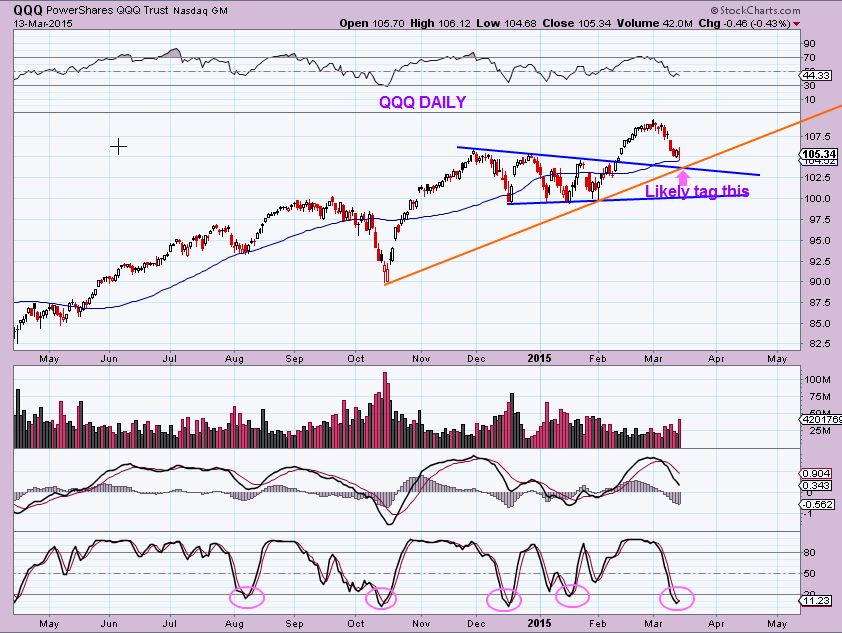
QQQ – Dropped to the blue line, I expected a tad lower. If I were looking to go long (TQQQ for example) I’d look for possible drop & reversal off of this Orange trend line Monday, or it my just bounce from here. Stop below the Orange line.
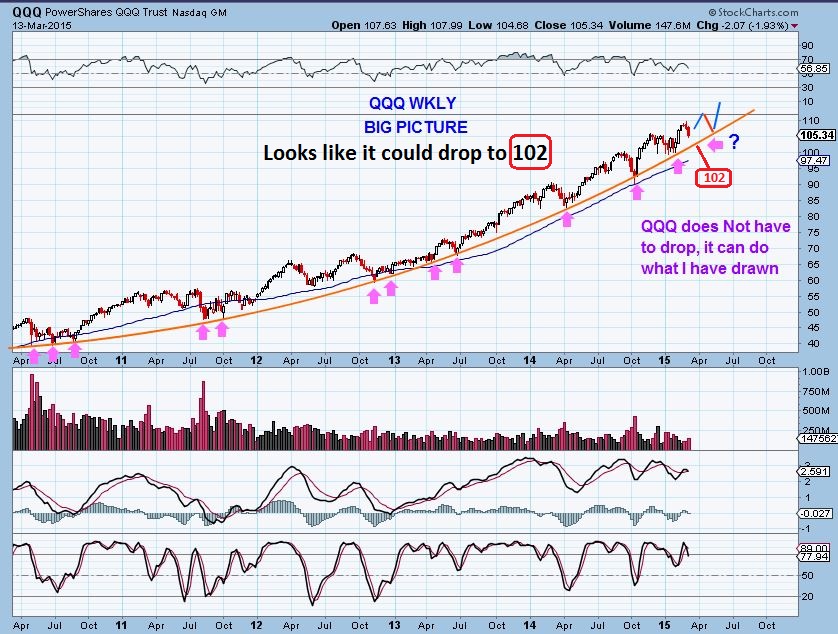
QQQ WKLY- Actually looks like it wants 102, but may just bounce & drop later to this parabolic line
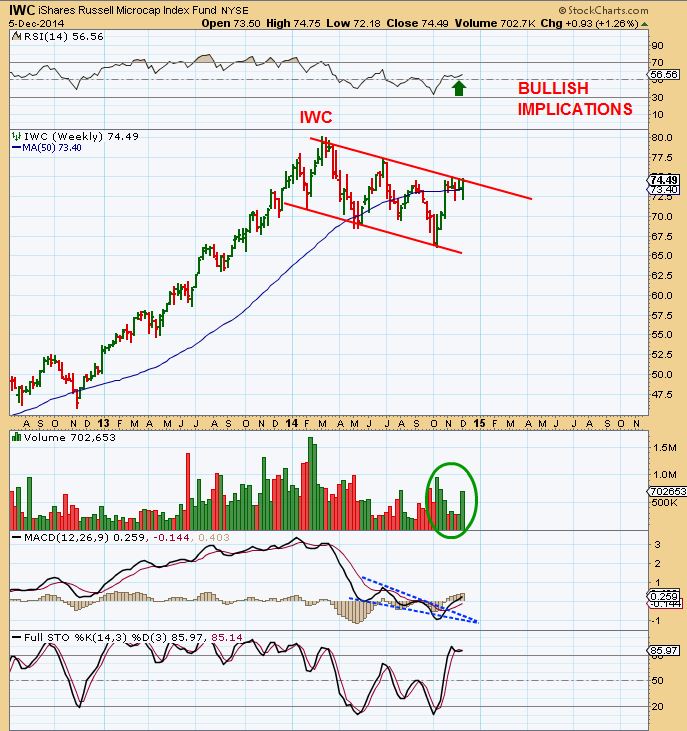
In the past, I noticed and noted some bullish set ups in the Small & Micro-caps ( IWC , IWM & RUT). As the SPX, DJIA, and NASDAQ ran higher, the small caps just sold off & lagged behind. It didnt look bearish to me , however, it looked like a consolidation . I posted these Wkly / Monthly bull Flags…
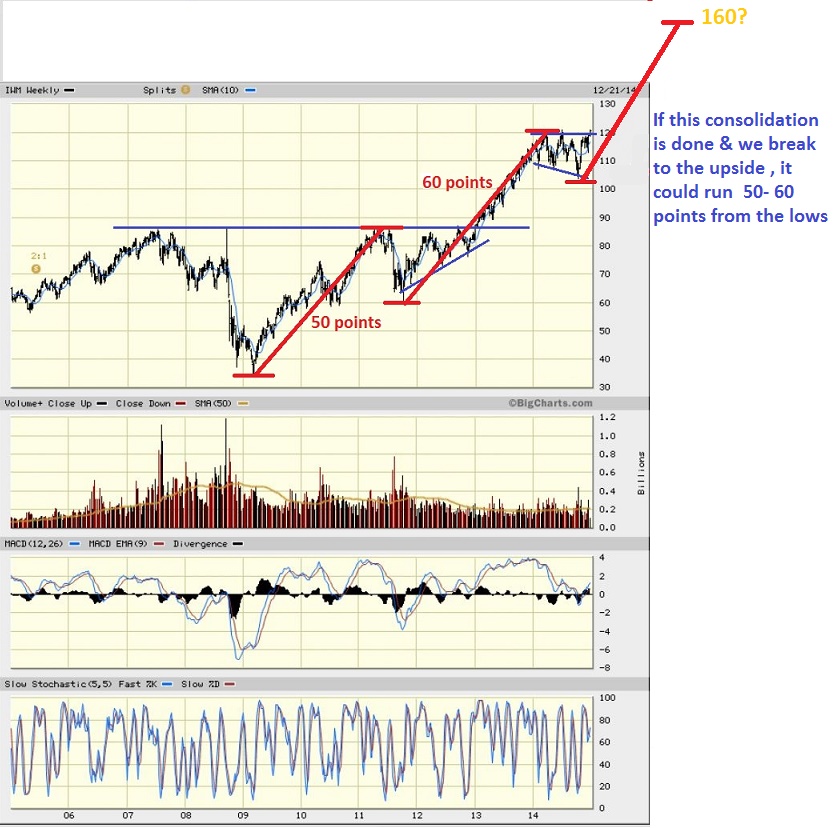
IWM Bullish Pattern
How have they been playing out since then? These charts look to have formed very bullish patterns …
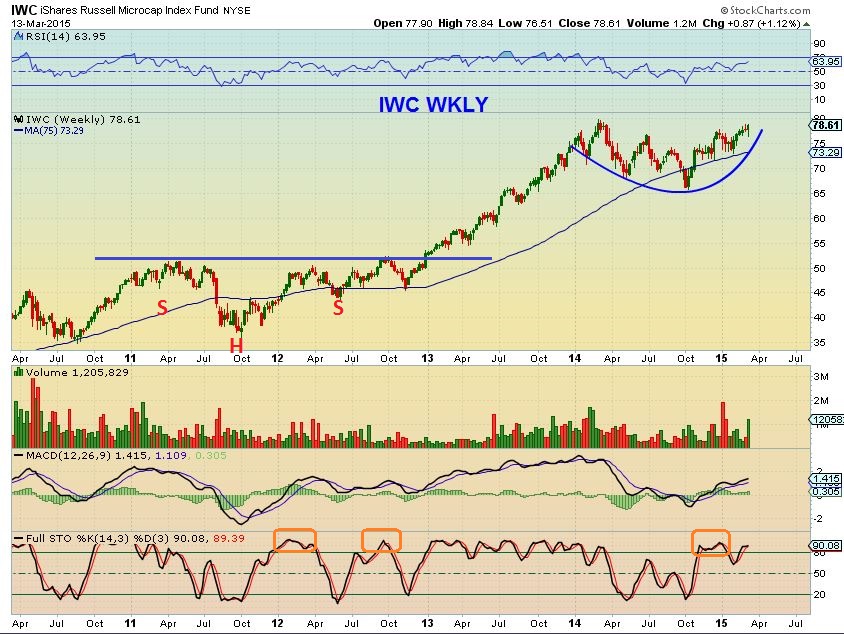
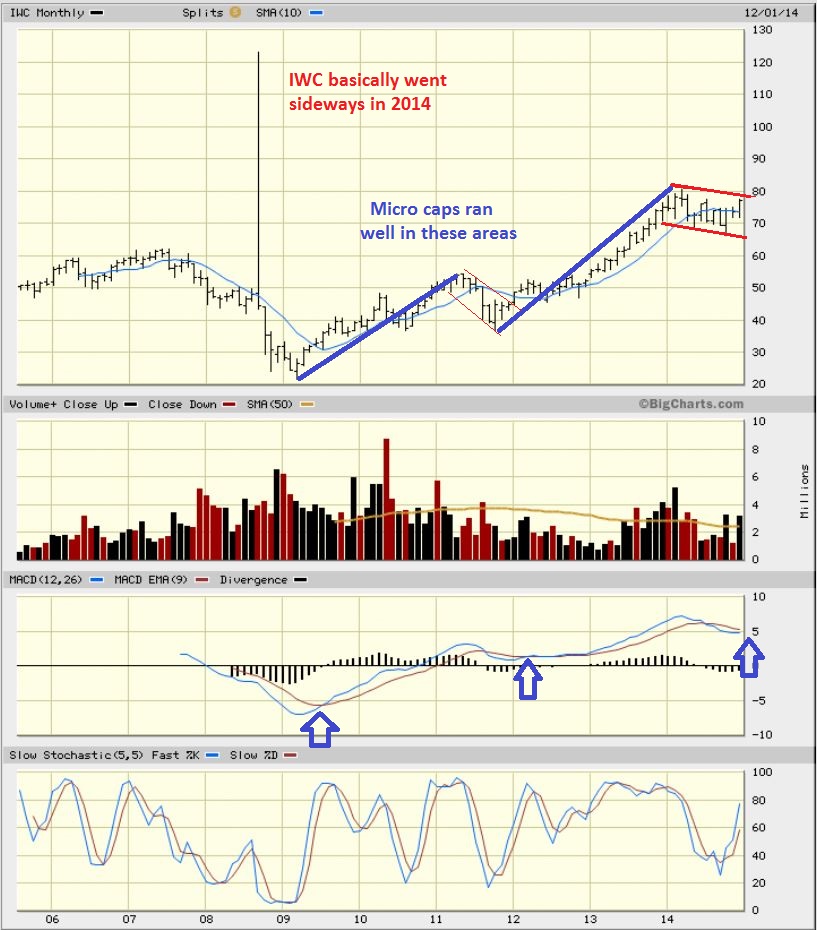
IWM WKLY looks like a break out & test already. Notice that this has really been a sideways move for over a year. Small Caps and Micro Caps may start to break out from consolidations and bottoming moves that they have been in, if this plays out.
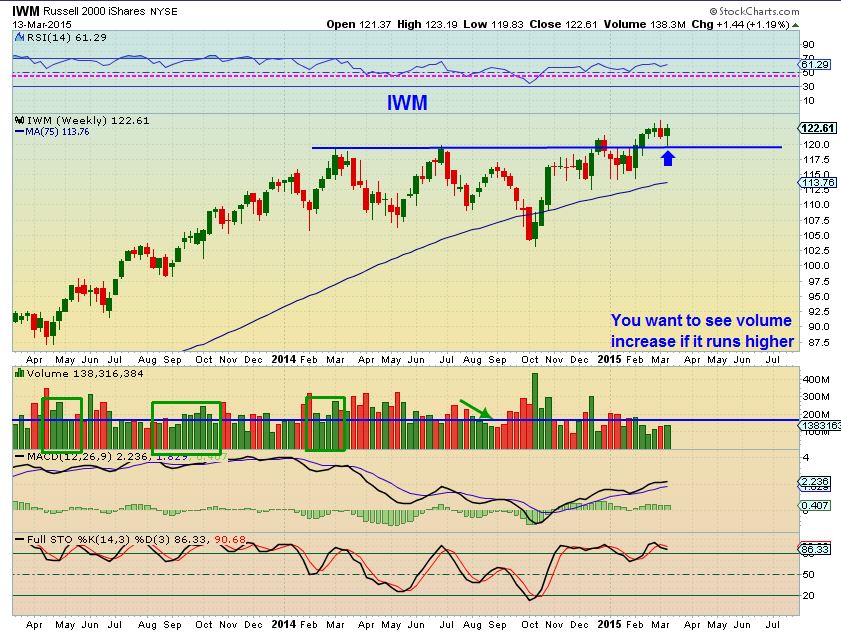
SO will the Small Caps and Micro Caps run higher as the Nasdaq continues into a parabola? I did not think this was the likely outcome going forward, it certainly could happen though. I actually expected the markets to pullback into a correction soon. It will be interesting to see how these all play out going forward.
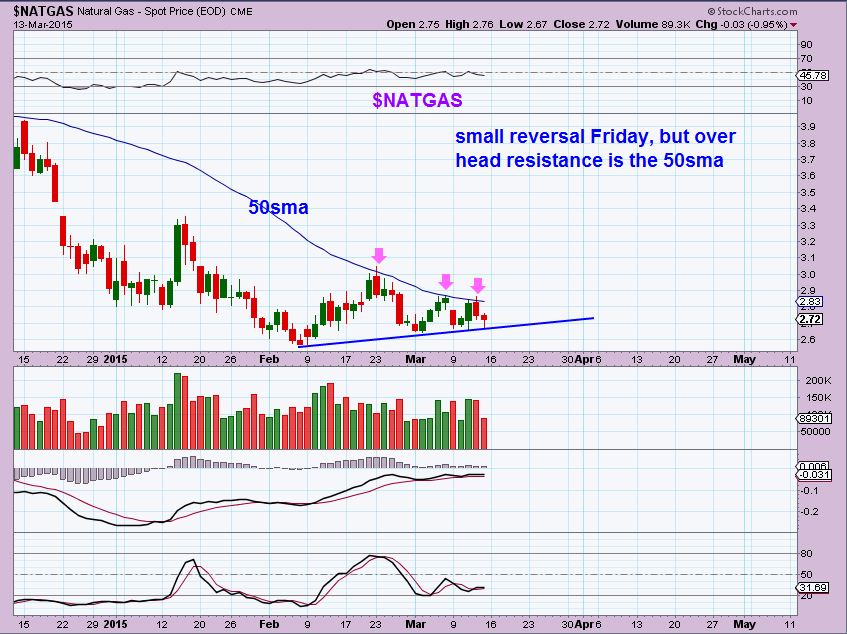
NATGAS – dropped on light volume Friday and had a small reversal, but still struggles at the 50sma. This week should clarify the intended direction.
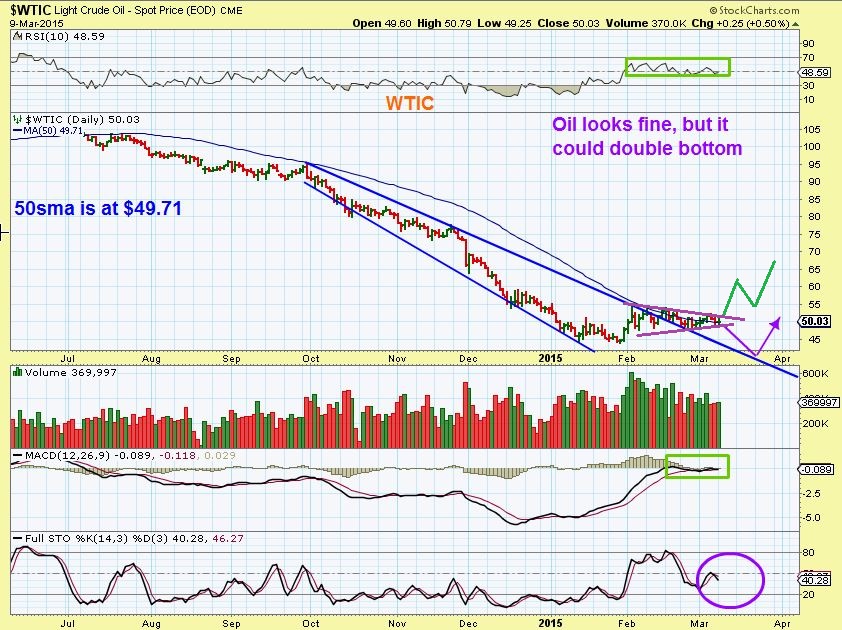
OIL – I had expected OIL to break out higher off of it lows, since the energy stocks had that. Some energy stocks had run up 100% before pulling back , as OIL put in a sideways bottom under the 50sma.
As time went on, a daily cycle low was closer so it had to be excepted that it could now drop to a daily cycle low. I posted this chart March 9. TAG THE BLUE TREND LINE ?
This was OIL Friday as it broke down.
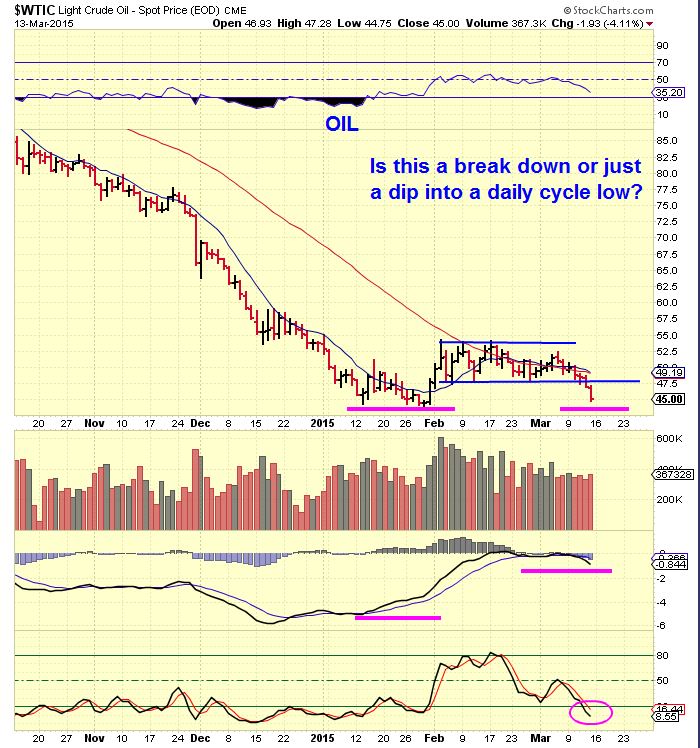
I am now hearing MANY say that OIL is weak, we had a bear flag , It is breaking down – “Short it, its dropping to the low 30’s!”
I want to tell you this about that…
– Can it drop to the lower $30’s? YES, inventories are high and Supply / Demand fundamentals say yes.
– DOES Fridays drop guarantee that OIL is now a Break down? NO
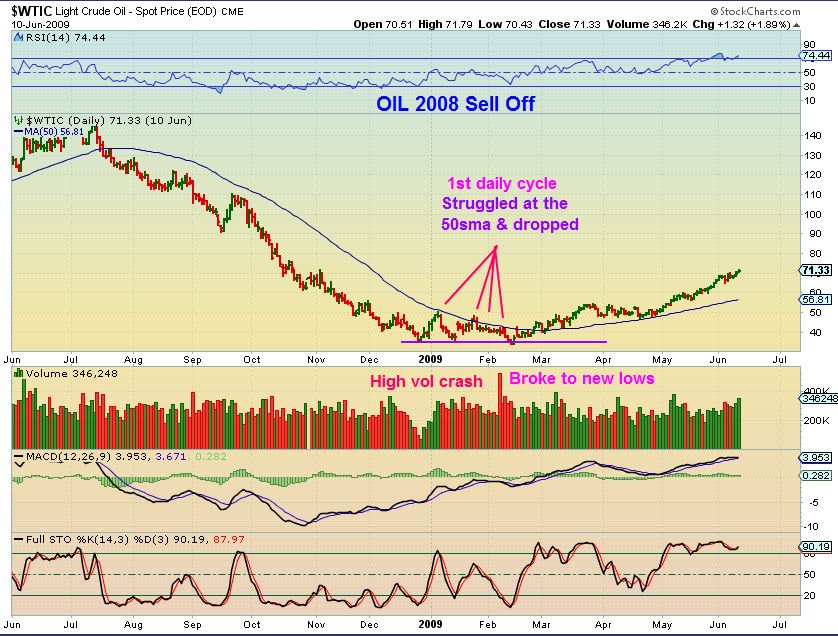
Lets look at some charts. I read 2 articles where the writers stated that because OIL didnt break out higher it was ‘weak’ and doomed. Lets look at a chart of the huge sell off in 2008 and see what that bottom looked like.
1. It went sideways for almost 2 Months
2. It struggled at the 50sma
3. It sold off on high volume & broke to new lows.
Kind of looks identical to now
OIL 2012 – OIL cycles look to vary ….ROUGHLY 2 months , but the chart shows 1.5 or even 2.5 months.
Lows 2012 = Large sell off & bounce. 2 Months later fast drop back at lows ( Like now) .
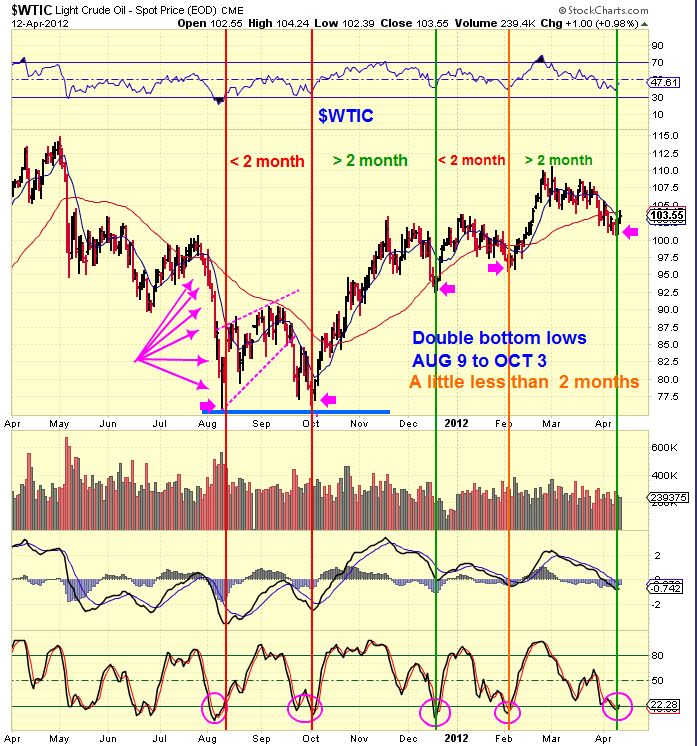
Yes, OIL has sold off like 2008, and often you will see OIL double bottom. I’m personally not looking to short OIL here, after looking at these charts. One of my indicators is telling me that the selling is about done. The daily cycle has been long enough, but yes it could extend downward. Instead , I will look to go long at the next low. Many ENERGY STOCKS do not look as bad as OIL. Many Energy stocks arent at their lows with OIL at it’s lows, so if OIL drops to the $30’s, They may just double bottom.
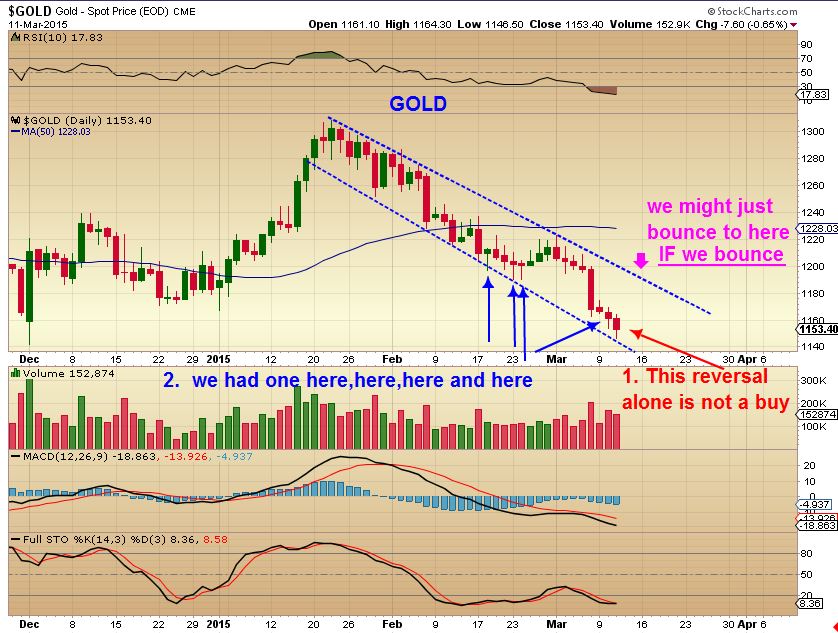
GOLD SILVER & MINERS- Nothing has changed since last week really. We are expecting a Bounce, a 4th daily cycle. It can be traded by traders, but I expect it to roll over and lead to a real buying opportunity.
I posted this MARCH 11, we are in the same area 2 days later. The lows were $1146.50. A sell off below that is a new low.
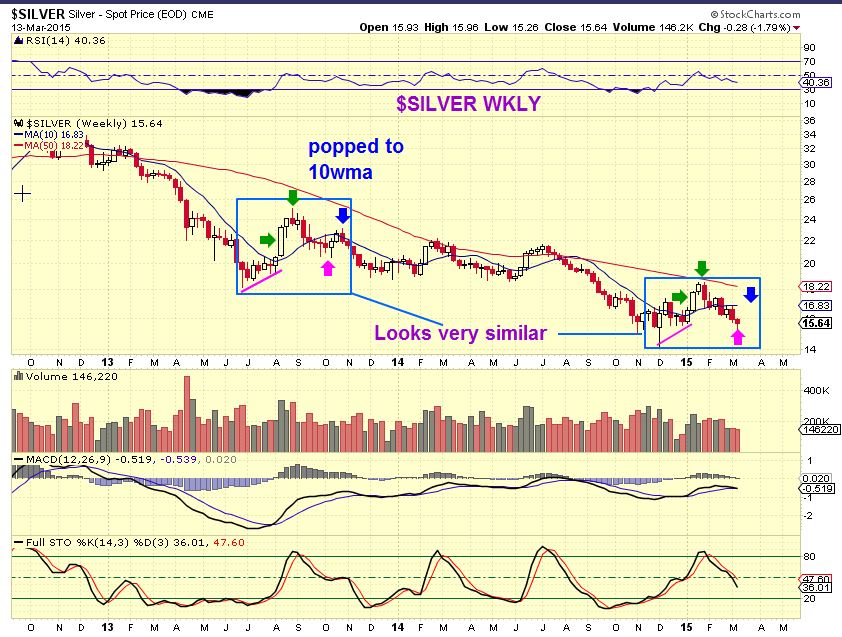
I want to share a chart of SILVER with you. Look at how similar the cycles are so far. I have been saying that this BOUNCE could be 10 days ( 2 weeks) . The Box on the left has a 2 week bounce right here. Notice
1. Magenta line out of the ICL
2. Green arrow POP
3. Green arrow Top
4. long drop to lows Magenta Arrow ( Now)
5 . 2 week bounce to blue arrow at the 10WMA
6. Drop to ICL
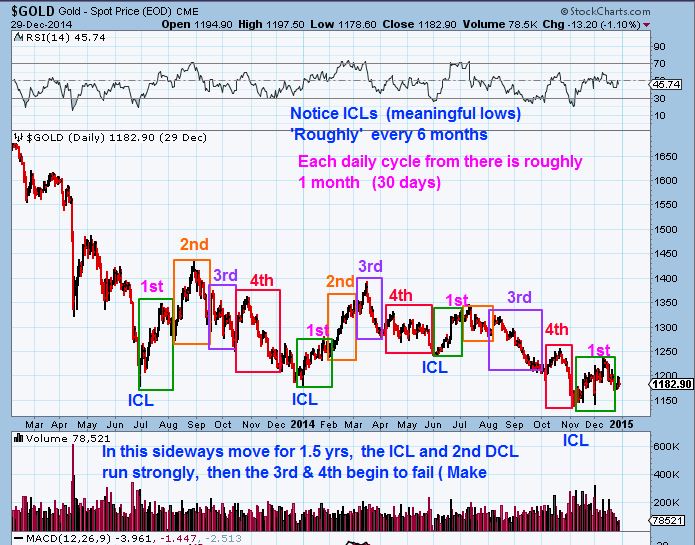
I drew this for GDX CYCLES in DECEMBER- what to expect in each daily cycle.
I was trying to emphasize trade the first 2 aggressively, the 3rd & 4th drop a lot.
It has played out fairly similar to the first one. The ORANGE LINES can be next move (4th daily cycle)
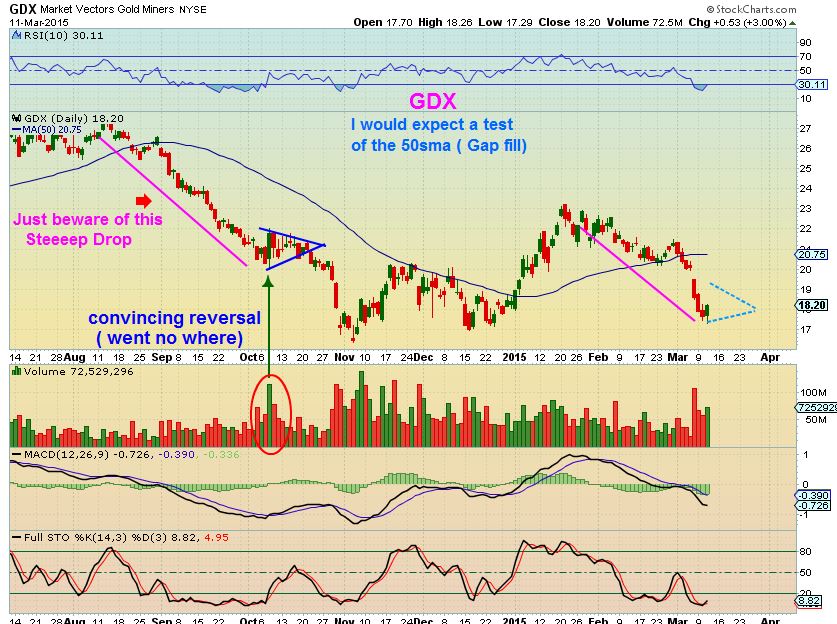
GDX JAN 23…I looked at it playing out this way into April , and was trying to say that playing a 3rd or 4th Daily cycle can be tricky. Next best Buy is the ICL ( Deeper lows).
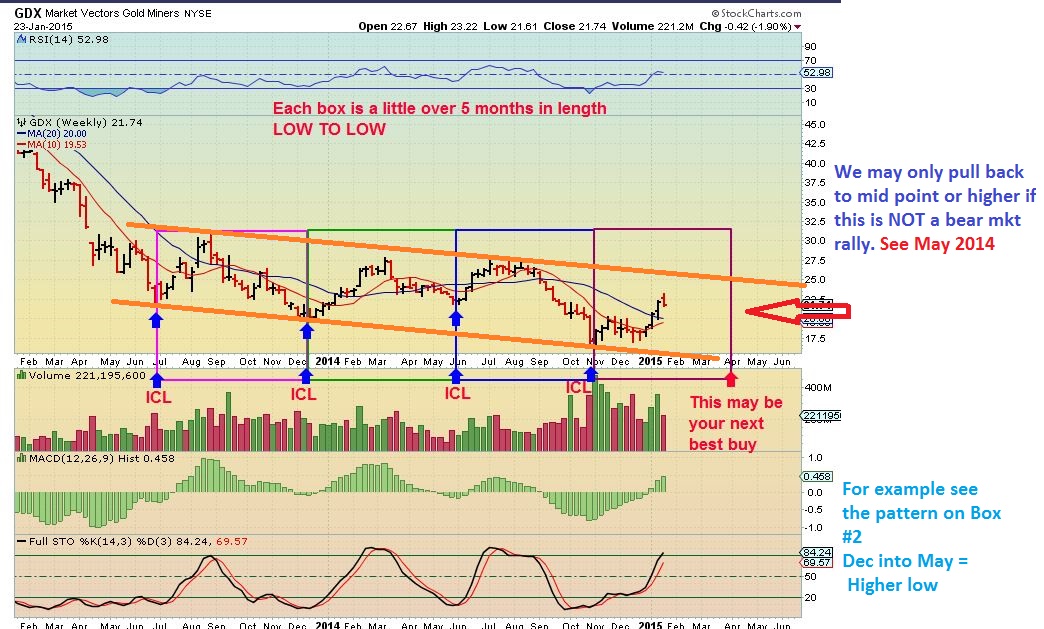
Here is the update as of this weekend. It has sold off deeper than I expected already. I’m showing the bounce and drop of another daily cycle here. I dont believe this is an ICL due to ‘time’ and the stochastis on a weekly basis. The C.O.T. is interesting, but not quite there yet in my opinion.
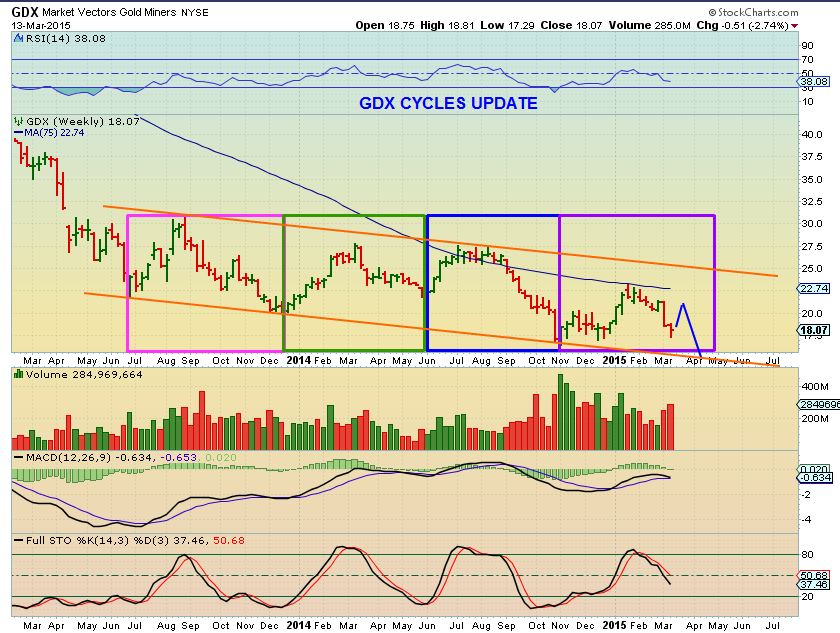
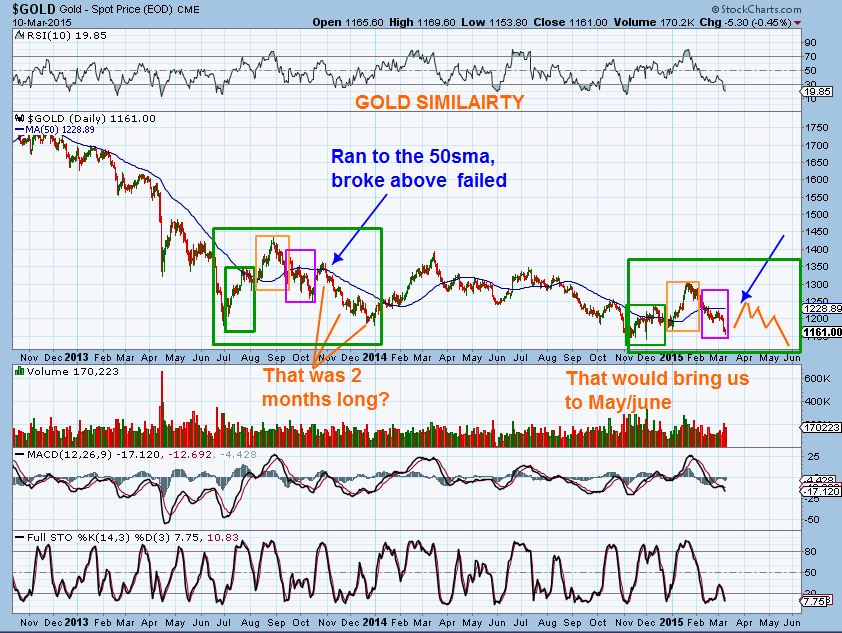
Here is GDX now compared to another 6 month time period. As similar as the Silver one.
1. Magenta arrow low and 2nd daily cycle
2. TOP
3. Drop for 7-8 weeks orange arrows
4. 2 week bounce now to blue arrows?
5. Final drop
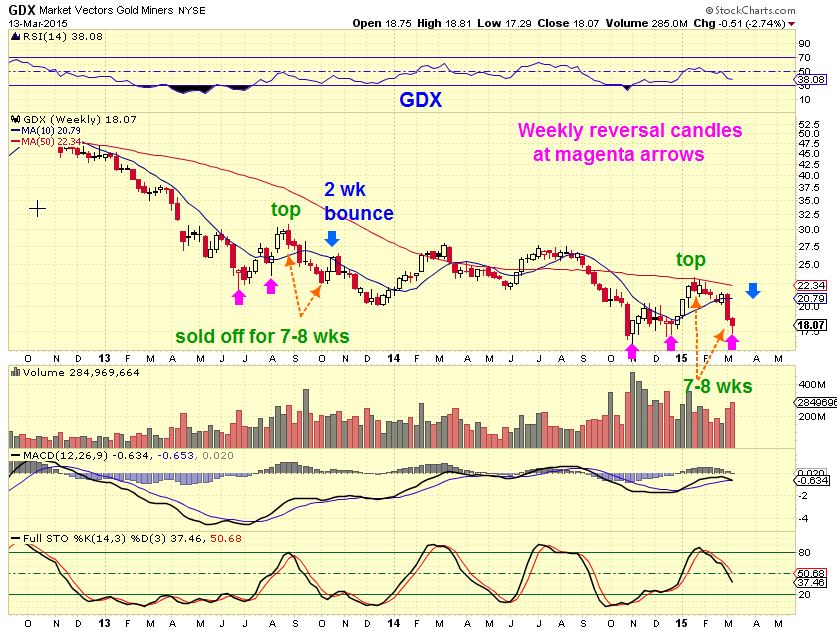
SO the above charts show you why I think we still have the best lows ahead as an opportunity to get in at the lows of a nice run higher. Some have asked me is there any chance that this is the ICL ( meaningful lows). I’m not seeing it in the many different ways that I look at the markets.
In October before the final drop, GOLD just formed a triangle . If I see that here in a week or two, I will short it.
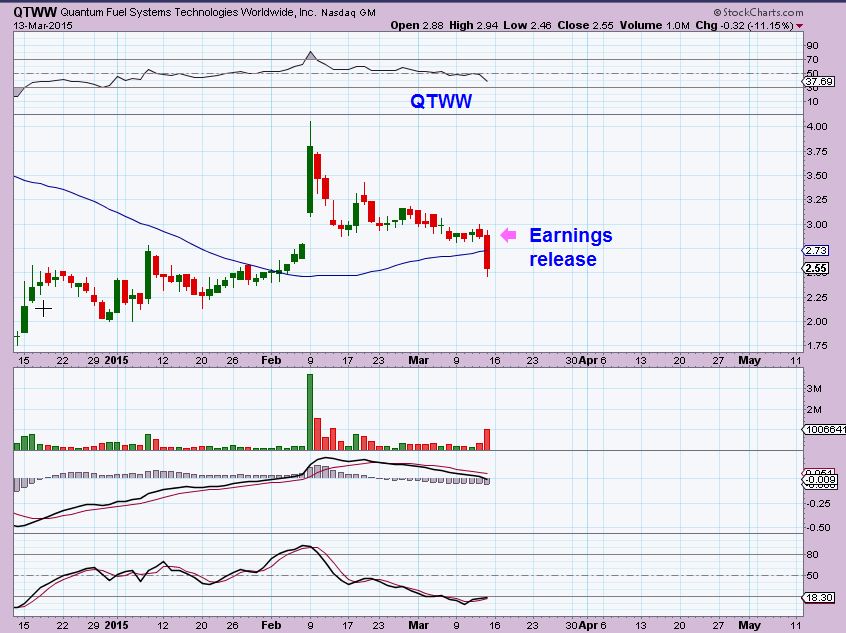
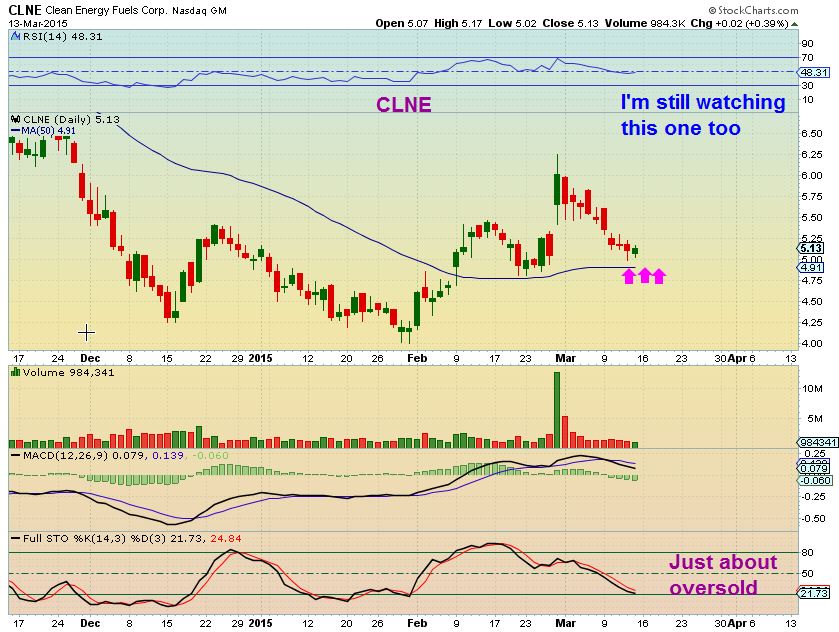
I have been looking at some Bio-fuel / Clean energy stocks. I’ve mentioned CLNE, SZYM, PEIX, and QTWW is another, but hadnt released earnings yet.
I posted this for QTWW before earnings as a possible buy…
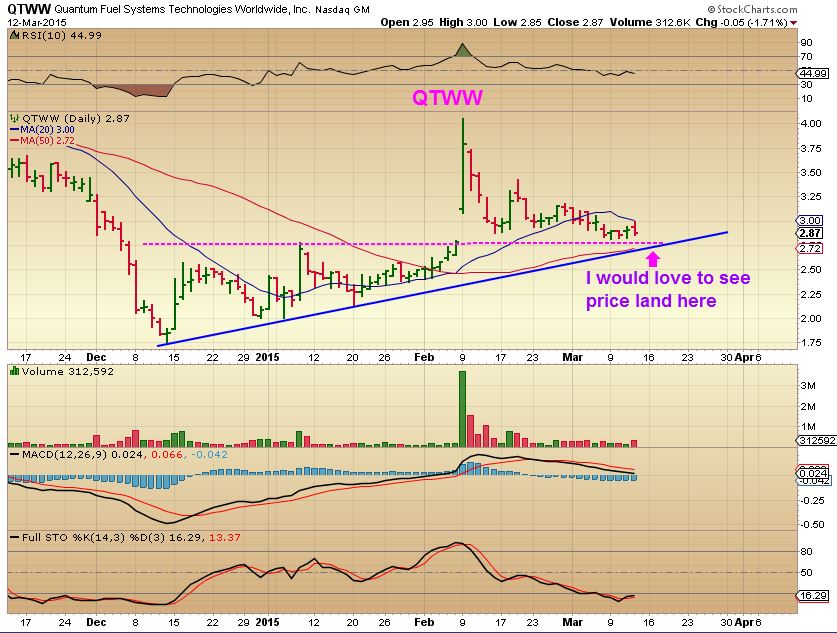
After earnings : ( So this will need some work.
I still like SZYM ( I own it) , CLNE, and PEIX
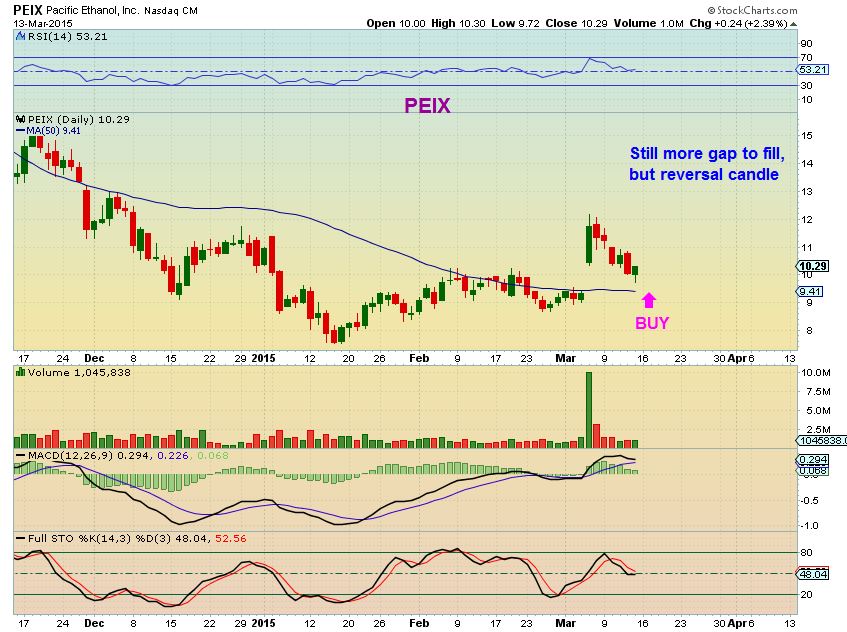
I’ve mentioned PEIX in these 2 charts (It has released earnings now)
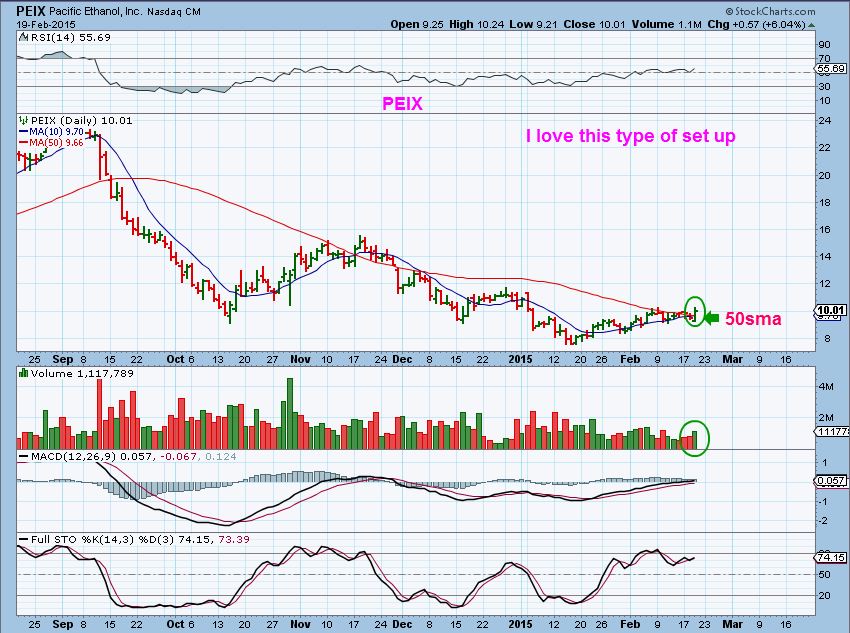
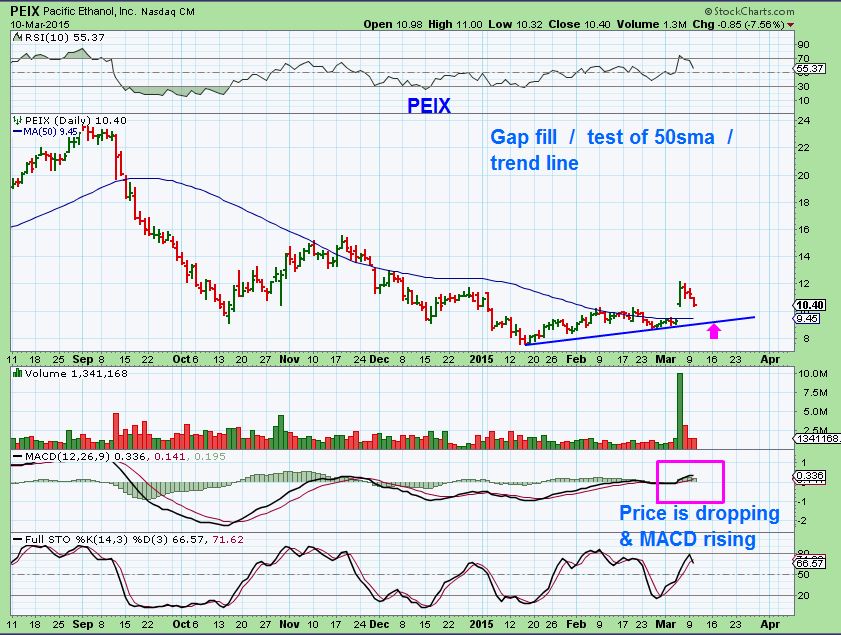
FRIDAY- That may have been the buy, but I’m still watching for a tag of the 50sma.
CLNE is nearing a low risk buy point, but I am watching it for now. I want to buy these close to the 50sma so that I can use right below that as a stop.
This week should tell us a lot.
-I expect the equity markets of SPX, DJIA, and the NASDAQ to bounce soon.
-I expect Metals and Miners to bounce (They have sold off as I write this Sunday night). Recent lows were $1146.50. If we dont sell off below there tonight, those may be the daily cycle lows and a bounce is in place.
– OIL sold off hard tonight as I write. It sold off hard friday too, but I dont get emotional when that happens, I look to the charts. Will it put in a daily cycle low soon or drop to the $30’s ? Many started shorting OIL Friday and I’m sure many more are going short. I’m keeping an eye on prior lows, which are $43.58 . I still look at the 2008 lows and wont go short, because it took out those lows and that was it…higher from there. It is very similar to now . Here is that chart again.
It will be interesting to see how this week unfolds.
~ALEX
BOUNCE 
 Smooth Sailing?
Scroll to top

Thanks for your hard work Slex!
Alex
Thank You too , Shermo
ALEX….. are you still OK, it’s sooooo quiet !!!
See you soon.
I am fine, thx Geurt. I was away from my desk this morning.
Alex, its always tough staying in cash. If I read you right, there are a few opportunities in clean energy, maybe we get a short jump in miners, stocks may also bounce. But right now, nothing really good to jump into.
Thats a pretty good read for how I felt looking things over this weekend. A few opportunities here & there, but I couldnt find a safe looking sector.
Now Energy looks to possibly be setting up. Its a little early to know 100%
I’m kind of surprised you aren’t going long energy here. It looks like WTI had a double bottom (as you pointed out). Hmmm?
Hmmm, psychic? : ) I just felt that It just needed watching before I could encourage anyone to try it .
Doctor Alex…… wooww you analyse this report excellent, I’ve never seen this with all my other subscriptions.
One short question I have, you wrote: “Instead, I will look to go long at the next low”. Please… would you let us know when you go long with oil? Also when you short GDX as it (probably) formed a triangle, let us know Alex.
Again…. may Thanks.
yes
Energy stocks getting hit hard. BAS seems to be the worst hit (refresh for chart). Lets see if that makes a turn at the double bottom. Could be a tell for the rest.
BAS is bouncing, big volume spike
Good Morning,
I am giving CLNE a shot here near the 50 dma on a buy.
I reduced my exposure on RIG last Friday will add back when appropiate…..maybe on a daily buy signal ?
I picked up some as well with a pretty close stop under the 50DMA.
Placing stop on CLNE just below todays low.
Thanks Alex….but All You !!! 🙂
You’re the one that has to push the button. Best Wishes !
NIce again…Hoping it works out for you guys here!
Ken, nice grab. I actually missed that tag of the 50sma , I was at the dentist : ( Good looking reversal.
it looks like pm and energy down and gm up, to go before the FOMC meeting. reversal then?
Yeah, The FED…you had to remind me : )
Ugly day for SZYM. Hopefully it’s just a quick bit of profit sharing.
SZYM actually ran up 50% in 5 days ( $2.40 to $3.50). I am thinking that Its just pulling back to the break out area , 10 or 50sma…but the volume selling is light so far, so I am ok with it.
oil got killed little beyond expectations.. What are we looking at next? Alex. TIA.
Actually , it didnt get killed beyond expectation. My new alert covers what we mentioned. A break to new lows and possible reversal.
Alex….. The Fed is ready to be giddy this week, and drop the term “patient” when referring
to rate hikes.
Question: What does this means for the SM, GOLD or PM-stocks?
Thank-you.
??? may be expected already.
Yeah, maybe oil found a bit of a bottom today? Of course dollar was down for one day which may have helped? Any move down tomorrow and I’ll likely close shorts and take the cash, not press it. I bought CLNE, was excited to see 50 day bounce just like you said and looked like some others were jumping on this.
Maybe you guys all pushed it up : )
I am moving from here to the new post now., Thanks for holding down the fort today
CF, I saw QQQ reversal on Fri but didnt jump going into a wkend and b/c it hadn’t gotten to our targets. I wasn’t avail this AM to jump in. Still looking good for an entry here or too high to chase already? Maybe on a gap down for better entry or hold until after Fed? Thanks for all of the info today!