I want to focus specifically on the subject that was my midday alert Monday, but first a quick market overview.
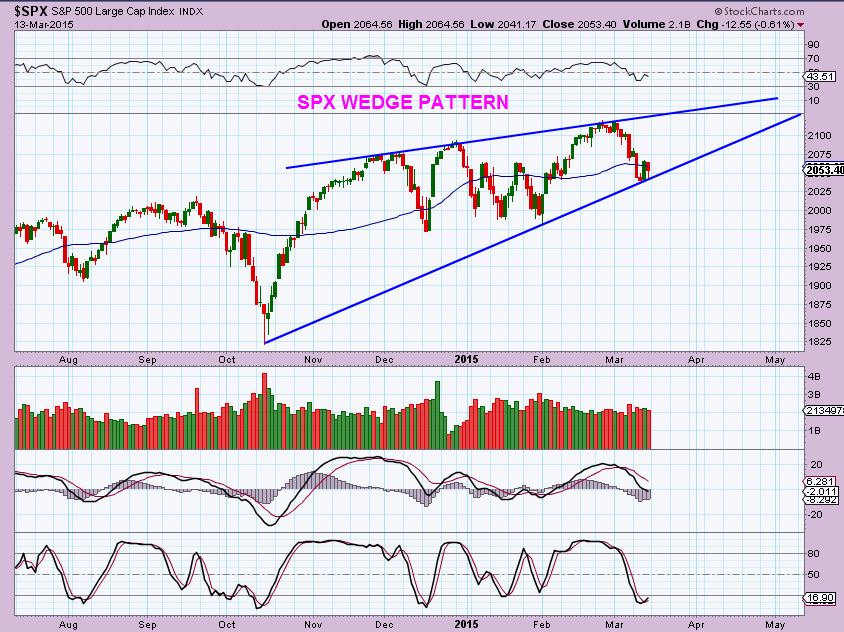
SPX – We looked ready to move higher, and we did, but within a possible wedge pattern.
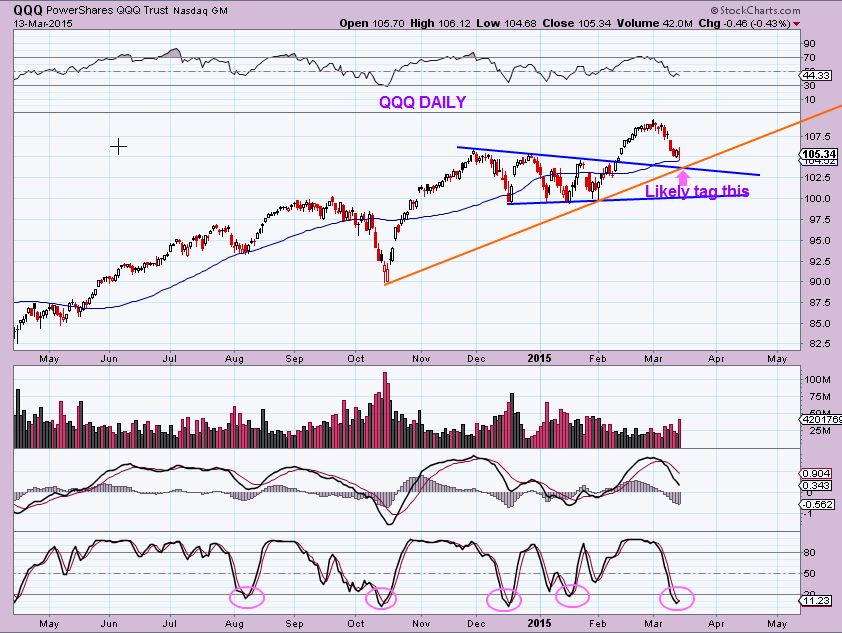
I took a look at the QQQ’s and pointed out this…
Why were we at the 45 degree trend-line on SPX, but still a possible further drop on QQQ? I posted this , and the 50sma was holding price.
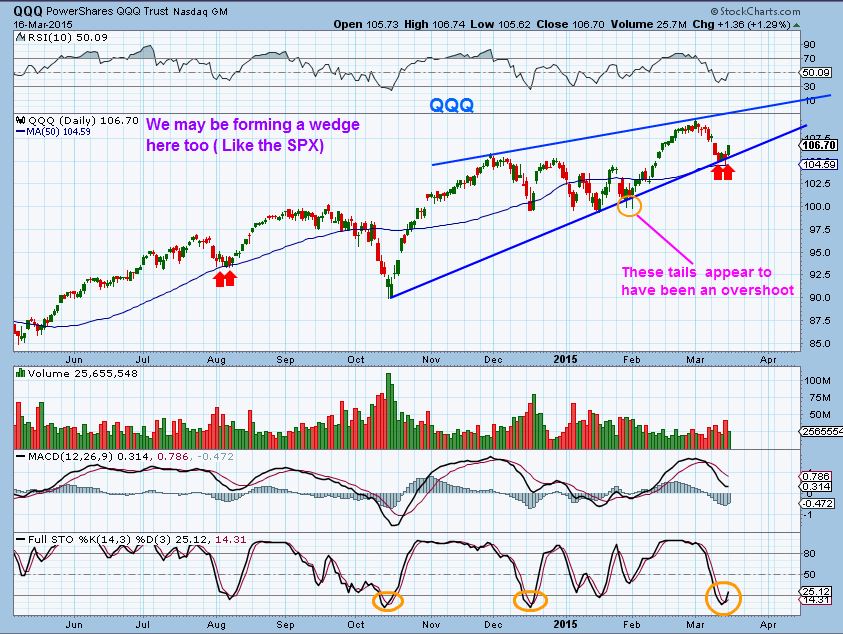
I took another look today and I’m thinking that the January “tails” may have been an over shoot. Why? It was also a BUY at the 50sma in AUG ( red Arrows) . If you are trading UPRO or TQQQ as some have written that they are, please keep in mind the wedge pattern forming in both is a ‘Bearish wedge pattern’ . They often break down after nearing the apex, so use the trend line as a stop.
$NATGAS is the same as yesterdays report. No change, sideways move at the lows.
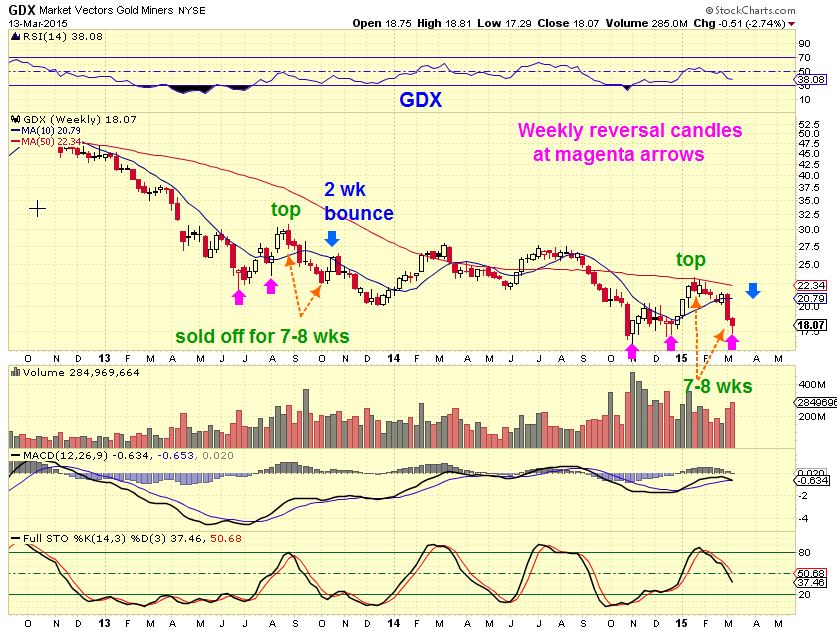
GOLD / SILVER / MINERS havent changed either. I am expecting a bounce , but a roll over into a real trade-able & meaningful low. I’ll just re-post a GDX chart so you dont have to go back to the weekend report. I must say that the GOLD & GDX CYCLE COUNT is unclear to me. 3rd daily cycle? 4th Daily Cycle? As things play out it should get clearer.
GDX WKLY – 2 wk bounce & drop?
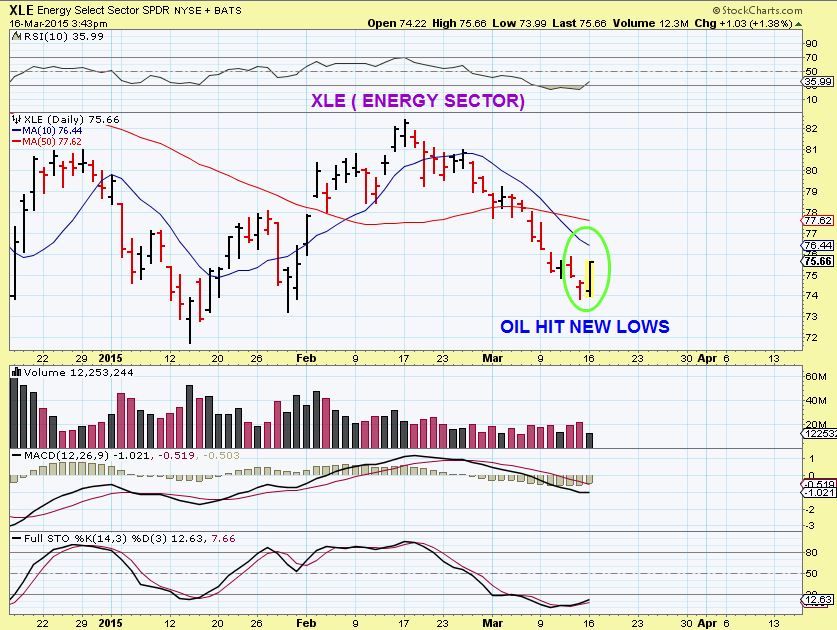
LETS LOOK AT OIL – ( we just hit new lows as I write)
In yesterdays midday update, I wanted to point out to you an interesting occurrence in the Energy Sector. I want to have to watch how this plays out, it may be a nice opportunity.
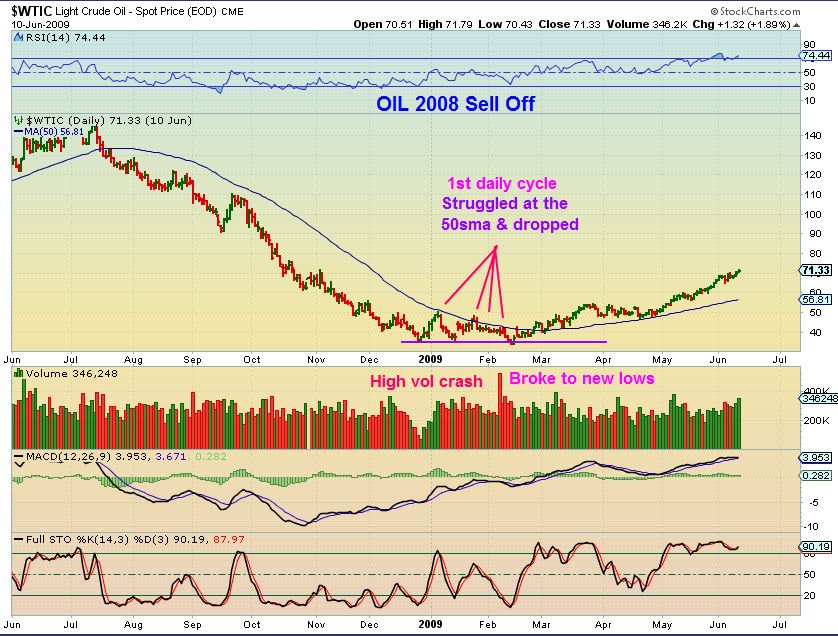
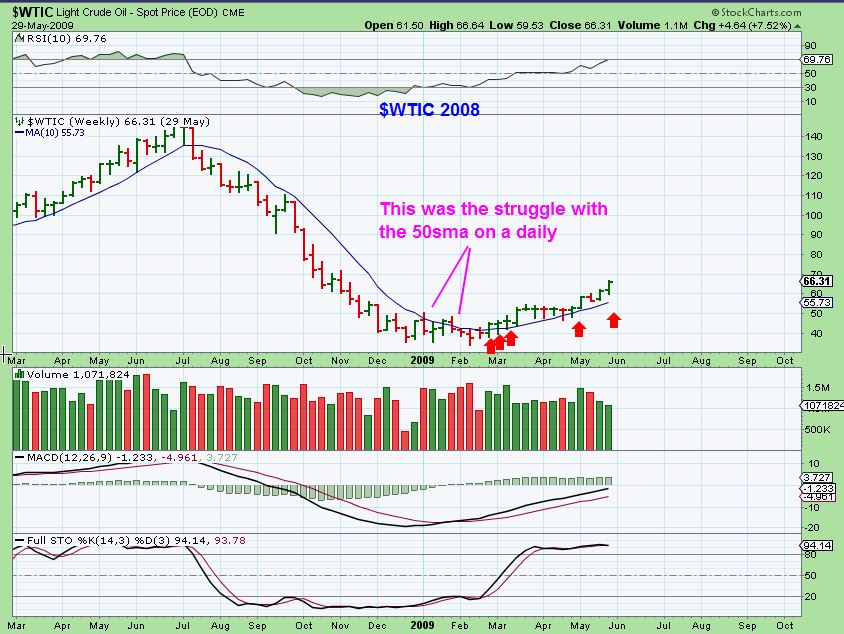
REMINDER: I thought – Could OIL bottom like 2008? SO MANY are calling for $30’s and a big break down & drop that I hate to follow the crowd, though it could happen. I read reports warning ” OIL is weak, avoid it or go short “. Some also saying it is forming a bear flag. I decided that I needed to look at the 2008 lows in OIL.
To me? OIL today and OIL 2008-2009 look very similar , so lets watch how it plays out. I posted this for you …
OIL 2008, Fight the 50sma, Break to new lows and recover. Many call this 2009 action “Weak”, I call it ‘bottoming’.
SO I was away Monday morning, but I came home to zoom in on OIL and ENERGY STOCKS.
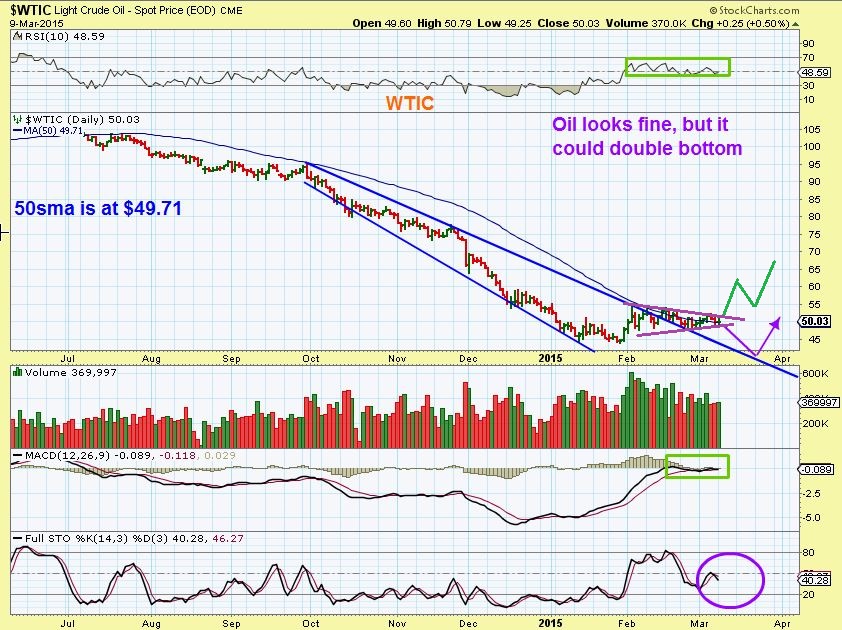
MARCH 9 – I was ok with OIL making new lows. A break to new lows and recover is possible, since a daily cycle low is almost due
LETS ZOOM IN AND SEE IF THERE IS A REASON FOR HOPE
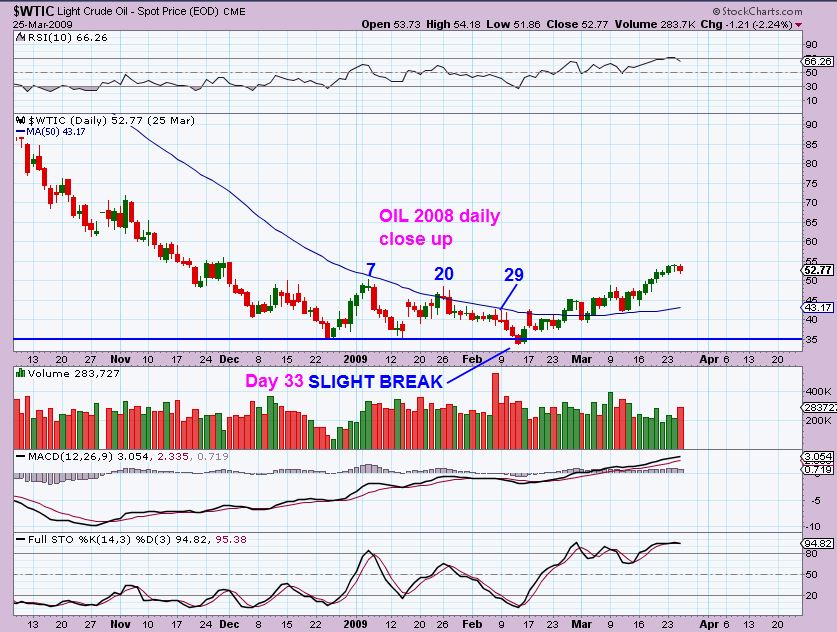
LOOK AT THE OIL 2008 CYCLE COUNT There was a Day 33 new low
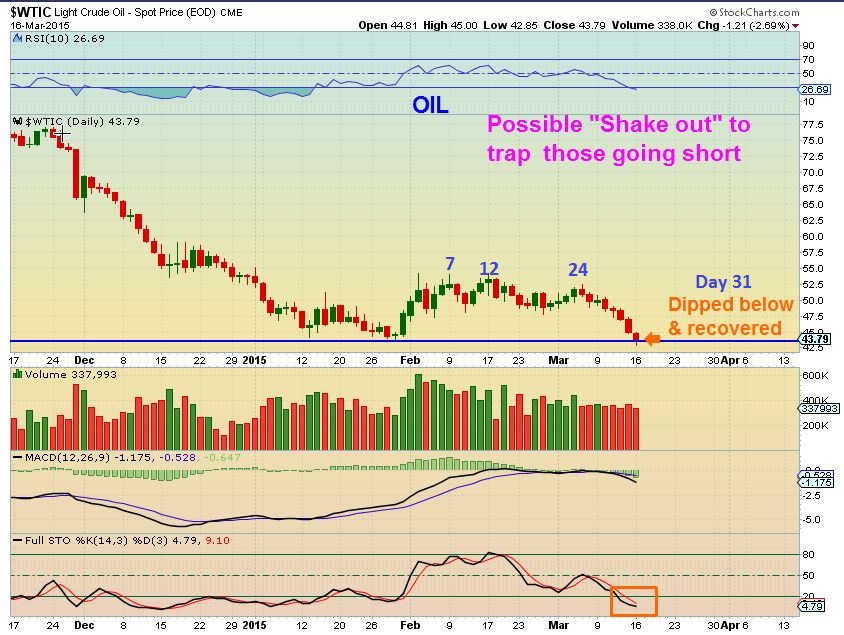
OIL NOW – break to new lows & reversed higher – Day 31 new low (so far at $42.85). It could go lower from here so deserves monitoring. I’d like to see a reversal by Friday for a weekly reversal. * We just broke to fresh new lows as I write
What can we look for bigger picture going forward?
The WEEKLY CHART is always healthier above the 10WMA, so if OIl is bottoming, in a few weeks I want to see it gain the 10 weekly Moving Average like in 2009 .
As I mentioned in the UPDATE, often you will see GOLD down $10 -$20 and the miners go green. It often indicates that a reversal is close. If you look at OIL charts vs XLE or other energy stocks , you see that Energy stocks bottomed well before the OIL sell off ended in January . SO Monday I also noticed reversals in ENERGY stocks while OIL was near new lows. It may be a noteworthy clue. Can these reversals hold if OIL goes lower?
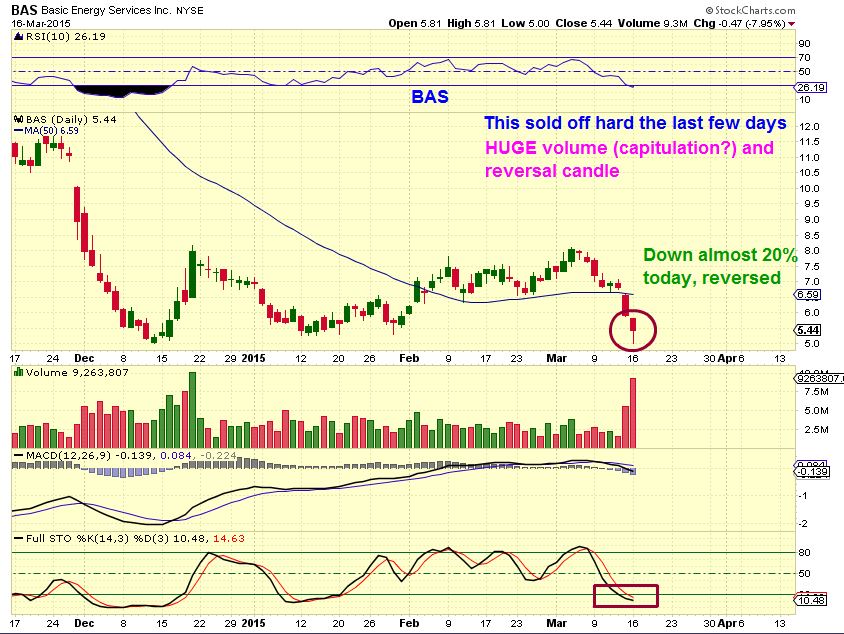
I say a noteworthy clue, because stocks like REXX, EXXI, BAS, DNR, etc, etc, all lost their 50sma, so recovering the 50sma would be encouraging. Some may wish to wait for this to happen before jumping in, it is a safer trade. I may be early with these energy stocks.
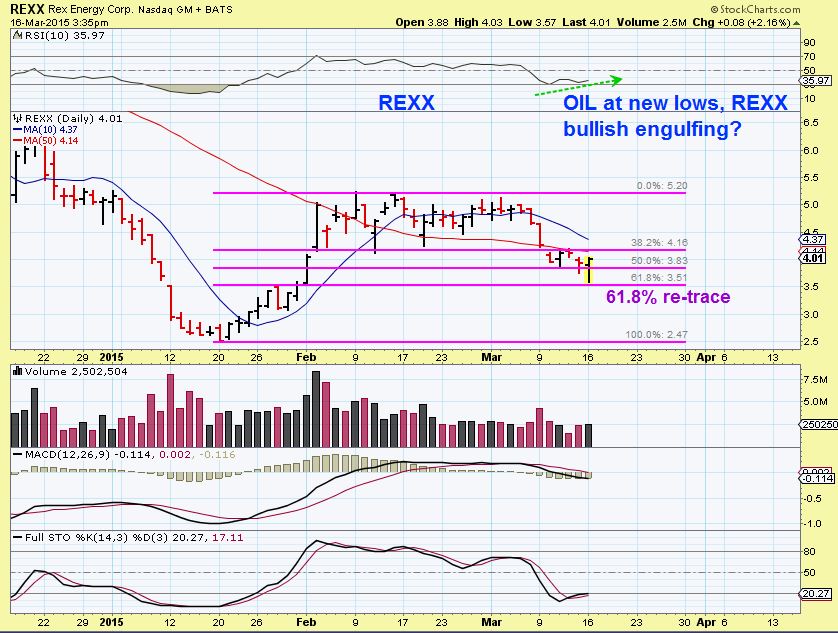
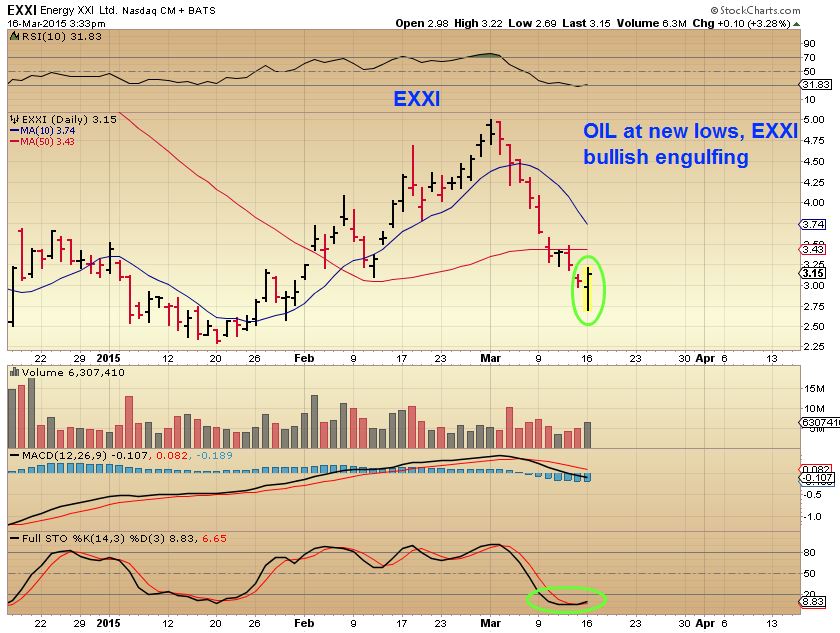
Encouraging is the fact that it is 1 thing if you only see 1 or 2 reversals, but Monday many energy stocks started to go from RED to GREEN. I pointed out REXX, EXXI, and look at BAS- down 20% intraday & a reversal started there also. Possible capitulation volume.
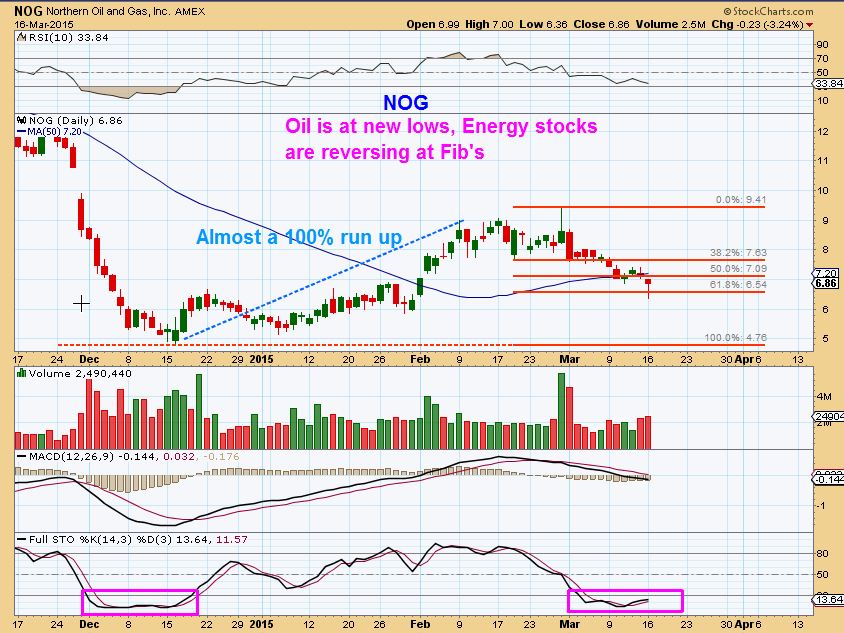
OIL is at new lows, and some of these stocks ran up 100% and are only pulling back partially. Now a possible reversal.
EXXI
NOG
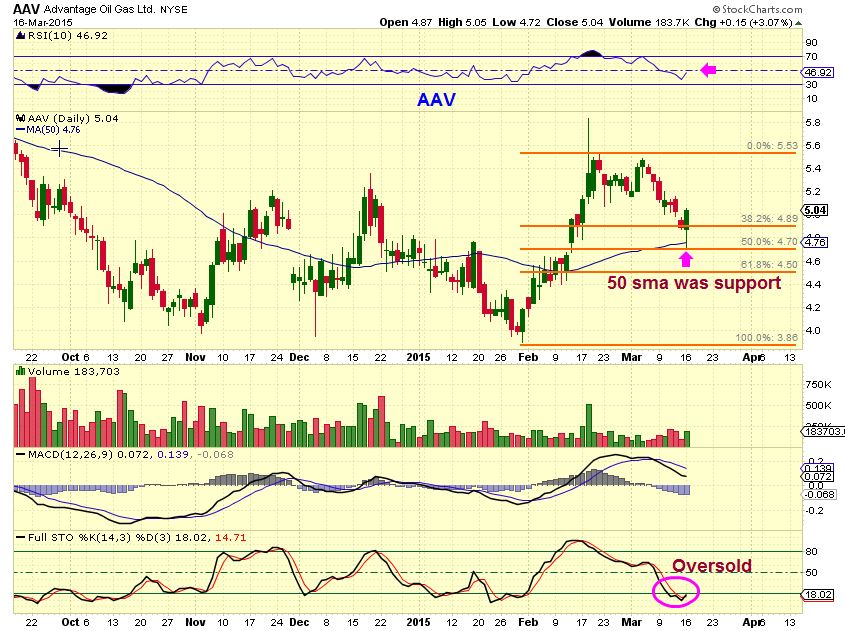
AAV – held up well
SO I am watching the ENERGY SECTOR again. Some of these stocks were so sold off at the end of 2014 that they made 100% gains out of the lows. The second run usually offers 1/2 of that %-Wise, but 50% is great. I would try to buy only stocks that have earnings out ( REXX, EXXI, etc)
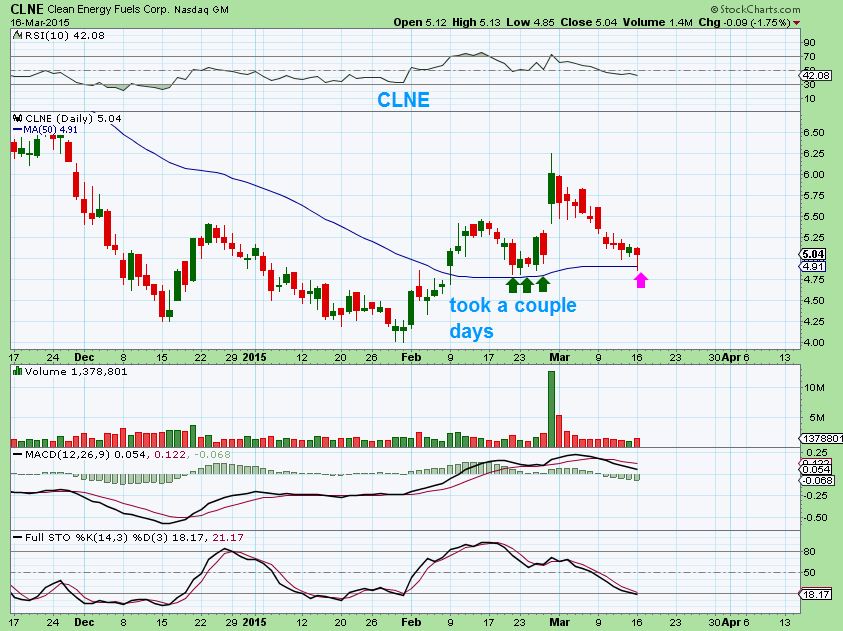
I pointed out this set up in CLNE
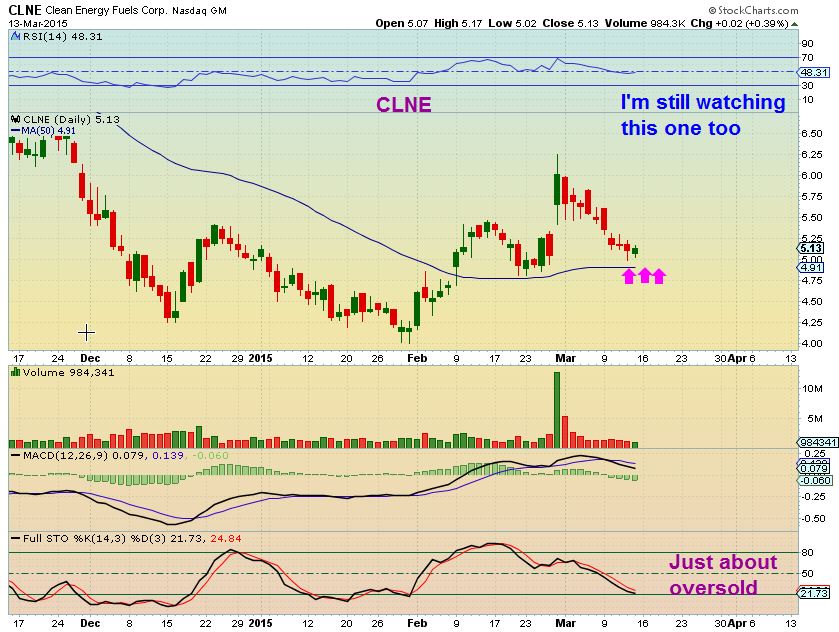
Some bought this reversal at the 50sma today , congrats! Honor your stops if this doesn’t continue to act correctly.
I also just wanted to throw out a couple of interesting bullish set ups. Low risk because your stop can be right below.
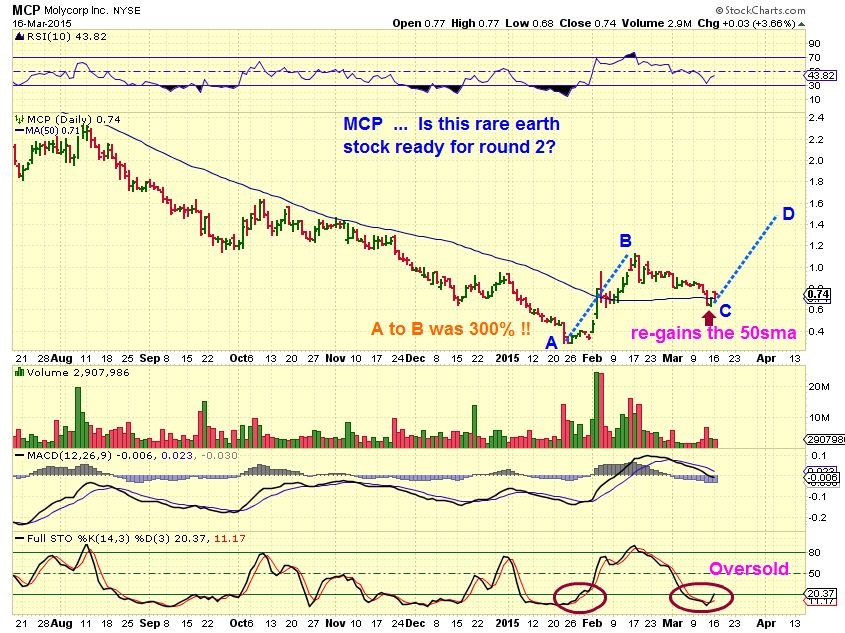
MCP – Thx for the reminder Maria
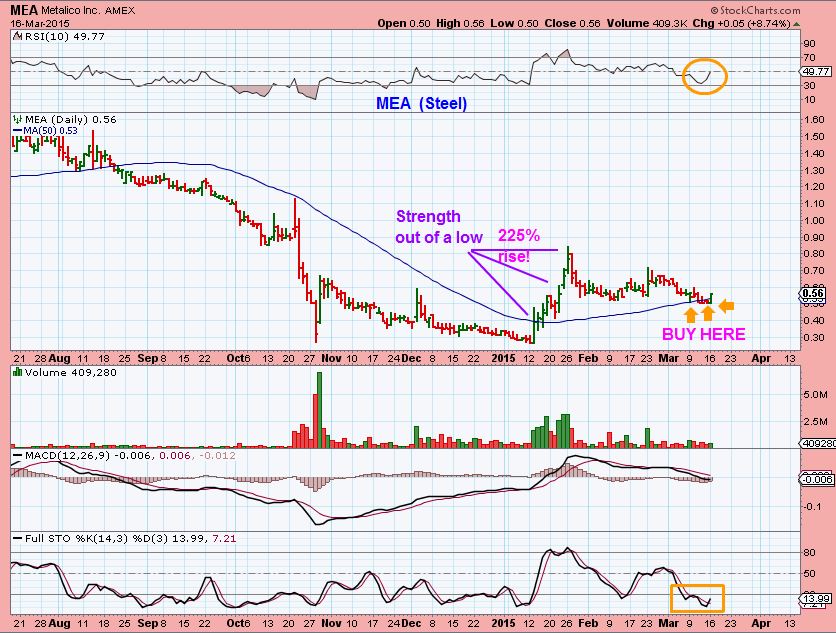
MEA – A steel stock
So this is the area that I am pretty much focused on. Will the recent OIL lows hold or will they be broken? ( * see footnote) Either way, I want to see what happens to the Energy Stocks and the XLE. Yesterday they reversed while OIL was still down and when an entire Sector shows signs of reversal and signs of life? It can be setting up to make a run higher. In the first leg up, some of these ran 100% . I am hoping that some low risk entries here, either a move above the 50 sma, or just buying the reversals with stops near the lows, can pay off if we get another leg higher. Nothing is a guarantee, but again, so many reversals while OIL is making new lows? I love the contrary view in that situation. Best wishes !
~ALEX
* Oil lows were broken as I wrote this
P.S. – I may post a public post in the afternoon regarding some of these set ups . I may show a chart or two ( REXX , EXXI for example) to show the reversals that took place Monday as OIL was at lows. I wanted to post here in yesterdays midday update & today before doing so , so you can take a position first if you wish to . If you feel that this reversal may be the daily cycle lows, but if the reversals do not hold, I wont post a public report until we have another opportunity to re-position.
Smooth Sailing? 
 Waiting On The Fed Again
Scroll to top

Thanks Alex, WTI still going lower as I write. I may buy some EXXI later depending.
Yeah, I’m keeping an eye on things , just want to see how this plays out.
Break outs on Brent and WTI? Higher high on WTI! See chart below, 1 hour frame
Did I send you this a couple of days ago? H&S on OIL? 1st on e from the 13th, and now. Perfect timing……..See chart
Yes, you posted it here.
BAS, EXXI, and GDP all seem to be performing well. I bought some EXXI this morning. Others like NADL, SFY , WTI seem to be reaching a previous low, but no sign of life? I mentioned BAS Yesterday, it reached a previous low and soon after started taking off. Perhaps the others are just getting ready?
Yeah, I was a little disappointed in WRES, after such a big leap on earnings, it gave it all up & then some.
We have to be careful. WRES hit that previous low, went sideways and droped lower. This could be a bad pattern for the rest?
I guess if you see some back at prior lows it could.
Thanks Alex. I understand that today is oil expiration day. The last two expirations had large rallies near the last hour or so of trading. FWIW. good day trading to you-
Oh, Didnt realize that, thanks. Lets hope that some things never change : )
Hi Alex
Surprised by this paragraph;
SO I am watching the ENERGY SECTOR again. Some of these
stocks were so sold off at the end of 2014 that they made 100% gains out
of the lows. The second run usually offers 1/2 of that %-Wise, but 50%
is great. I would try to buy only stocks that have earnings out (
REXX, EXXI, etc)
Not ABC eg EXXI 2.5 >> 5 >> 2.7 >> higher than 4?
They can run well, but not usually another 100%, especially if they’ve dropped more than 61% in the pullback.
Yes, they can run more than 50% , but I dont like to say I expect 75- 85% and then when it doesnt happen, I get asked why, what went wrong?
Also – Even in an A-B C-D where the A-B equals C-D, the A-B =100% of the price , C-D wouldnt be . It would be the same move Dollar-Wise, not %-Wise.
EX: $2.50 plus $2.50 is $5.00 its 100%. Then pullback to $4 and add another $2.50…its not 100% move anymore, but has the same $2.50 length as the A-B.
Hope thats understandable?
It is indeed, many thanks.
Had the idea 200D MA was on the cards.
Yes, eventually they can get there, if OIL recovers a little more. I think individual stocks will recover at different rates too, but they can get there.
When I say that some should reach it faster than others, I look at ( for example) EXXI at $3 now. Its 200sma is near $10, whereas AXAS never lost the 50sma and the 200 is not too far away.
Did you see -after you wrote- what OIL is doing !!!
Yes, And GOLD is a bit crazy…new lows and then a rocket ride higher
Good report Alex. Any thoughts on SZYM and YGE? Looks like SFY might be trying to bottom.
The solars all look pretty good,
You must have missed what I said on SZYM yesterday when you asked, I will copy paste my answer here…
SZYM actually ran up 50% in 5 days ( $2.40 to $3.50). I am thinking
that Its just pulling back to the break out area , 10 or 50sma…but the
volume selling is light so far, so I am ok with it.
Last weeks started buying UPRO with first conformation (TSI crossover), yesterday market was up, but on low volume, so I passed. Today Buying volume started rising from zero (Market Volume, buying selling indicator) so probably making another purchase today.
I agree with your suggestion of stops.
Thanks
And I agree with your “Buy the dips” and not adding yesterday, though it can be tempting when things look like they are running away. Good discipline.
Harry, great plan, Thanks for sharing with us.
MCP down 33% thus morning on capital structure questions. Lots of these under 1$ companies may be disappearing if their sectors don’t turn around relatively soon.
So true…and I liked the set up on MCP too. I remember when MCP was $30’s and REE was up in the teens.
yup….it ‘did’ look good.. ;o)
Yes, it really did after re-gaining that 50sma and its last run up was strong ( 300%). I HATE when I post a chart of a stock that recovers a support area and then it comes out with news and loses it.
I’m thankful that it happened in Pre-Mkt and gapped down….so no one had a chance to buy it.
REE might be the only play left in the rare earth sector. Unless the entire sector vanishes, which is possible, it might work out well eventually.
Yeah, I have MCP, REE, AVL, and QRM became QRMLF for my Rare Earth list
SOLAR STOCKS look good, they have been acting correctly, but to be honest….I havent played them well at all! I get bored and sell and then they pop & run.
TSL, JKS, CSIQ on the other hand are rising , holding gains and then rising again.
GDP & DQ – rather sweet move with OIL down : ) And AXAS and AAV held above the 50sma before taking off higher.
GDP almost parabolic? Whats up with that stock? EXXI and BAS also good days.
Added ARP and OAS today to energy portfolio.
Finally the chart of NATGAS doesn’t look the same anymore : )
Do you think exxi will continue to rally even as oil continues down?
Alex, timely post as always. I wanted to reduce risk so closed both of my oil shorts (SCO and USO $17 strike weekly puts) at a solid profit instead of pressing (learning discipline!). Now I have some dry powder and profits to put to work, will look at your favorites tomorrow – some were still red today while others (GDP!) took off huge. Nay wait for Fed decision first to reduce risk. Started QQQ bunny position also.