The website went down and my apologies for this report being released a little late, thank you for your patience! I had so much to cover, so I am going to try to write less and allow the charts to speak for themselves, feel free to ask questions in the comments section if you need my help…I will be available on & off today. To the charts…
QQQ – Same ole same ole.
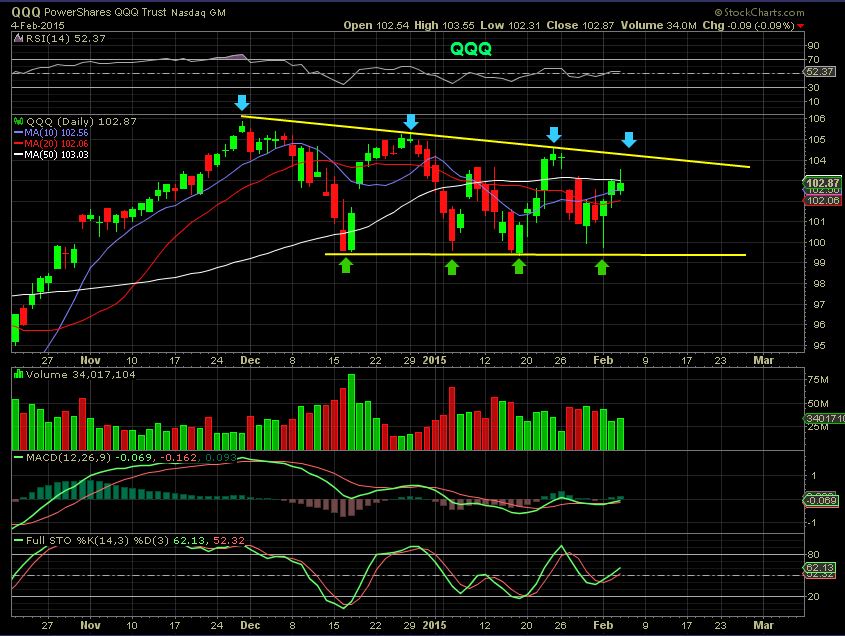
I had been shorting the top ( adding TZA) and closing half at the lows, also watching the 50sma. I closed out this position , but may add if we reverse & drop lower again. It is still unclear which way this will eventually break, here is why…
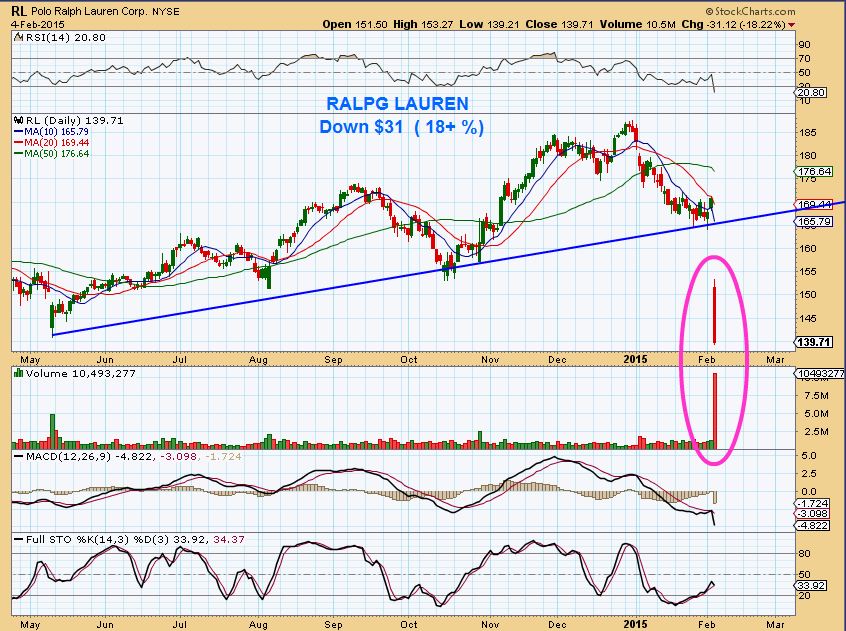
I mentioned that many MOMO & much loved wall street companies were breaking down and looked bearish, and I posted charts of AMZN, MSFT, INTC, BABA, YHOO, etc Then others looked bullish (AAPL, GOOG, etc) . Yesterday CMG & Ralph Lauren did the crash thing. Such a mix, QQQ, SPX, DJIA etc are still in the trading range.
RL for ex:
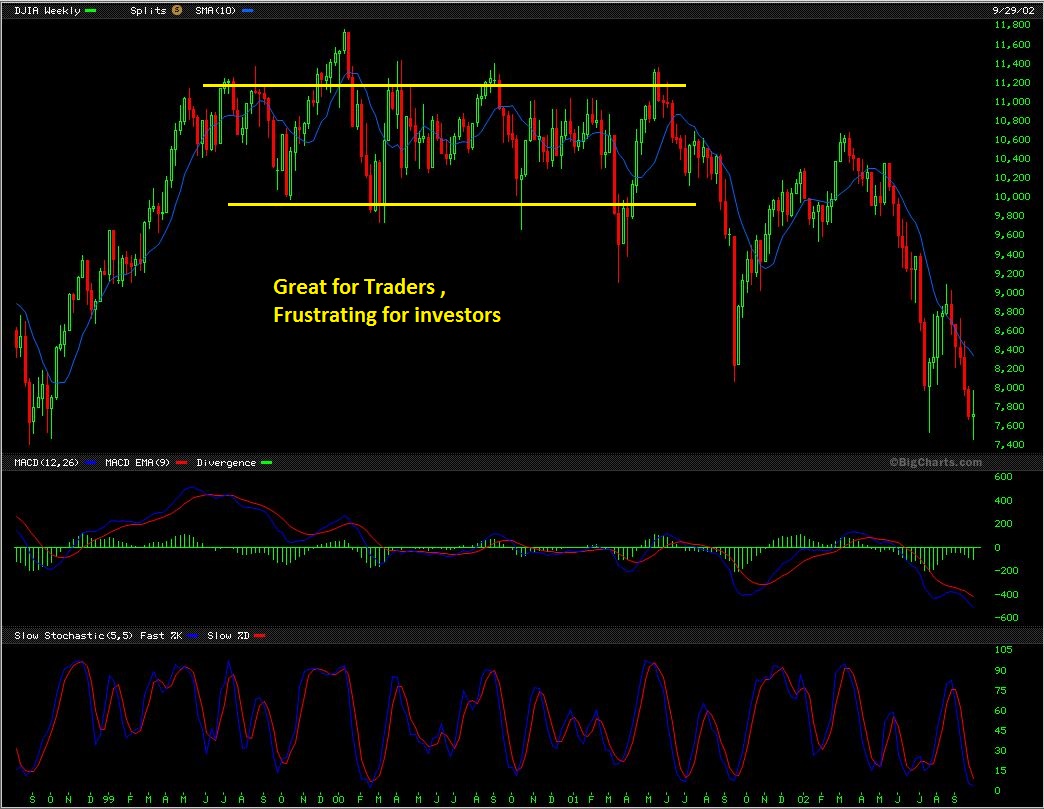
SO you can trade the range, if stocks reverse from highs later today (AGAIN) . You can add TZA, SDS, TECS, etc — or wait for a break out higher , but this chart below is a reminder of how tricky it can be inside these ranges. Look at the DEEP swings and even the over shoots here. Those can be bull or bear traps . It can be great for traders, nightmare for investors as trades spin their wheels in both directions.
I want to focus on ENERGY ( See Mon Jan 26 report and yesterdays report). $WTIC finally did what I was watching for . I pointed this out as something to look for …CLOSE above the 10 & 20sma
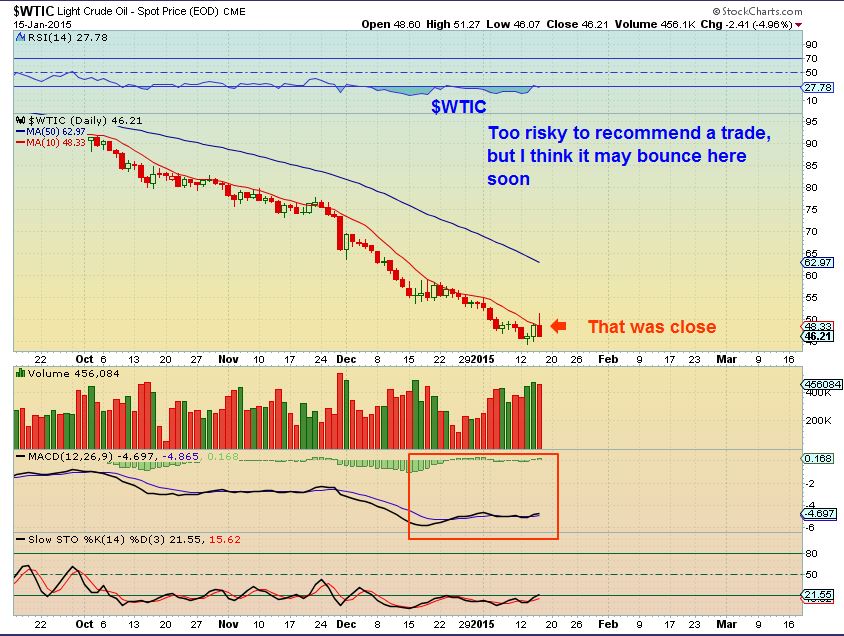
JAN 30 had this ..
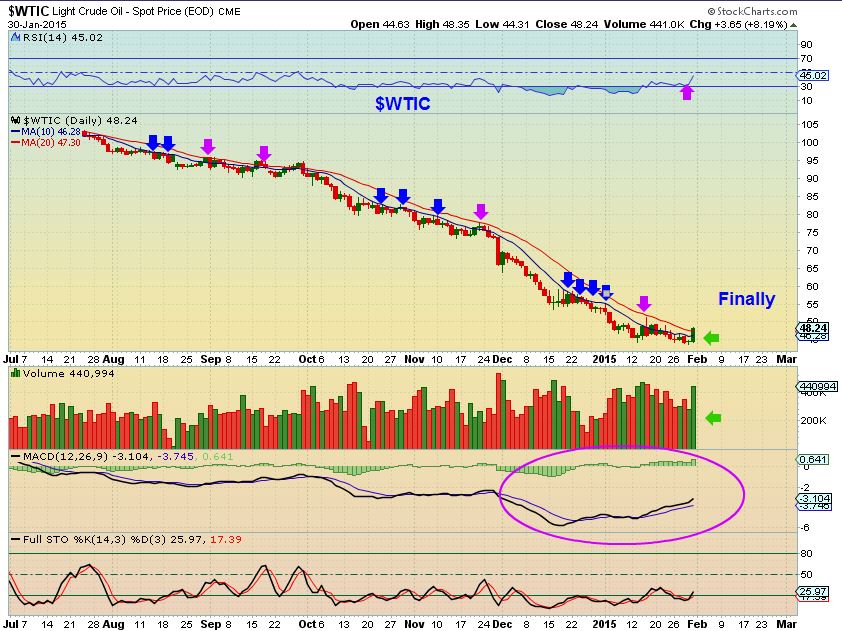
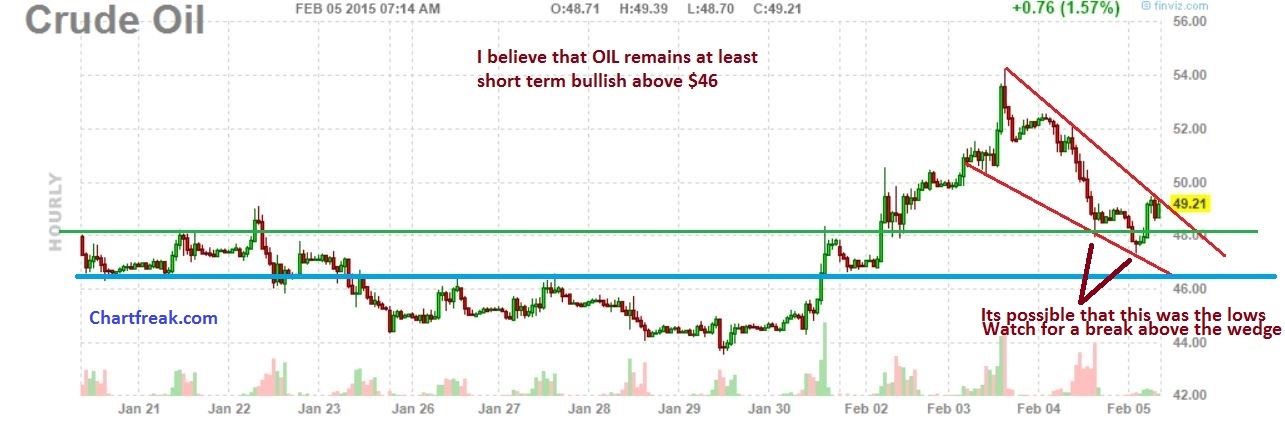
So it ran up quickly to $54, and now pulled back fast yesterday . Back below $50 , Sentiment IMMEDIATELY went bearish, warning of a crash 2nd leg down. ( I see it possibly at support, so I hunt energy stocks )
Here are some ENERGY plays I am looking at. They acted well with yesterdays sell off. I think t MANY double bottomed or have formed bases and can be bought . The set up looks so much like the MINERS in December.
*REMINDER: Just like Miners , some acted stronger than others, like CDE and AU vs AUY , EXK. A small basket can be better than risking all in one stock. These ENERGY stocks have LARGE swings in price. Scary for some. Tight stops will sell you out often, but I think the upside could be great for many over time, like CDE and AU, GFI for ex.
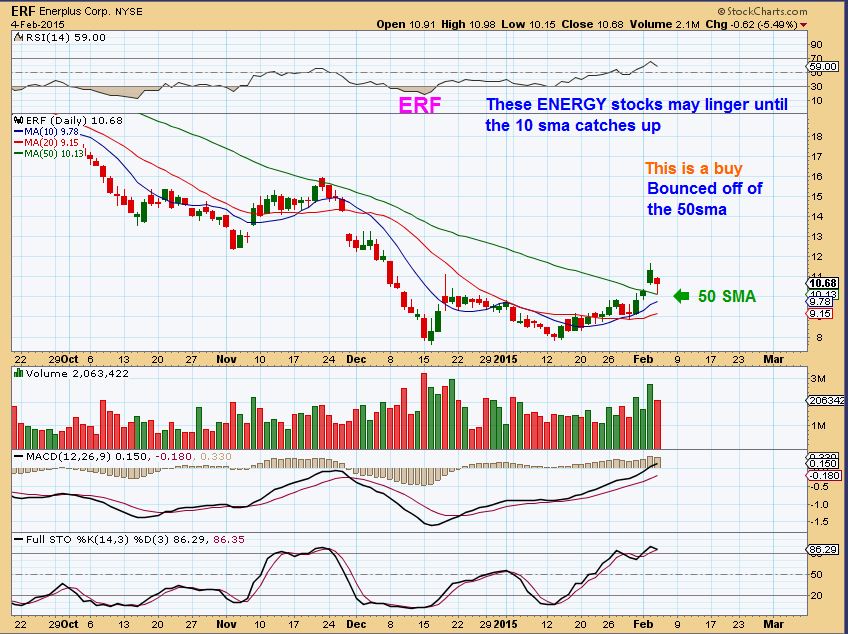
ERF – Nice with the oil sell off and sell off in XLE.
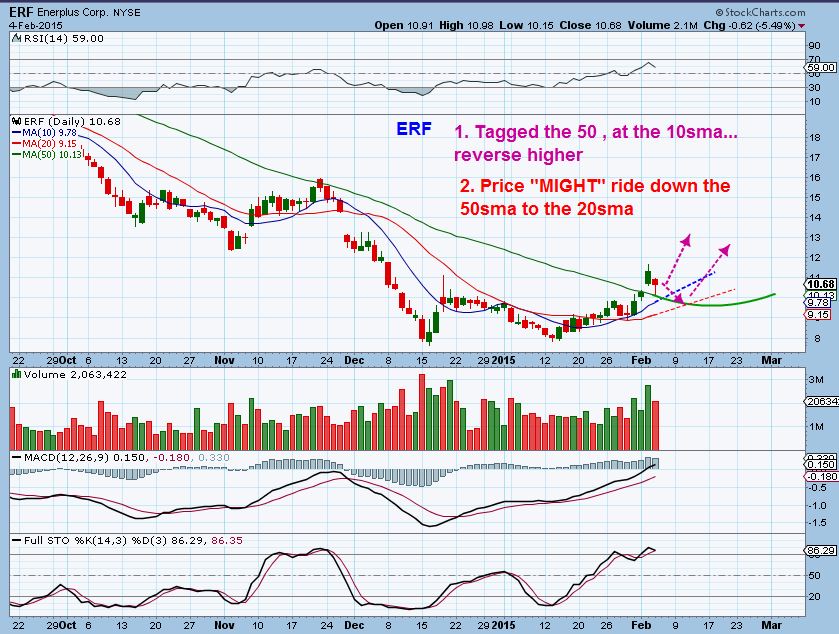
ERF AGAIN – This is a buy , put your stop where you are comfortable. ( I think it could MAYBE also drop to the 20sma, but if that makes you uncomfortable..stop out & re-buy later.)
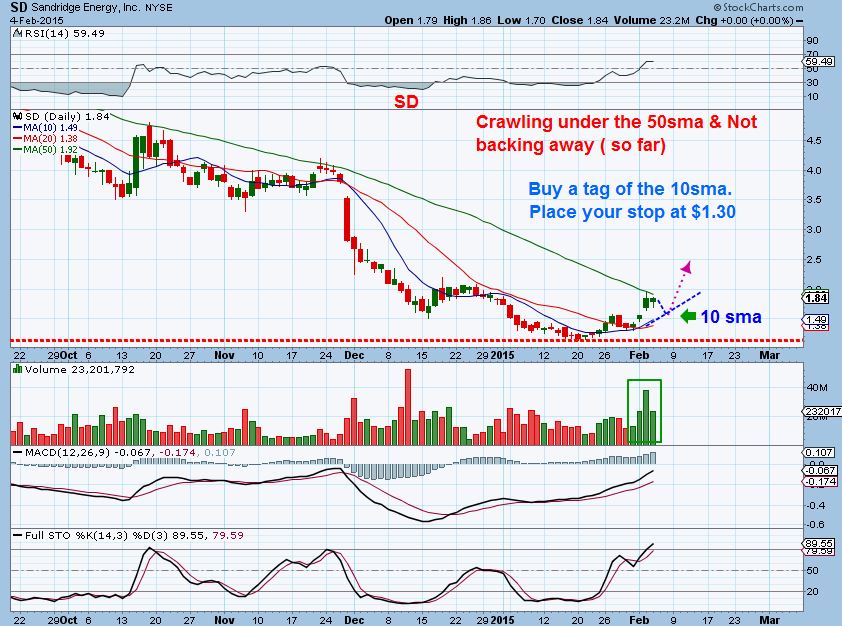
SD- buy here as it crawls the 50sma ( or breaks above) or watch for further drop
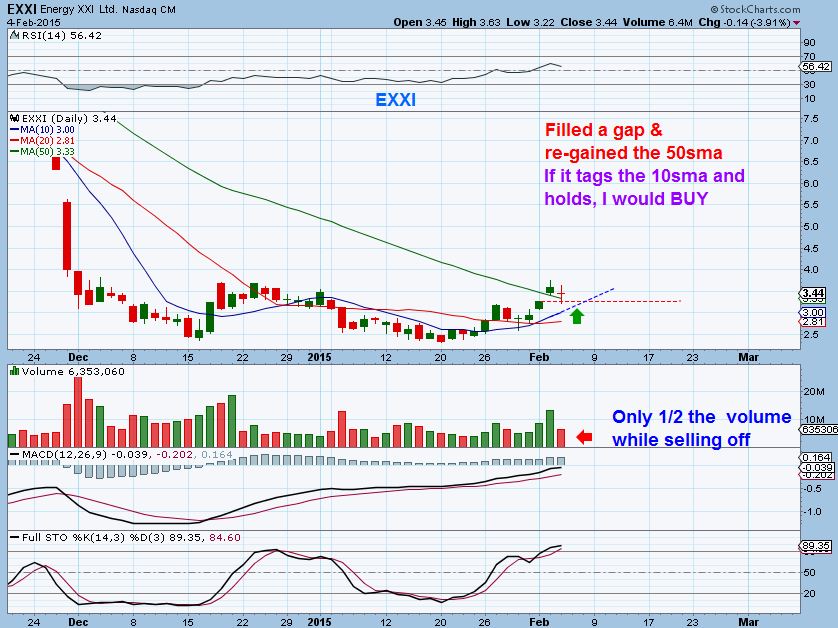
EXXI FEB 4
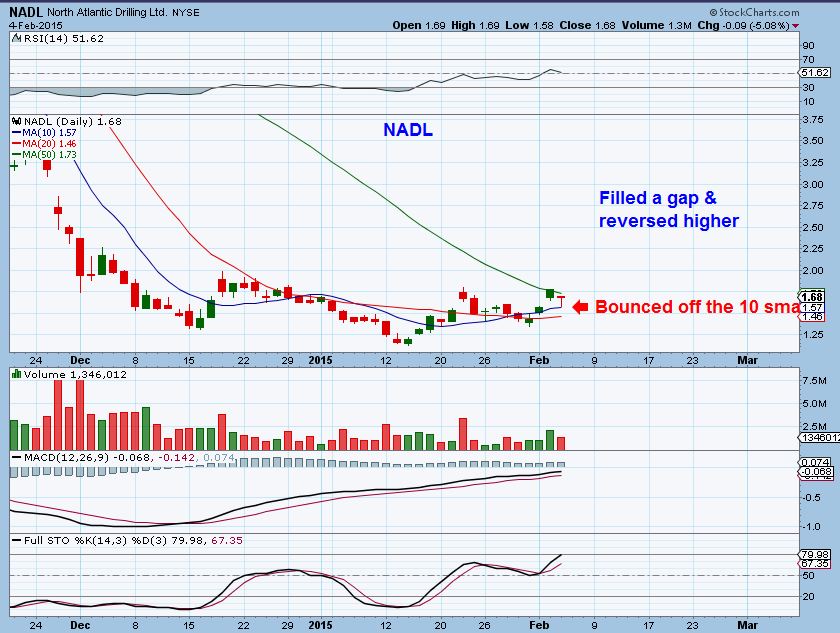
NADL- I like the weekly tight base. It stopped selling off all of DEC & JAN even when OIL was selling down .
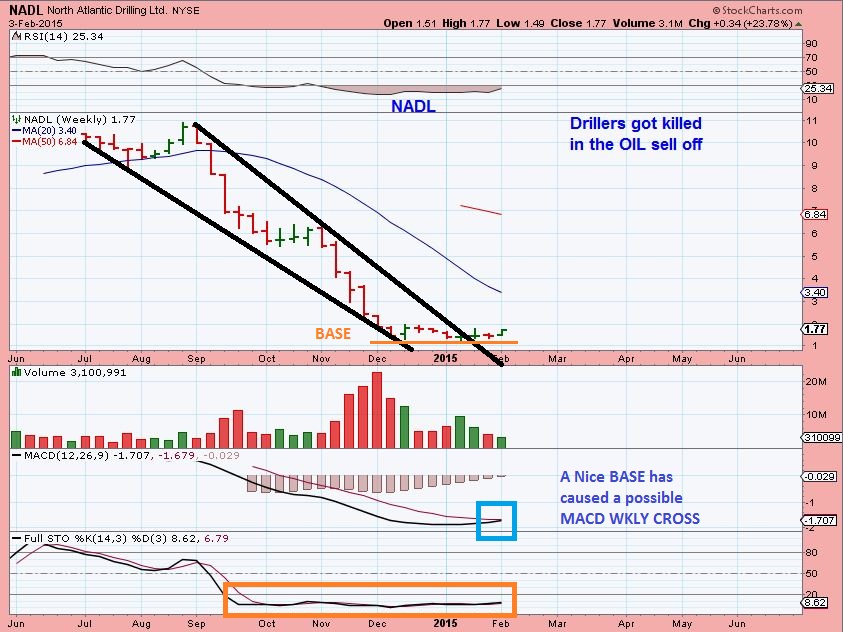
NADL so with that base in mind I bought some yesterday , stop below the lows. You can buy here or wait for a break above the 50sma
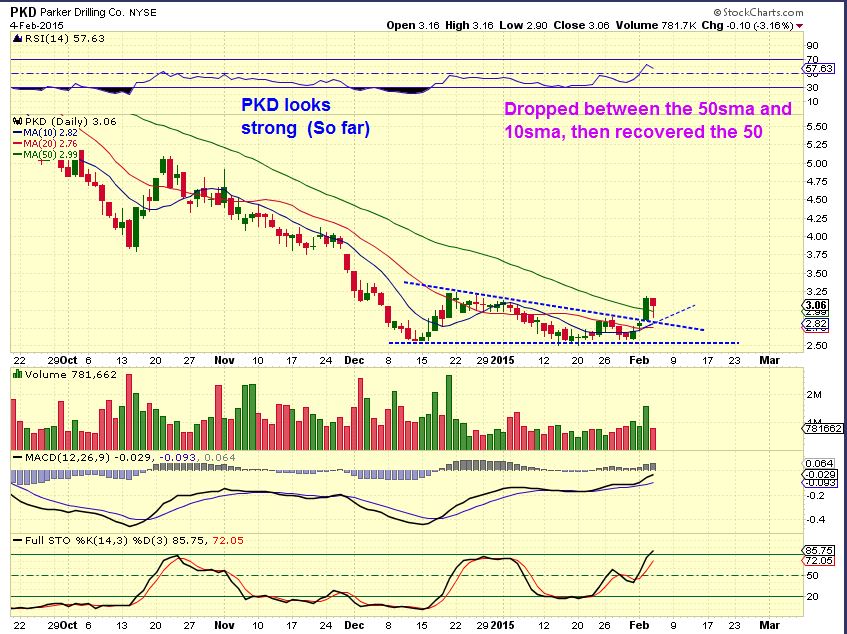
PKD…holding up – good support
I LIKE GDP AND SFY , since they havent run up yet. Posted charts yesterday. I own them , thinking they may play catch up eventually.
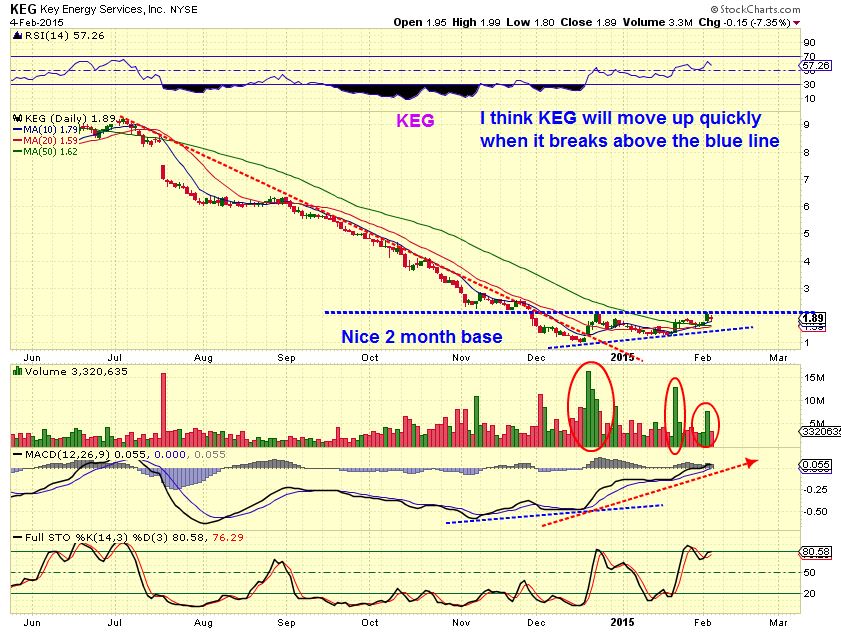
KEG
There are more, but due to the website being down, this is good enough for now. For most here this is great trading and very helpful, for a couple who emailed me, They get confused with too many charts. The answer to that is ….. “NO-I am NOT recommending you buy them all.” Look at the charts, I am showing ones with nice low risk set ups. They are all setting up well, I don’t put over extended ones here that ran up 80% and are destined to drop 40% ….they are all good, pick 1 or 2 or 3 ( basket) that look like they are back near support. Best wishes.
GOLD & MINERS…Nothing has really changed. We are close though, timing wise in cycle analysis, and technical analysis shows we are approaching a break down or a break out higher. Also could get that Fake move in 1 direction and then the other .
GDX FEB 4
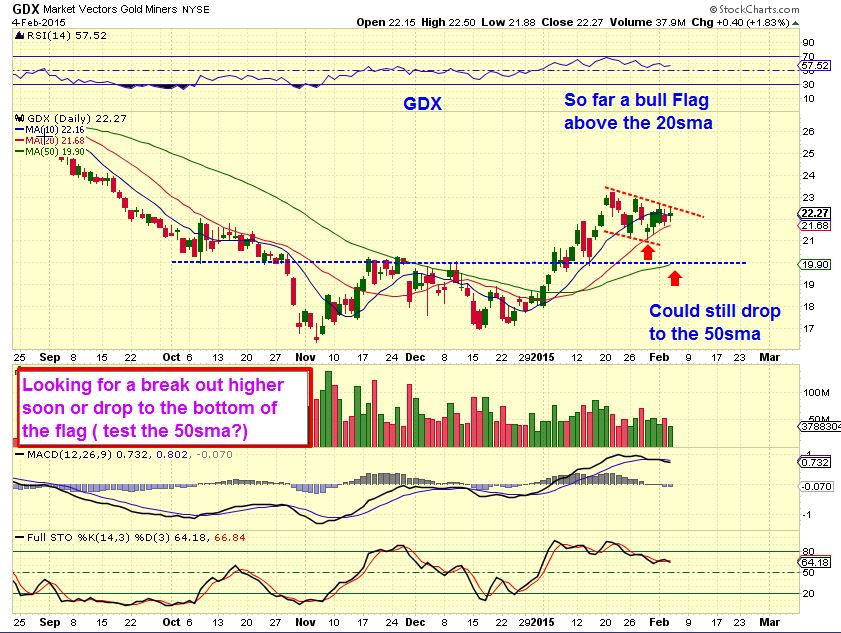
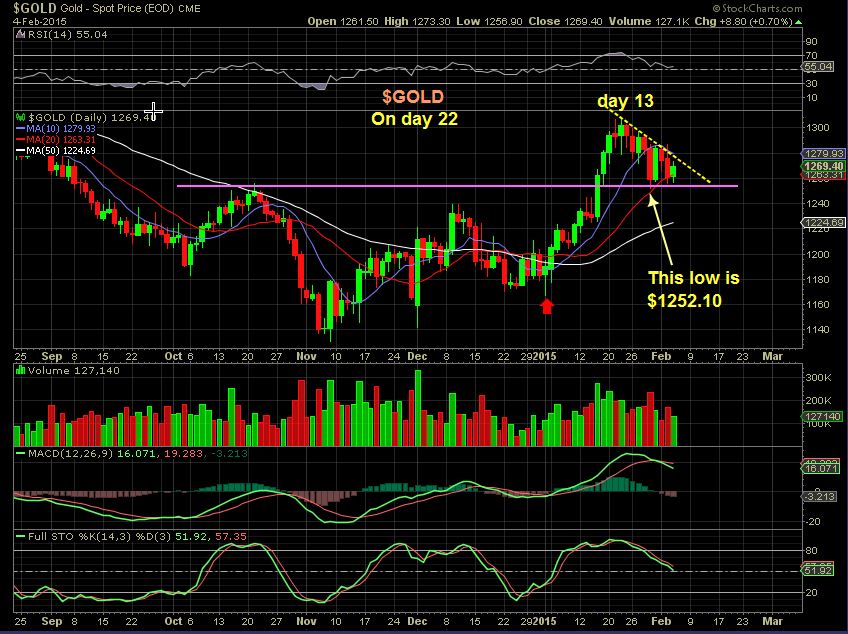
$GOLD FEB 4 – I would LOVE to see a break of the recent lows at $1252 and yet see MINERS hold up above their recent lows 5 days ago. That would add to the cycle count for GOLDs daily cycle low , but Miners would be ok on day 5 of the 3rd daily cycle. Then GOLD could pop higher and Miners would break out. Time will tell.
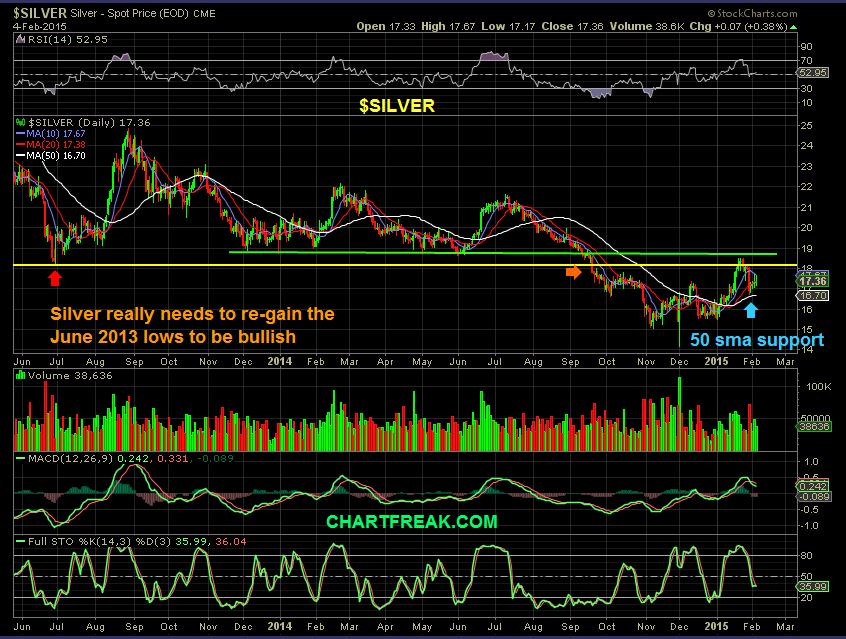
$SILVER ( Needs to break higher , esp on weekly chart)
As I have mentioned , Some individual stocks are just ignoring the noise and charging forward.
GFI, HMY, NG, and check out AU and CDE / PZG
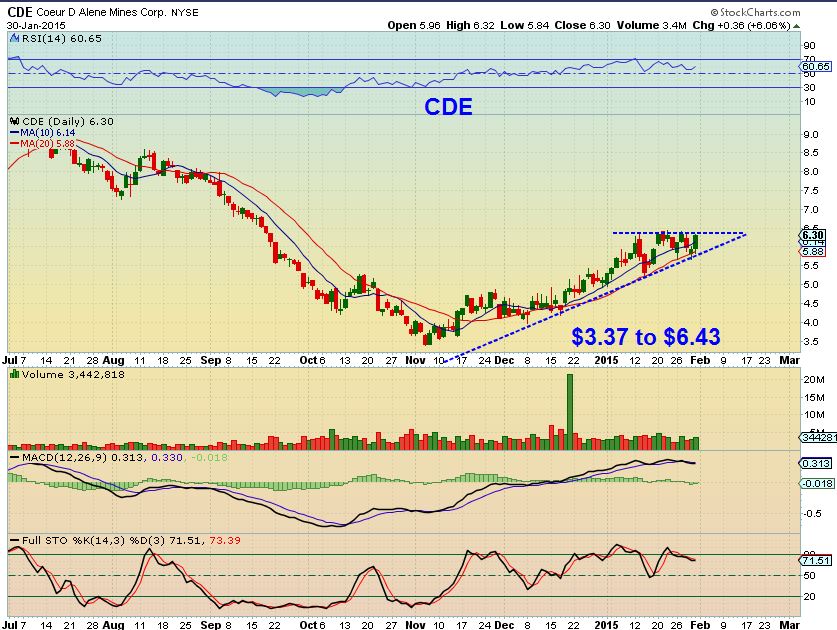
CDE pointed out sweet consolidation last week.
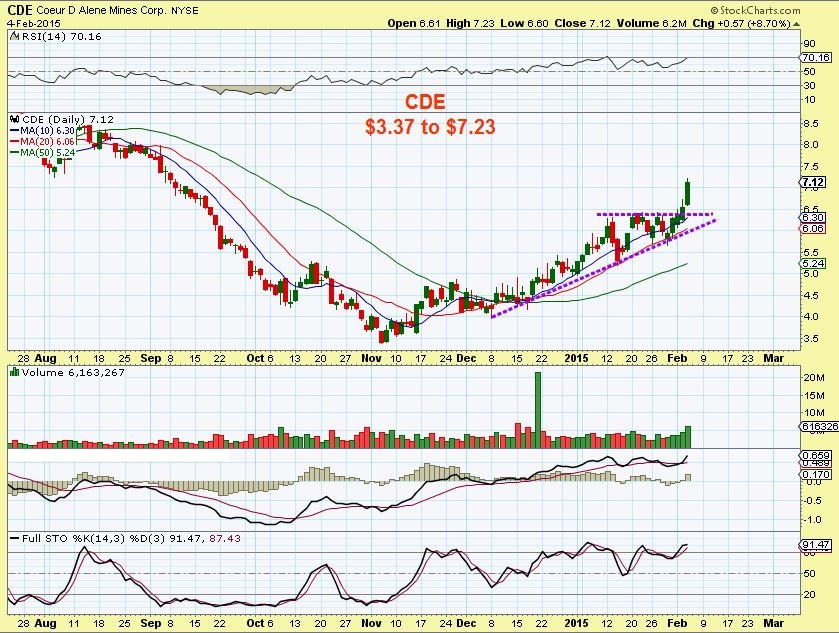
CDE breaks out ( and so does PZG)
Sorry this is released after the market opens, but it is often best not to trade the first 1/2 hr , sometimes an hour. Things can gap UP and then close the gap, visa versa. These ENERGY stocks are coming off of the lows, THAT MEANS they are volatile, will pop up & down , with Bulls buying and Bears shorting, etc. Remember how the miners were in DEC & JAN, I was answering tons of emails about a 1 day pop or a 1 day drop. Look at the big picture if your position drops. Pull up a 3 month chart and if it is above the supports…it may be fine.
I wish you all the best and thanks as always for being a CHARTFREAK reader!
~ALEX
P.S. Please excuse TYPO’s. I usually proof read , today I will just release this, and go back & fix typos and refresh. Thanks again for your patience
ENERGY TRADE ideas  TEST
TEST
Scroll to top
Alex, thx 4 the great update. No problem being a little late. Agree, I try to avoid the first 30 to 60 minutes of trading too.
All the pro s do Stu ; )
Alex,
Just thought I would mention that oil will form a weekly swing low this week barring something drastic occurring on Friday. Oil hasn’t formed a weekly swing since early Sept. Possible ICL forming??
The euro is also trying to form a weekly swing. Possible intermediate bottom in the euro and intermediate top in the dollar.
Yeah, good point on the possible ICL, I looked at the weekly chart last night and saw the reversal and then the higher high this week, but with Tech Analysis, I also want a close above the 10Weekly Moving Average ( in time) Same with $CRB. I really like the set ups WEAT & CORM wkly look good) .
For OIL , I expect a double bottom more than a V-Bottom, but you never know if we get massive short covering.
Thx
FWIW..one of my favorite things about your reports is the fact that you provide charts&TA for different sectors; I prefer diversification as opposed to being heavy ‘all in’ one sector…. thanks for all your insight. :o)
Thx Maria
We have a good group of investors / Traders here, I think that they appreciate the multi sector coverage for the same reasons you stated. In fact, I often neglect 1 or 2 sectors if they remain neutral to me , and I I’ll get a friendly email saying “You didnt cover NATGAS” : )
Dear Alex….
I don’t own SFY yet, where is it a good buy to step in after blasting of today ALEX.
No problem to be a little late this morning, I learn (through you) patient.
Thanks for all you do for us!
Hi Geurt,
You always ask me the tough question, where to get in after its already up 10% today. : ) THIS is tricky because they have fallen so much, they can just go up & up & up as shorts cover and buyers buy, so you could add a small position here , but a SAFE entry? HHMMM . Let me explain-
Look at DEC, it ran from $2.50 to $4.50, it could do that again if OIL/ENERGY surge higher. It pulled back yesterday to the 10sma, and today touched the 20sma. THOSE were safer buys . Will it pull back there again? I dont know , but that is your ‘safe buy’, with a stop below the 10sma if you want to see if it pulls back.
Since it is just coming off the bottom, you COULD buy a starter position here (maybe it will pull back at lunch a little).If it drops tomorrow to the 20sma , you could add…if it crashes down, get out, if it just goes higher & higher, at least you have some.
This could just be headed up to the 50sma with a couple of down days in the middle, at this point the LOW RISK entry was yesterday and Tuesday .
Ohh Alex…. I didn’t know I have always tough questions.
Sorry for that, hope to make it in the future not too tough for you again.
You know what my job is, I turned my back and two hours later you see SFY is taking of, thus thought oeps what to do now?
Hope you follow me, and many thanks ALEX !!!
How is this possible? Get even a picture of my son Timothy on your web Alex… Sorry for this. Hope you can delete it.
I will try to delete that…he’s a fine looking young man : )
EDIT: Deleted it, but had to delete the whole comment.
No, I am kidding Guert. You know you’re ok with me. And thx for the advice a few weeks ago with the anti-inflammatory!
Guert
IMHO, things are just getting statred in Energy, roll the dice and put in a stop as Alex says. Try NADL as Alex mentioned it hasn’t taken off yet! Best of luck
To Chartfreak readers, Just a thought- no guarentees
SD from the report has taken off! Up 20+% today again. GDP & SFY also took off , but NADL is a good set up that hasnt taken off yet. I bought yesterdays dip & gap fill. I added today . It has a lot of upside if it gets going.
THIS was NADL in the report. It has again moved above the 50sma.
.
Alex, In the short time I’ve been a member, you have already made more than enough to cover the years cost. Thanks Bill
Thank You Bill,
Very happy to hear that , I really do want people to make some money off these trades and I love it when I hear that they made their membership fee back and then some!.
GDP has pulled back mid day. I mentioned down below that that may be a buy opportunity. I liked the looks of it myself, adding to position bought Tuesday
Thanks to let us know Alex….. I bought 1000 shares @ 2.98
Just in case anyone worried that it sold off and closed like that, REXX, BAS, and a few others did too. It looks fine, and if you look at EOX…it did that yesterday (recovered well today )
We are getting a small break out in GDX/GDXJ guys/Gals : ) ( I hate the light volume however)
Is it possible to view the larger GDXJ patter as a cup and handle? L side is late November 2014, bottom is December 15th and 22nd 2014 and R side is January 20th. The handle falls a little over 10% (maybe not textbook). I’ve been viewing the “handle” as a potential H&S top when viewed alone.
Not a technically correct Cup & handle – and that minimizes the chances of it playing out like one, but I see what you are looking at.