
TRADE IDEAS
I have a lot to cover, so lets just do a quick review and on to the charts…
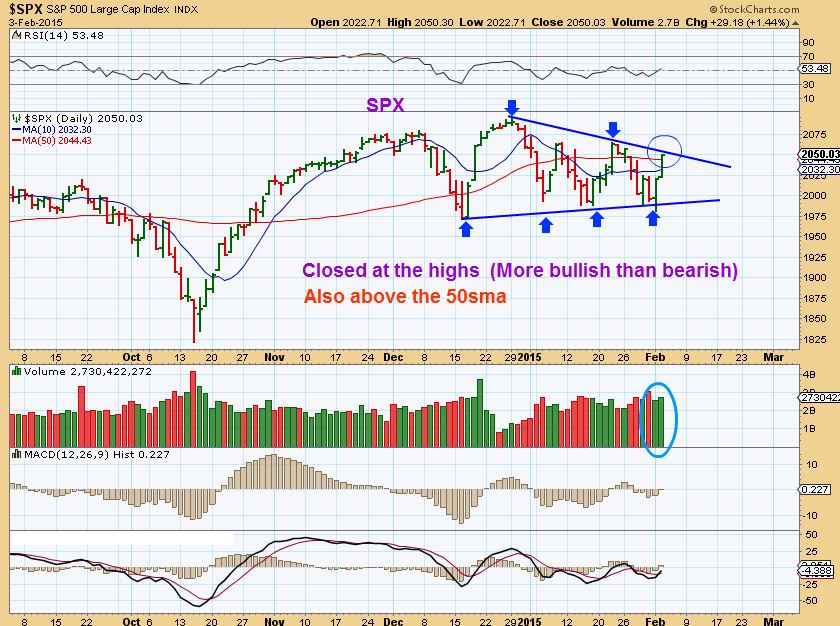
SPX – as the consolidation continues it goes from looking weak to looking more bullish
In prior posts I wrote that…
I was trading this consolidation , and said that I would go short here at the top, and then at the bottom flip to long with 1/2 position, while riding TZA ( A 3xETF short) . I posted this chart yesterday . I would normally add to TZA at the upper purple arrow, but I didn’t. I may close that short TZA position today , because this consolidation (Seen in the SPX chart above) does show strength now too. As the markets churn, they build steam for a break out or a break down . Many here know that I have spotted a few other areas that I would rather trade right now. (More on that later)
GOLD & SILVER & MINERS are also consolidating. They haven’t broken down or started looking bad – though some have written to me and said they look bad, they look really ugly. I dont see UGLY yet.
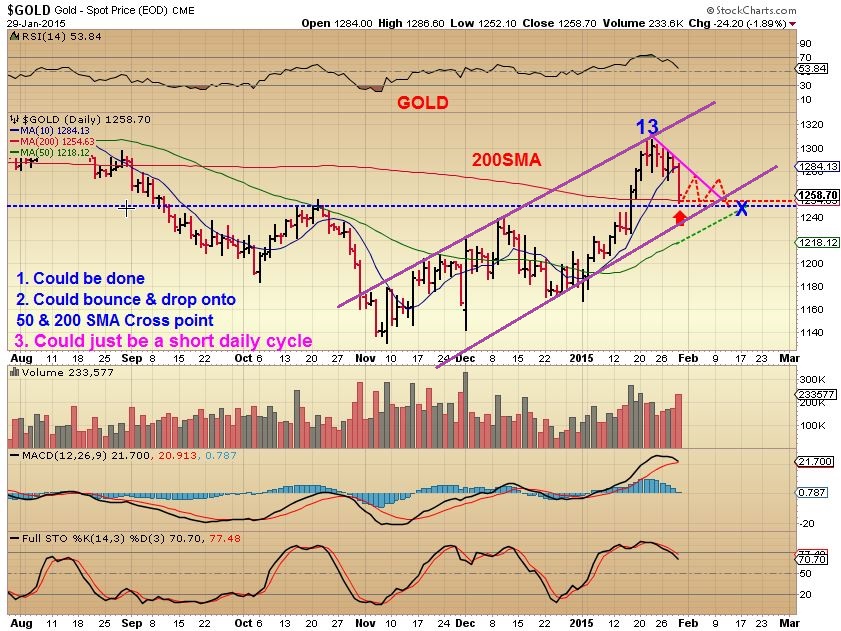
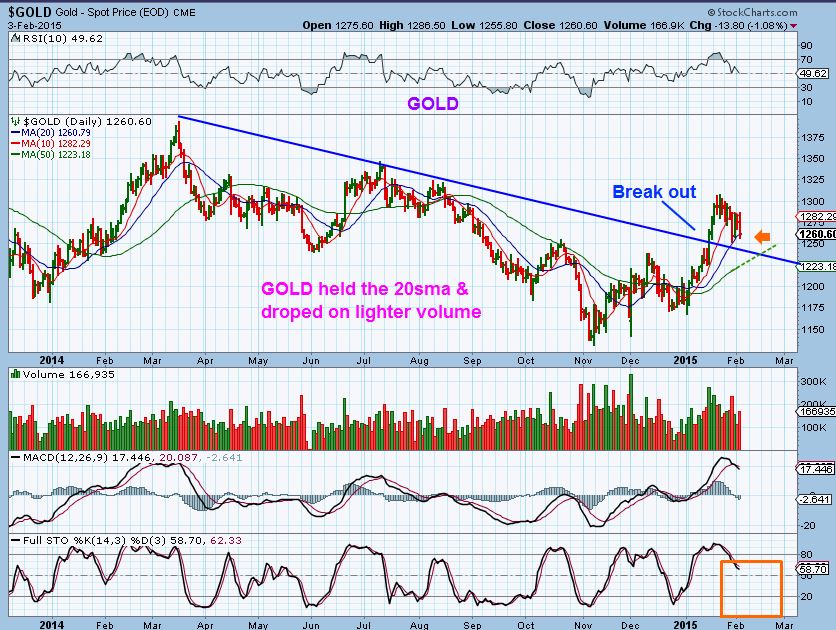
This is GOLD JAn 29. I mentioned that we could consolidate sideways so that you would expect it .
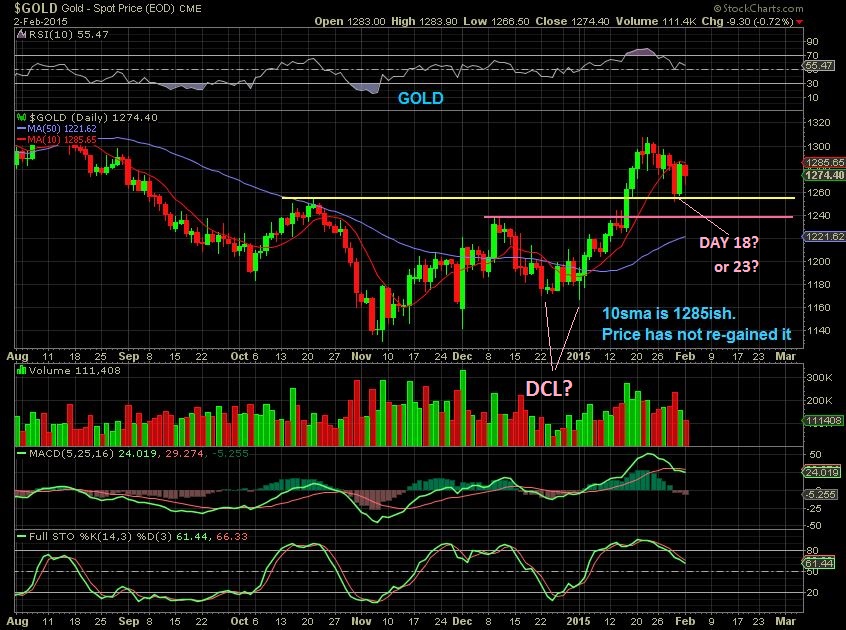
This was Feb 2 – Nothing UGLY and it hasn’t broken down.
This was yesterday . It may take time to see whether we are emerging into a new bull run higher or another Bear Mkt Rally. In Tech Analysis , we could “Test” the break out & 50sma and be very normal & bullish. In cycles that may give us a 3rd dcl. A break down is obviously when it becomes more bearish.
GDX – This is ugly? It may get UGLY, but this is a bull flag so far , above support.
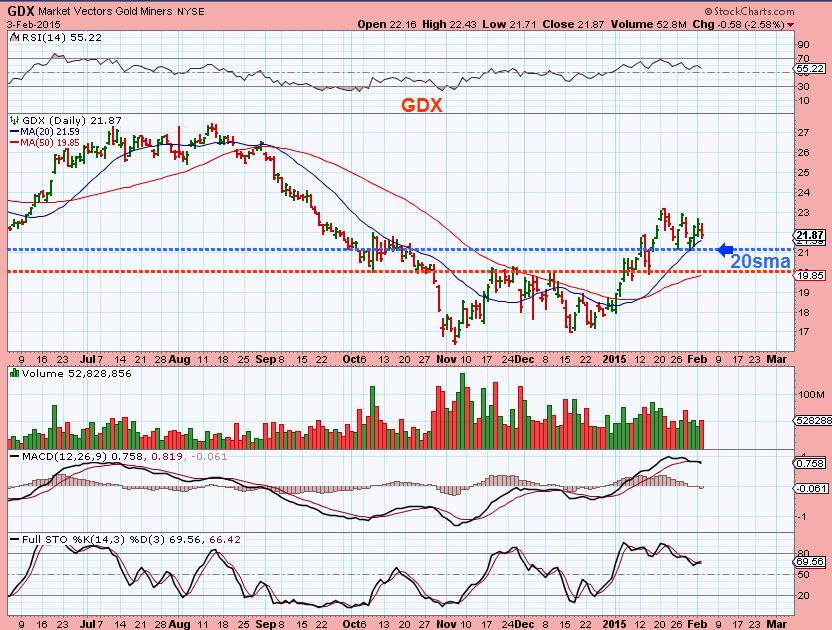
I think a few are watching positions tick by tick and down days bother them. NOT the majority here by any means. But this chart isnt broken down or ugly at this point. If one has positions and doesnt like what they see… it may be best to get out and find a more comfortable trade or raise stops to the blue line.
ENERGY & SOLAR
( DID ANYONE HERE NOTICE SOLAR TOO?) I have too much to say here. I wrote an article here last week on energy . To save time, I suggest you re-read it http://www.chartfreak.com/want-share-trade-ideas/. IT had many charts and reasons why energy was set up nicely. Most of you know that MANY of the energy stocks have since rocketed %-Wise quickly.
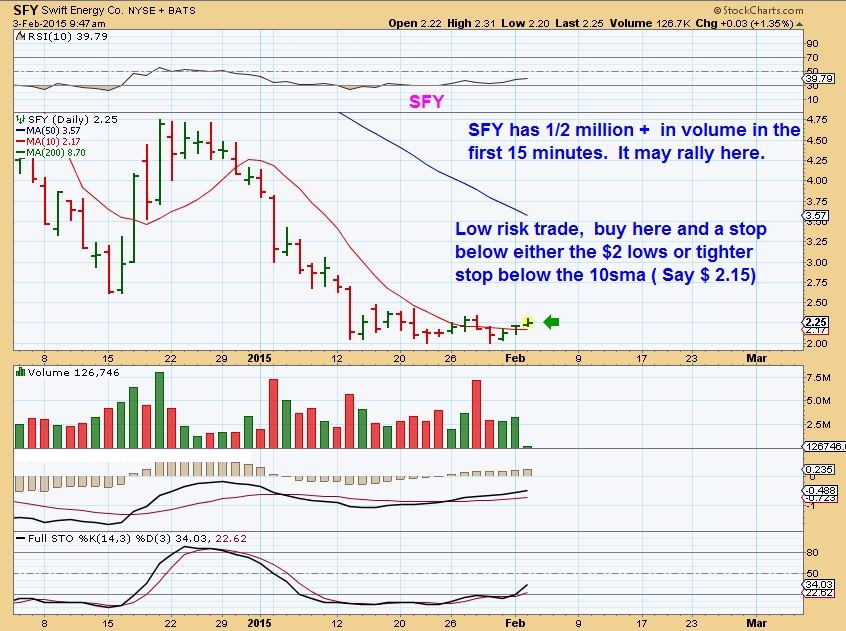
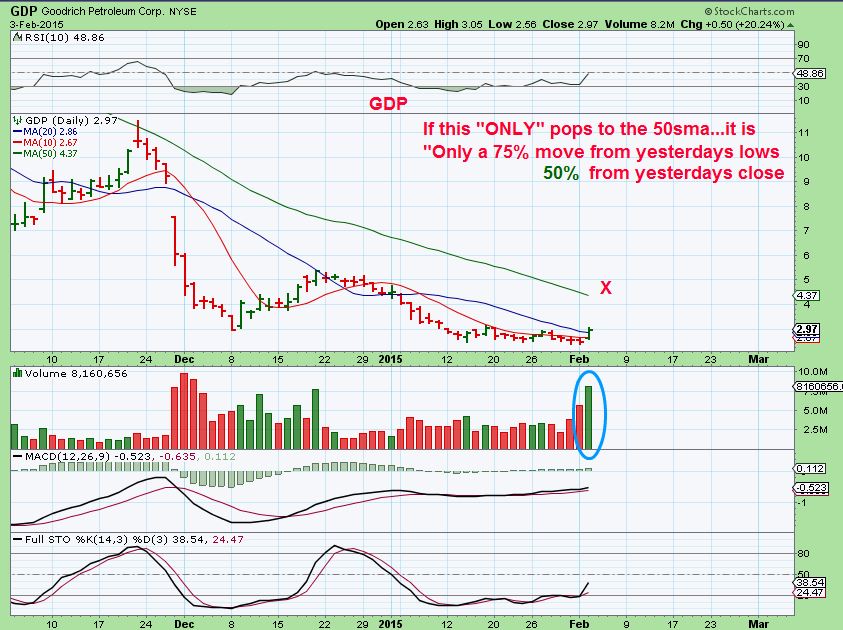
I wrote in the comments section yesterday that I bought SFY & GDP and a few other laggers and they started moving higher right after I did. IS IT TOO LATE? NO I now have seen many blow right thru their 50sma, so the laggers may do the same. These look set up just like the MINERS did in DEC. Scary to buy & Hold at the lows (just like the Miners), but you should review charts of AU, CDE, GFI, RGLD, and see how they ran. These ENERGY may do the same. DID it pause at the 50sma? Push above & RUN? push through and back-test? Then look at some that looked weaker- like NG (didnt run until Jan) – remember how concerned people were that NEM was lagging in Dec. It was called ‘Lame’. Look at how it played catch up now , and remember that I said many energy set ups look like NEM in Dec.
SOLAR is also running strong and I havent heard 1 person discussing it. Seriously. Stealth mode ramp up.
SO lets just look at charts of solar & Energy. Solars may be buy the pullback, some could be bought now. ( See FSLR, SCTY, SOL, YGE, HSOL, etc )
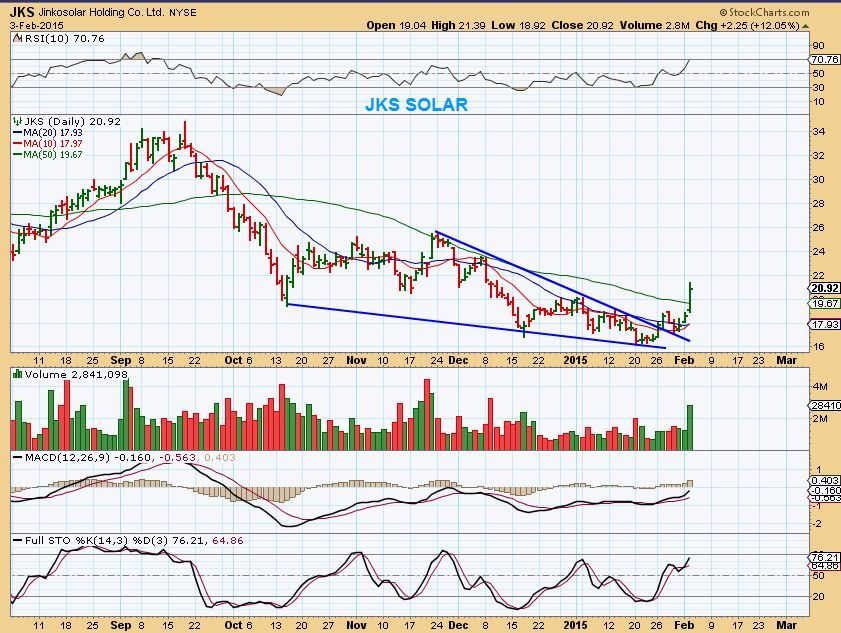
JKS DAILY- could run to $34
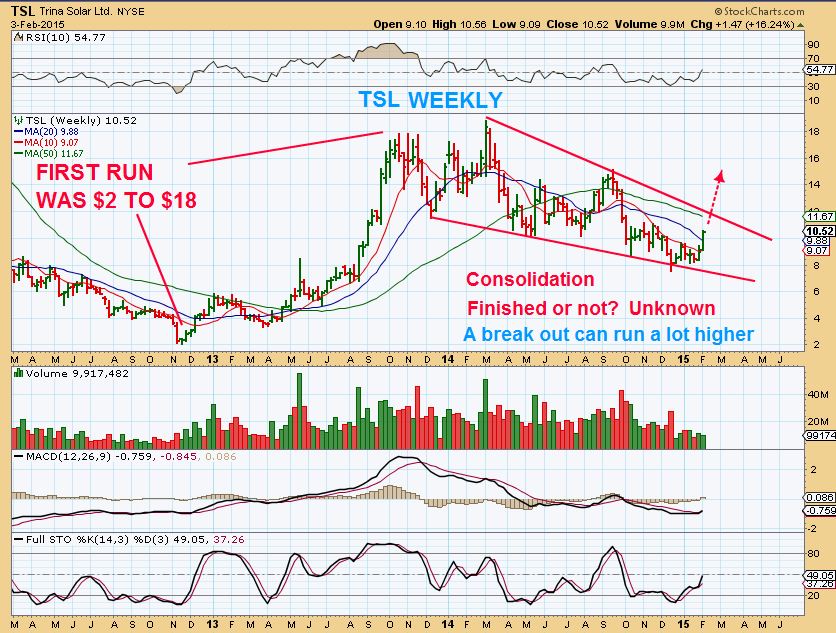
TSL WKLY $ 8 – $18 +?
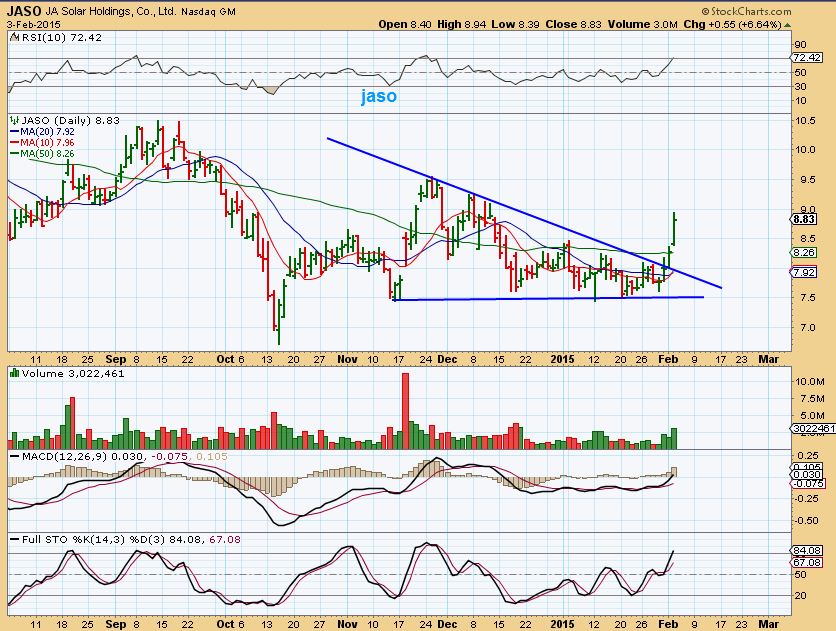
JASO
ENERGY
Posted in comments, as a BUY the LAGGER ( These could run MUCH higher),
NOTICE – SOME HAVE GONE RIGHT THROUGH THE 50SMA with no pause ( So could our laggers?)
I said I’d watch how this approaches the 50 sma
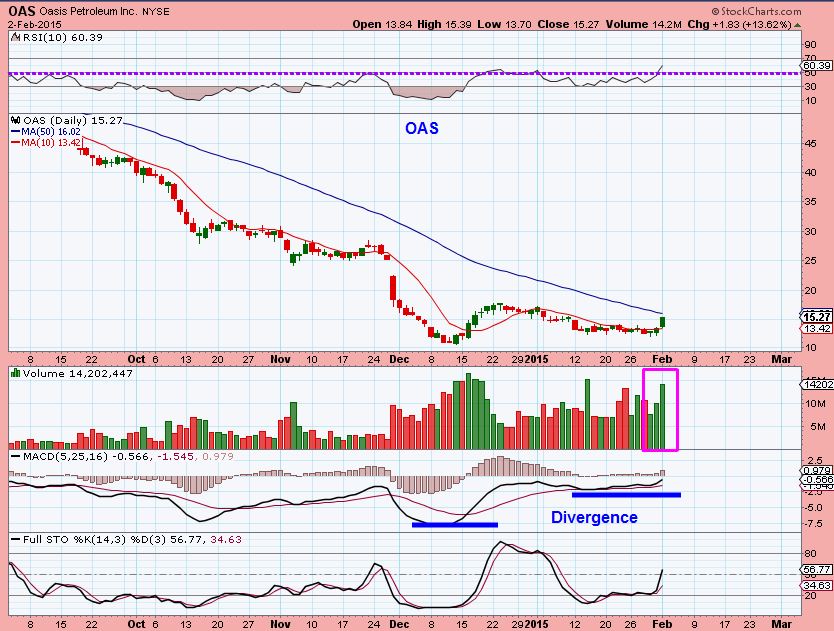
OAS – punched right through the 50sma
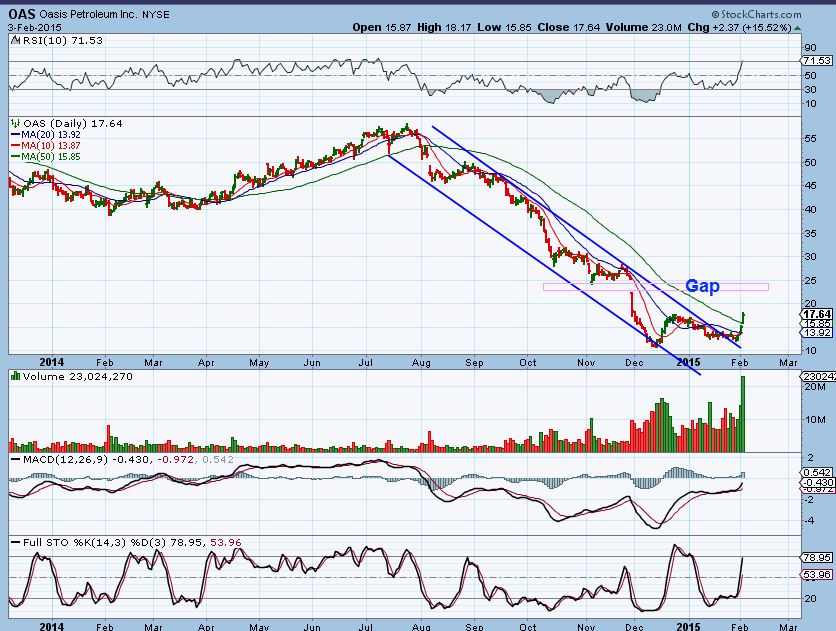
So since some are just punching right through the 50sma, the laggers may still have great potential in my opinion..
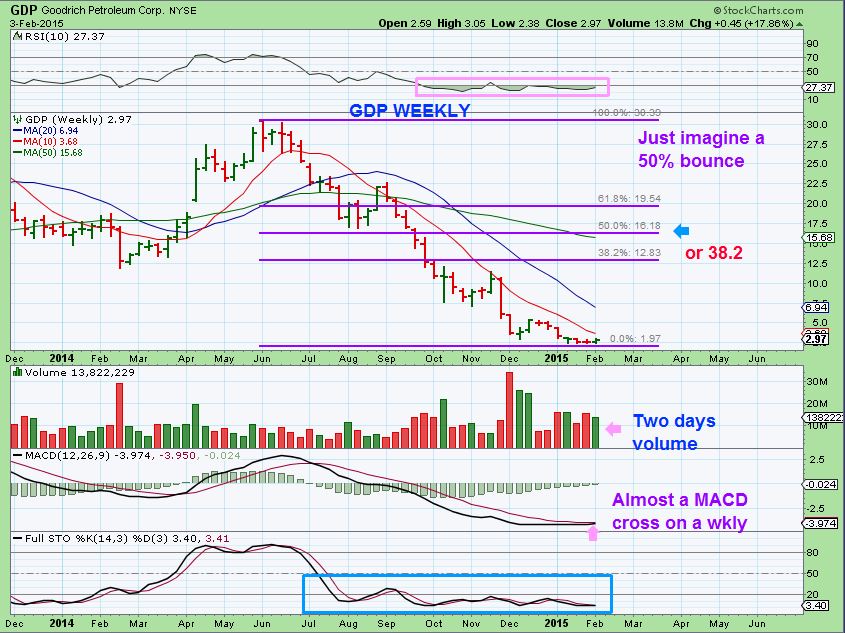
GDP WEEKLY ( good potential?)
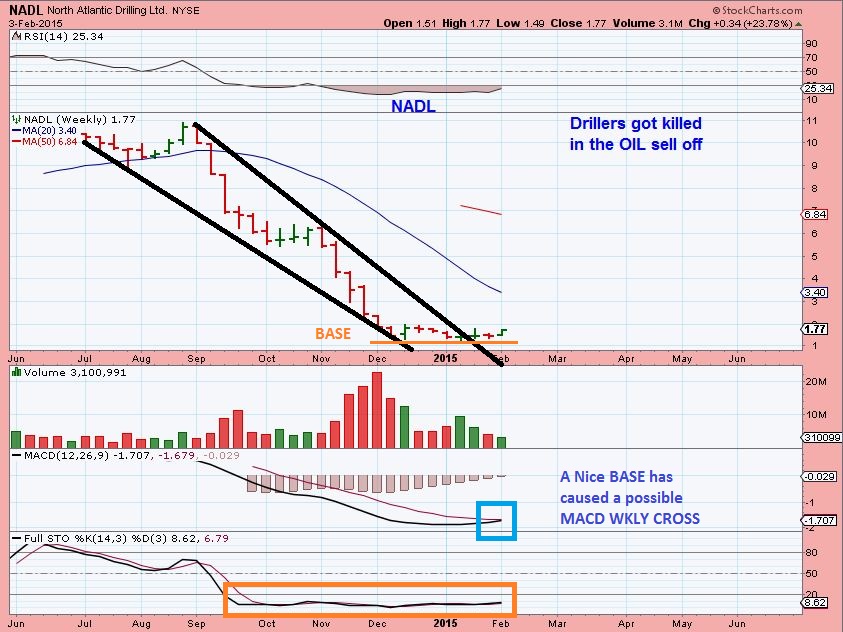
NADL – Great potential in the long run if OIL recovers.
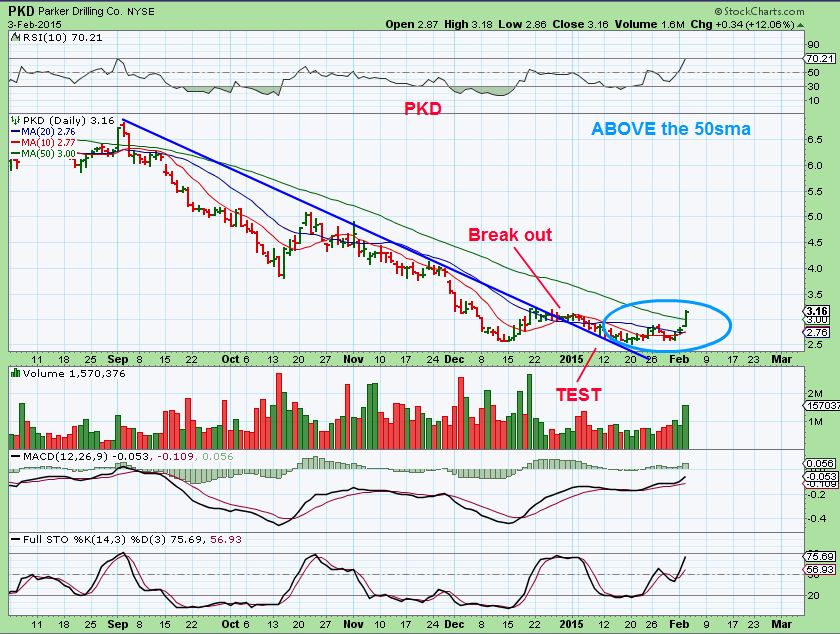
I had a ton of Energy stocks . For some a list helps them to look at the charts and buy a pullback or lagger , etc . A small list that you can look through is PKD,ZQK, NADL, EOX, TPLM, SFY, GDP, WRESS, WG, ZAZA, SDRL, NOG, MILL, OAS, DNR, SZYM MANY ENERGY STOCKS are down pre-mkt. Thats not a bad thing.
SO, a quick recap then I need to release this . The equity markets put in a reversal Monday and I mentioned it yesterday. Follow through actually looked pretty strong. I am not clinging to the short thoughts I had, since we have to be flexible and allow the markets to talk. The reversal looked pretty strong for 2 days. I re- bought a few energy & Solar yesterday morning when I saw the action ( SFY , GDP) still look to have upside potential). Energy has broken out off of that bottom in my report last week ( You should re-read it at that link above) The SOLARS are now breaking out and joining the bullish look. GOLD /MINERS are up in pre-mkt. I expect a pop , but I am watching it closely as a trade more than a buy & hold. This would be the 3rd daily cycle and they are often a burst upward and roll over. I think ENERGY could run like the miners did out of their double bottom lows. That means Miners ran from DEC through Jan…Energy could run from Feb into March. YES, there will be down days, look for reversals. I own SFY and GDP as laggers coming right off of the lows yesterday. Some Energy stocks look to be pulling back today, maybe an entry in some will present itself. AS ALWAYS- HONOR YOUR STOPS and have stops. I say it in every report. Its simple, how much can you afford to lose on that trade? I try to enter at LOW risk / high reward, and if I get stopped out, I move on to a better trade. You will always have losses in the markets, make your gainers bigger, thats all. Best wishes to all!
~ALEX


Dear Alex,
On the 3rd daily cycle it seems that you mentioned to me once they usually run 8-10 days then roll over if still in a bear market….have we started counting the 3rd daily cycle yet? thank you.
Hi Shermo- It is still unclear, but so far we may be on day 4 if it occurred at the end of Jan. ( You dont count the lowest day, you start with the next day.)
very helpful. Thank you.
On the pullback in energy ….I am looking for trade ideas. If the pullback is light & normal, want to own a small basket
Here is a trade idea for REXX for example ( similar idea can be used on others) . It may take 1 more day to get there, watch for light volume and a reversal at the 10 & 20 moving averages . Your stop is somewhat below the moving averages. Please ignore the typo on the chart …”BUILD STEAM ” : )
This is GDP today. That is what I want to see. SFY did the same (so far)
.
BIB again breaking down and not looking good. Can this market survive without the biotech’s and do they smell something beneath the surface? Looks like rotation is well underway and into solars energy (some long bases for some) and PMs (maybe). Looking to see whether EXK reverses here with volume. Nice Alex. Way ahead of the curve.
Good eye on the BIB.
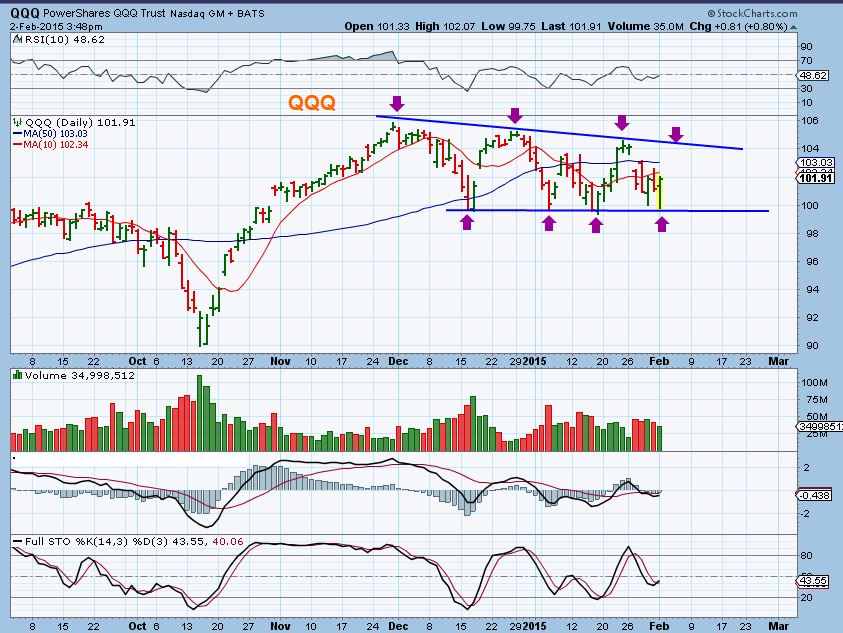
When I was doing my analysis in Jan and saw weakness in QQQ/SPX, I noticed lingering strength in BIB and IWM / IWC , which had consolidated , strength too..
It lead me to wonder if the small caps would break upward out of consolidation while the others lag or dip. Its really becoming a mixed picture…but for sure Miners did a nice run / Energy may be in one with solars, and I forgot to mention Rare earths. MCP / REE / AVL $WTIC and $CRB popped .
So the beaten down are having their turn.
Saw the REs too. SUNE (solar) has a nice long RH&S base working. Solars were acting so poorly most of last year after a great run up consolidated well and now since oil may have bottomed are popping from nice patterns/bases. Again, thanks for that head up.
Saw the rare earth’s yeaterday. Might be a good entry point unless they totally dissapear. AVL,QRM
AVL looks interesting , dipping toward the 10 sma. REE showing some push through the 50sma. Cant tell if its just short covering for now or what, but sweet 3 day move