
How About A QUICK GOLD UPDATE
I want to share with you what I am watching in the Gold & Miners arena
This is just for those that may want to try to trade the possible DCL . It is risky & you must be able to watch your positions at this point, or even stop out if we were to gap down, but I like what I am seeing in various ways. I will show you how I am watching this…
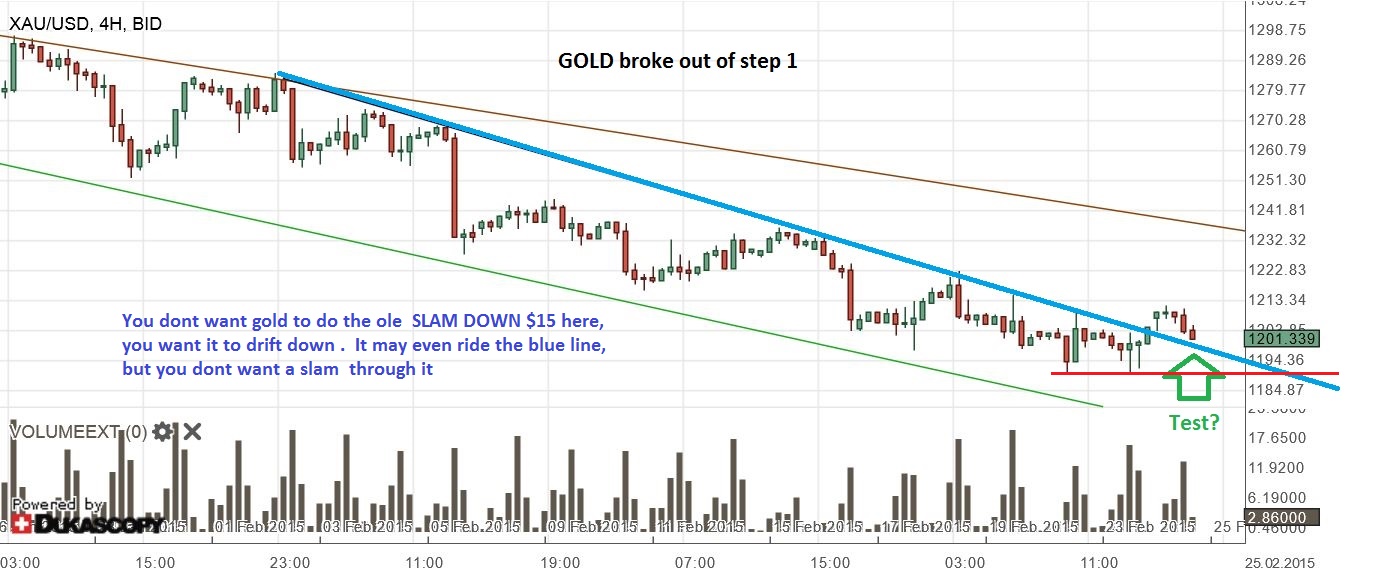
GOLD INTRADAY – As mentioned in my report, GOLD POPPED to $1212 last night and started selling off (Booo…Hiss Hiss) or is it an opportunity at a low risk area? I am watching for a test anywhere between $1294 & $1205ish . Along this blue line. It needs to be a slow sell off, not those sudden $10 drops . It needs to reverse higher.
(Click all charts to open)
I am watching GDX ( AND GDXJ). They gapped up this a.m., but those gaps do not need to fill, I am merely mentioning them because they are there and price can glide down there.
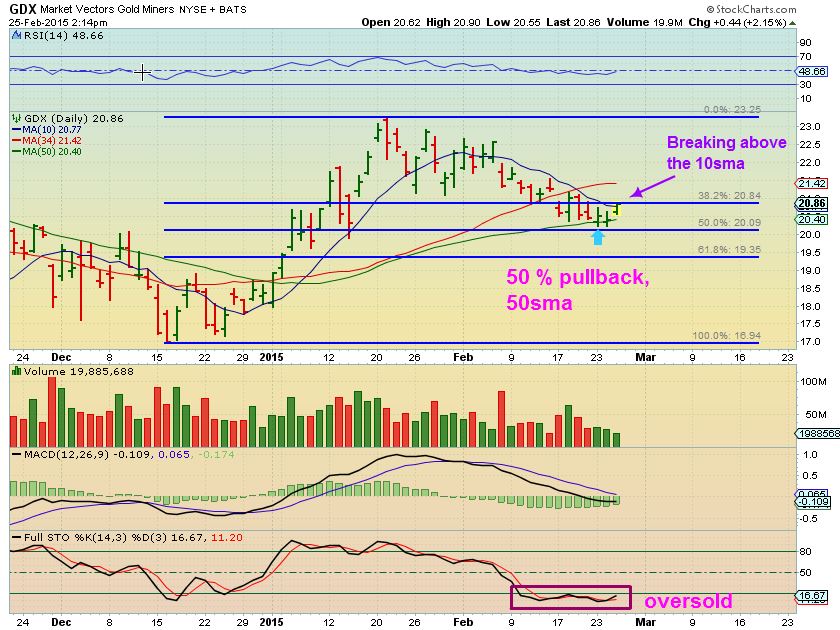
GDX BUY A CLOSE ABOVE the 10sma
GDX 4 hr chart is oversold longer term. It broke from a wedge, and wants to test it. I watch the ‘test’. Is it light? Does it hold as support? I can buy on the trendline if so. Can it even fall there, or are buyers holding it up as Gold slowly sold downward? Lets zoom in…
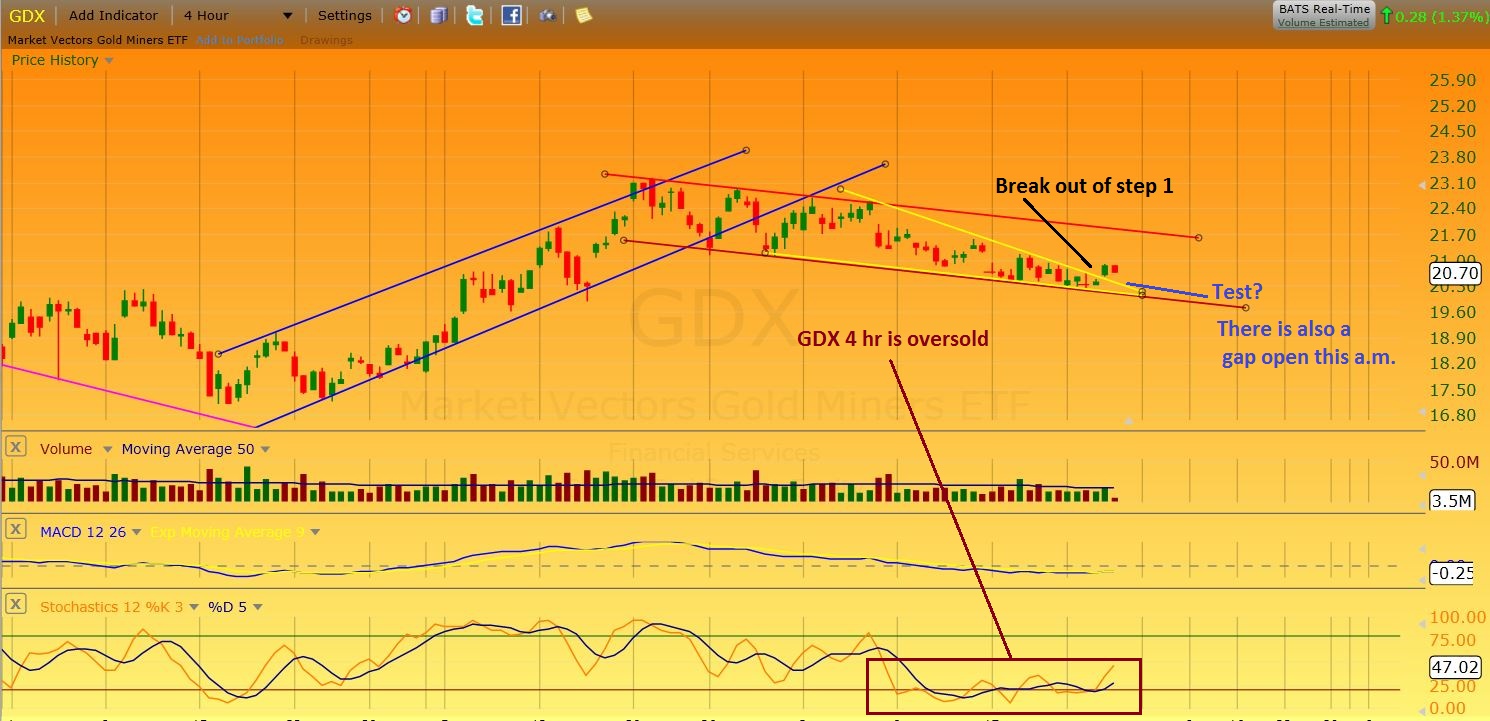
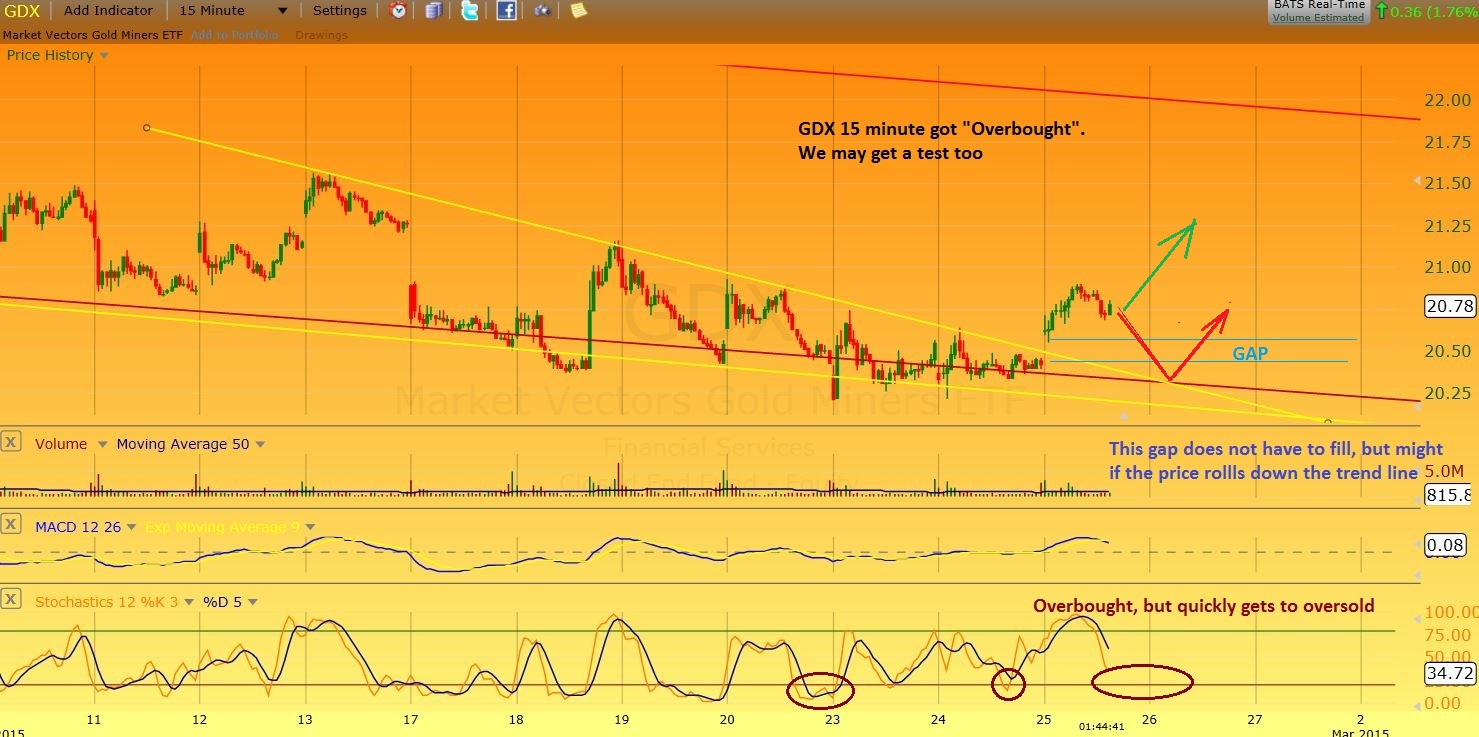
USE A 15 MIN CHART
GDX 15 minute. IT got OVERBOUGHT, that is why we MIGHT get the “test”. IF the DCL is in, this can just go higher from here . It also may tag the trend line later & run higher. It also can roll down the trend line gently and fill that gap (but doesnt have to) .
I like the volume in GDX and GDXJ, I took a position in NUGT this a.m. and may add if we sell further. I may also add if we just go sideways, and I will adjust my stops to where I am personally comfortable getting knocked out & trying again.
I have been reviewing the MINERS today and am having a thought about that extended run in Miners actually being 2 small daily cycles. REALLY? POSSIBLY. I will share more about this tomorrow. I am still very cautious, since Miners have bounced around for weeks, but think about this- So far they couldn’t really slam GDX down below the 50sma (Interesting) . I look at NEM, ABX, AEM, RGLD and AG and a few others , they are looking stronger than weak. Some near former highs after a month of and basically down days? I see interesting signs of strength. SO I am went long and will see what becomes of it. AGAIN, I dont want GOLD to trash that trend line, I want it to drift down there if it drops further (And as I write it has and it turned higher).
Those inclined to trade Miners , individual Miners or JNUG / NUGT may be interested in how things are shaping up. Those cautious or uncertain should remain on the sidelines…at least until tomorrows report. You’ll have 1 more day to examine the out workings of todays action.
I want to say that I also really like the way REXX, , BAS, GDP, EXXI , PDS and more are ‘setting up’ & acting today. The charts are very nice. I think they may be less risky than Miners at this stage of their set ups.
( and also trading UWTI, UCO, USO for oil etfs – some 2x & 3x …BEWARE)
~ALEX
I had to sell 1/2 of my GDP, just proper money management. I bought at at $2.50 and earnings may provide another entry, but GDP is set up to break out higher. That is a great looking chart so far.


How are KEG, NADL, SOL looking?
fine
Alex, I set my stop on NUGT at $13.40 when it was up around $13.65. This was around 10:30. Naturally it came down and stopped me out at $13.39. How can I better position my stops to prevent getting bounced out right before the train leaves? I’ve been using the low of the previous three trading bars on the 5 min chart.
FYI, looks like we had a nice AB=CD pattern in NUGT this morning.
I dont measure a stop on a 3x based on the action of the 3x, because the swings are wide. You have to r=be willing to risk more , or just quickly grab pops higher.
Just so you know, on a daily chart , GDX could possibly pullback to the 50sma again tomorrow & fill todays gap, test that trend line break and move higher. If so NUGT could drop to new lows, so 3x ETFs are tricky.
I base my stops on GDX or GDXJ
Anything on natgas behavior Alex
Hi Steven,
Normal behaivor, as expected. Remember this chart? NATGAS is currently at $2.86 . See the 50sma on this chart. It is range bound for now
Storage report at 1030 tomorrow could provide a little spice to natgas. Maybe a move to resistance at to this week. Provided it is seen as bullish. Should have had a pretty significant withdrawal.
Alex, I second the question on SOL. Seems like it’s biding its time. I’m also holding my XLU and UTG positions at the moment. They may have to wait for fear in the market before they move. Thanks.
I’m also a bit concerned with SFY today.
You can just sell it if you dont trust it. looks like it may POP over the 50sma .
SOL is down 1 penny and bounced off of the 50sma. Seems ok. Sometimes they take a few days to consolidate, as you ca see from the charts (like YGE) they pop, then drift, POP, then drift.
I’d sell out below the 50sma , or jjust sell it if you’re bored with it. Its not a bad chart.
THANKS A LOT ALEX FOR YOUR EXTRA REPORT!!!
EXCELLENT WORK YOU DO.
LOVE IT.
Thx Geurt, I appreciate it.