
Learning Obedience ?
I have learned over the years that you never win when you try to tell the markets what to do. It is best to be patient and listen to what the markets want to do… being patient and less forceful can help keep one from getting bitten . With that in mind, I have a lot to look at in the weekend report, Equities, Natgas, Oil, Energy stocks, Gold & Miners , etc so …To The Charts!
After shorting the trading range a couple of times at the tops with TZA , I posted this Friday Morning
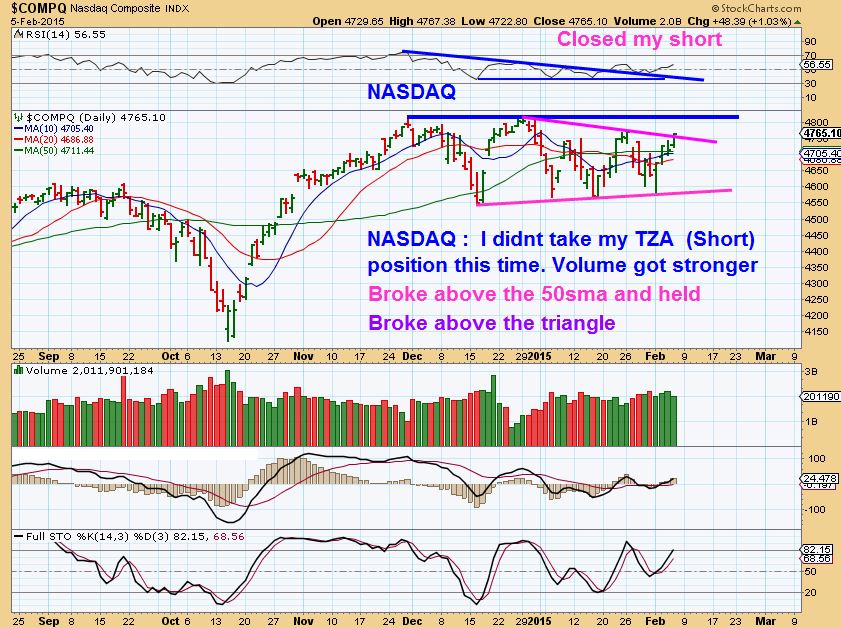
I wanted to watch things here and even though the markets did reverse into the close and started to head down, I still didnt take the short side. Let me show you why…
Markets go through phases. Bullish Phases, consolidations, they break down, and they can recover if circumstances assist. THAT is why its important not to cling to a bias. Once bullish isnt always bullish, once bearish isnt always bearish and if you notice changes, go with it. I was bullish most of last year. Turned semi bearish in NOV/ DEC & Bullish with GOLD/MINERS, based on my observations. Now??
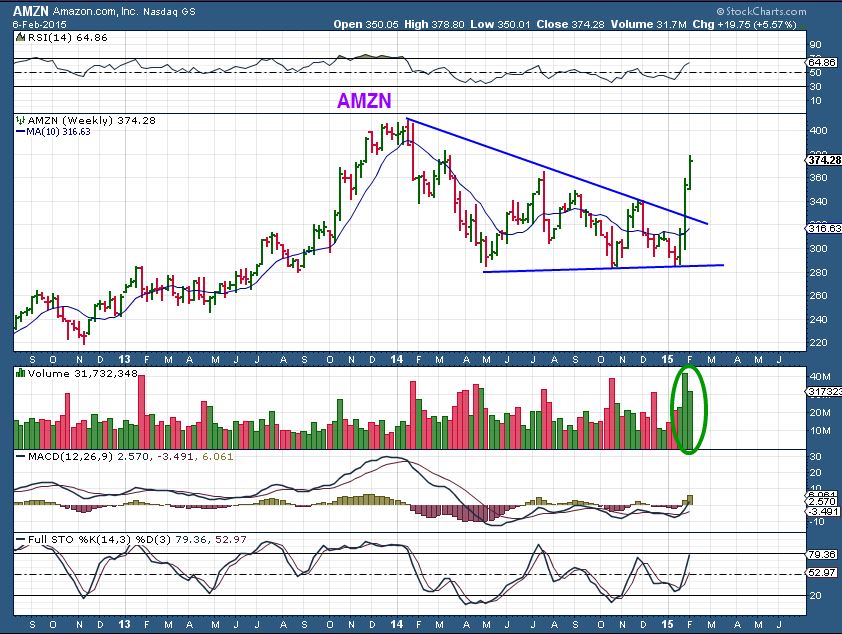
Notice this: I had seen weakness in many stocks and mentioned them (AMZN, GOOG, YHOO, BABA, INTC, etc). Some have actually started to recover, which could mean that the weakness was just part of a consolidation, building steam for another leg higher.
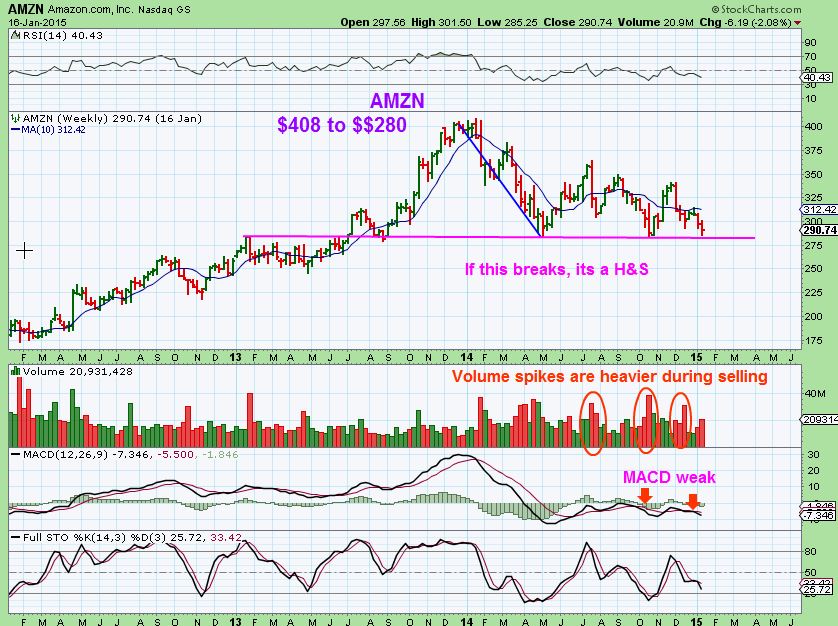
This was the chart of AMZN, when I was bearish (possible H&S) $408 to $280
AMZN NOW ( $280 to $380 in 2 weeks!)
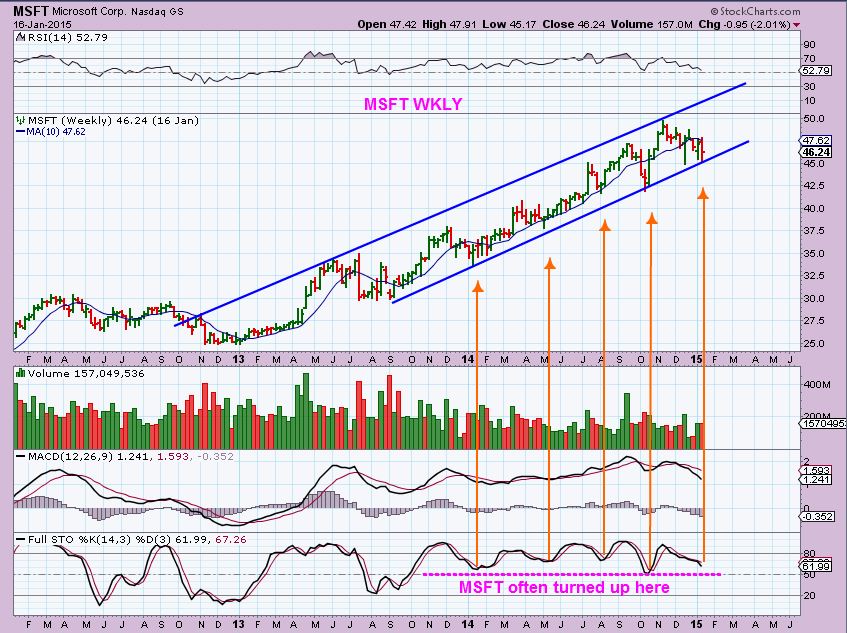
I pointed out the weakness in MSFT WKLY, when it had weakened. 3 days of down vol- THAT looks bad and broke below $42.
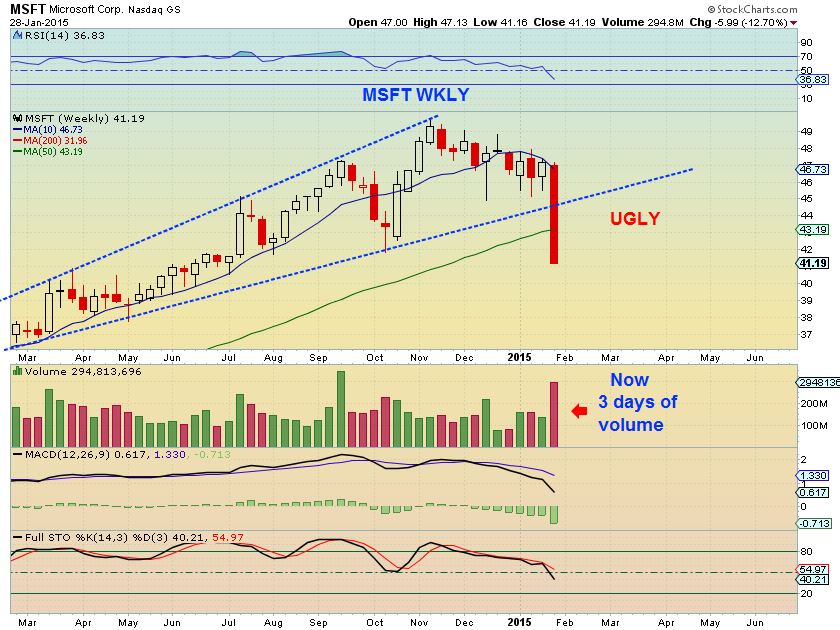
MSFT as of Friday, above $46! The week I pointed out ( last wk) actually reversed & regained that blue trend line (above chart ). This week was down,but not too bad. Maybe its just a consolidation too?
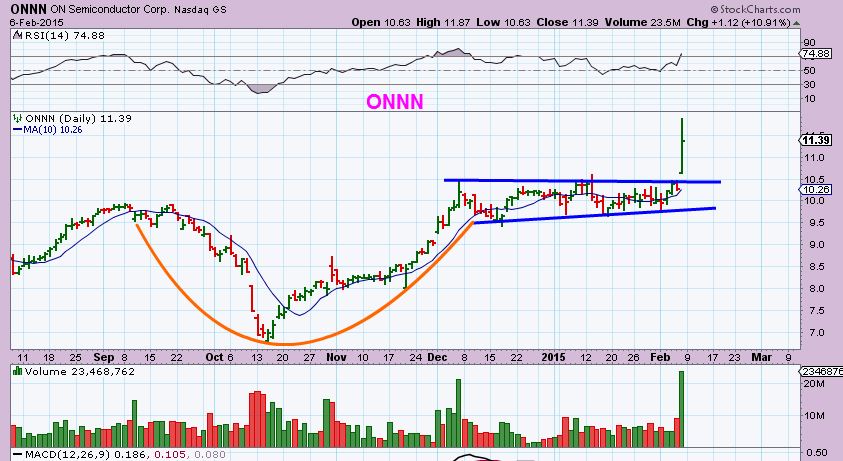
During that time of weakness, I also pointed out stocks that I thought were bullish despite the weakness and even mentioned ( ONNN, CREE, MON, TWTR, WIFI, ETC)
TWTR with this chart & ONNN on Jan 22
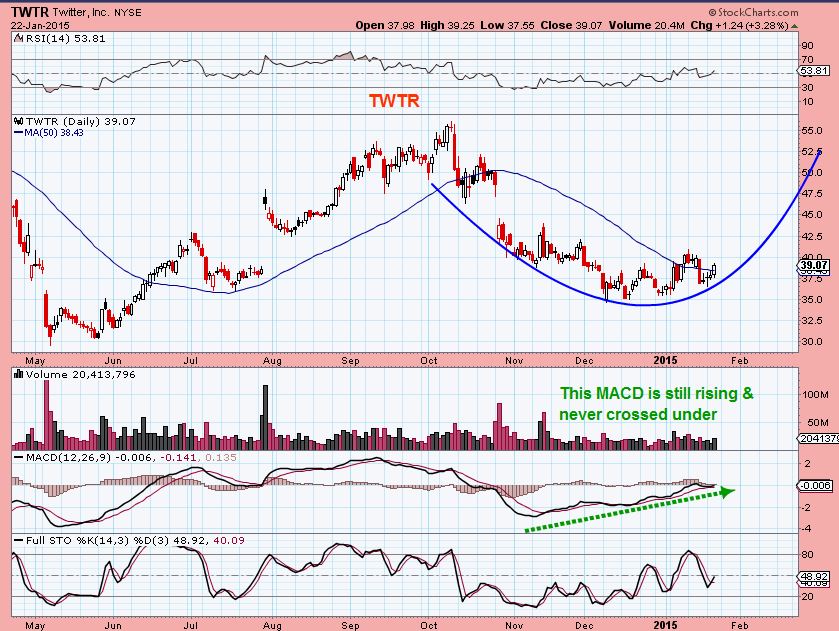
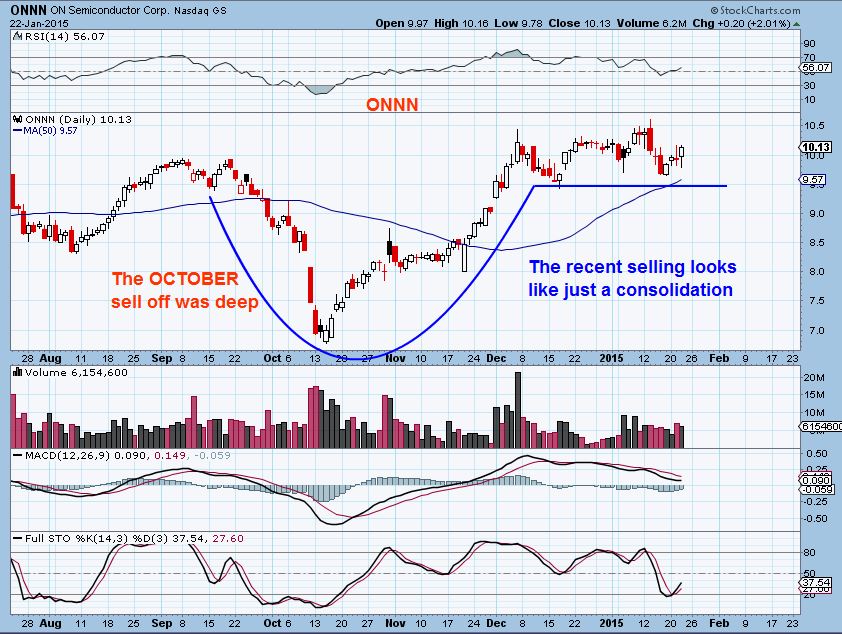
Look at the results today
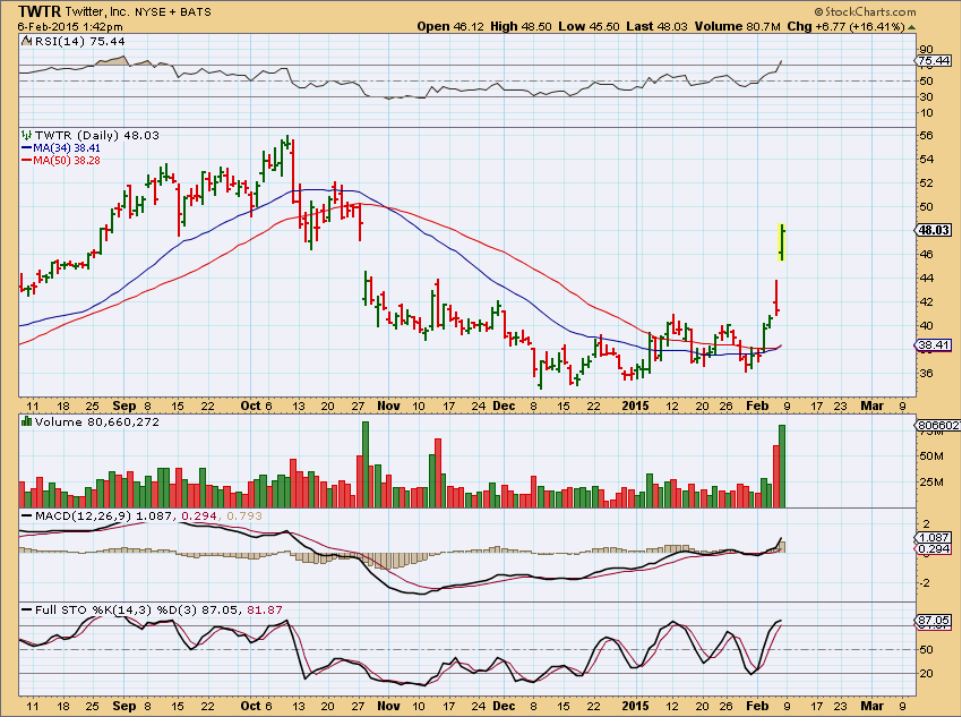
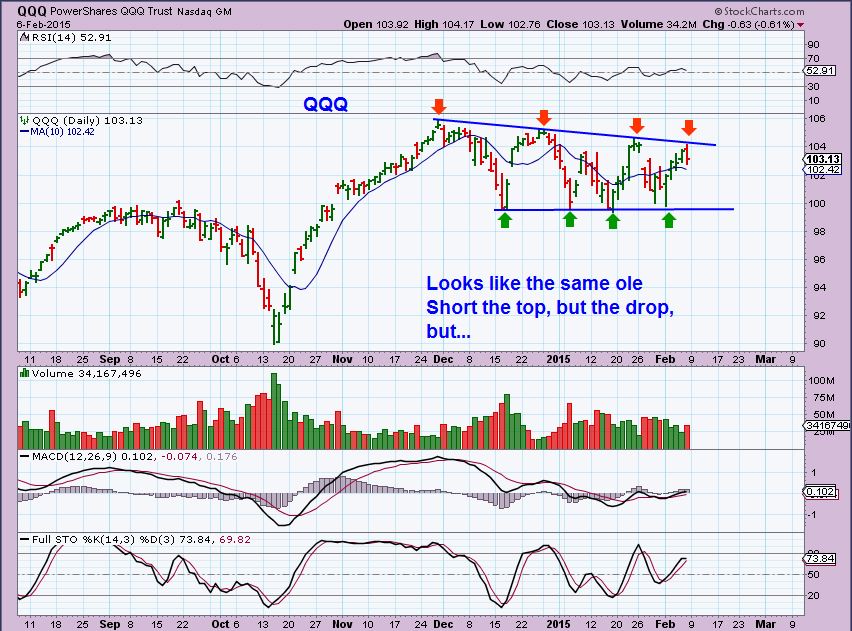
So, They did prove to be bullish set ups and the ones breaking down like MSFT and AMZN are starting to look bullish too. THAT is why I decided to wait and see if short via TZA is still a good idea , even though the markets did turn down and sell off into the close Friday. It looked like a perfect opportunity to take that ride again. See the reversal.
QQQ – Perfect short opportunity? It did reverse lower into the close. Maybe / Maybe not.
Then I looked at the weekly charts.
Here is SPX = Not bearish, strong volume reversal on a trend line
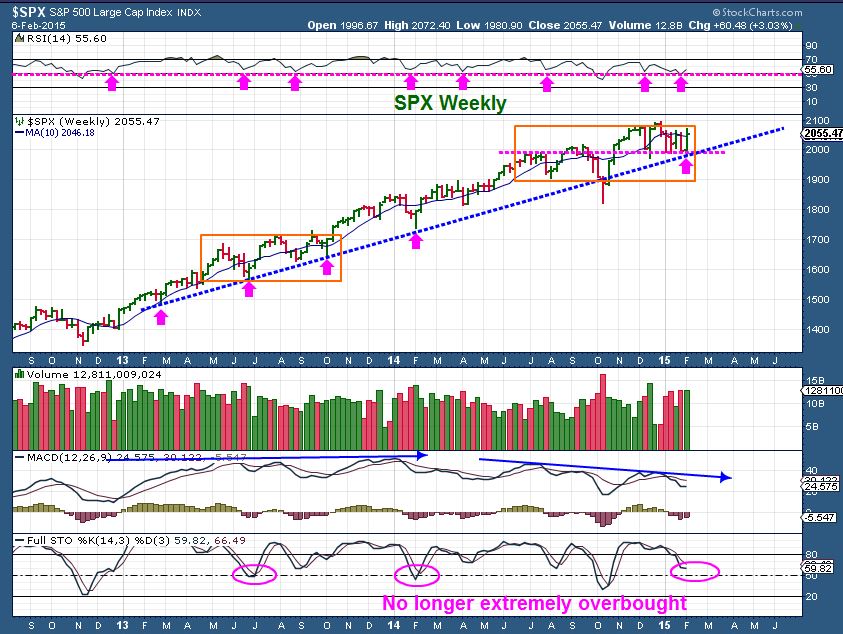
There are also other “positives” in the NASI , ACCUM / DISTR , and other internal indicators that I watch , So patience was needed. I had to step aside or risk getting my face bitten off like the Woman in our main picture trying to get too close and force a wild pup to obey my wishes.
For those who like charts ….I also like the looks of PXLW, ZNGA, ELY ( Nice recovery in progress) , UBNT off the lows, KMX (gap filled) , (Steel stocks jumping X, STLD, GSI, AKS )
You know that I like the set ups in ENERGY ( & Some Solar stocks perked up too) . Some energy stocks are breaking higher , double bottomed, and so on. They are near lows and this can lead to volatility & bull / Bear battles, but it can also lead to Excellent ramp ups as shorts are forced to cover. Risk /Reward is in our favor and the charts have bullish set ups. See last weeks reports for more.
See BNO / DBO – they look bullish , could pull back to the 10sma, as a possible buy point.
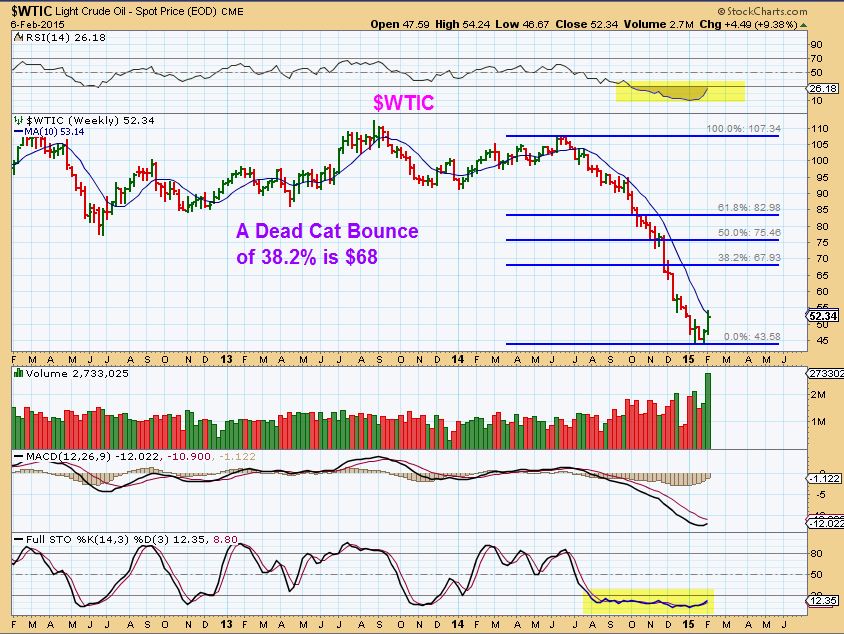
OIL WKLY, there could be follow through next week, since most on CNBC are calling for new lows.
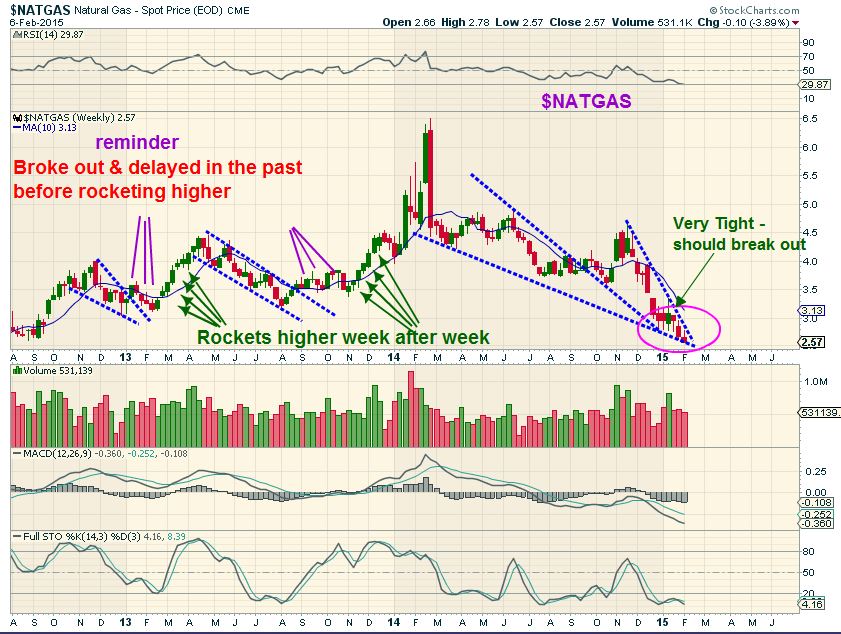
$NATGAS WKLY – Tight , looks close to breaking out ( In the past, however, sideways came before the blast off. It doesnt have to be that way, just an observation.
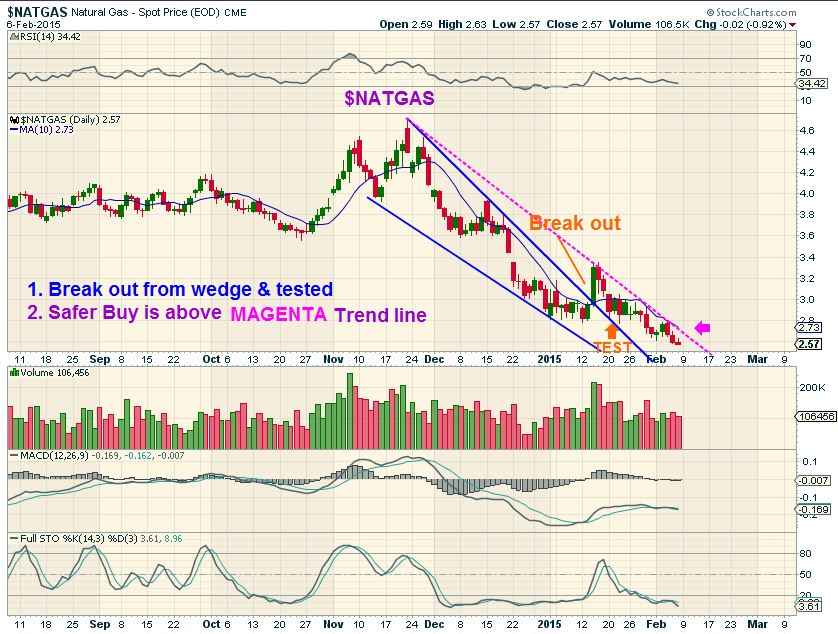
$NATGAS daily
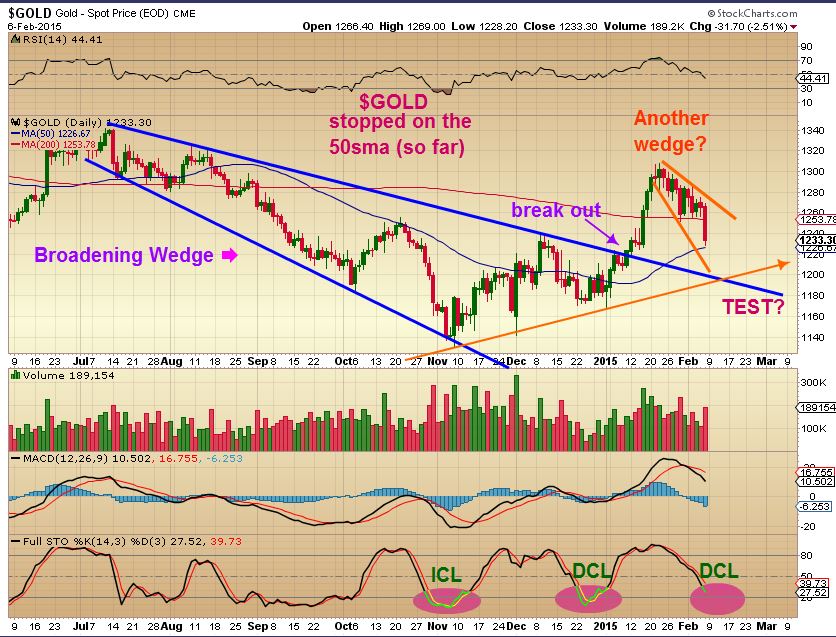
GOLD- if you have been here for a while, then you know that using Tech Analysis…I always look for a “Test” of a break out . It just happens a LOT
GOLD DAILY – Is that $1200 going to get hit to test the trend line break? (Seems a bit deep, but the stochastics looks like it has a day or more to go).
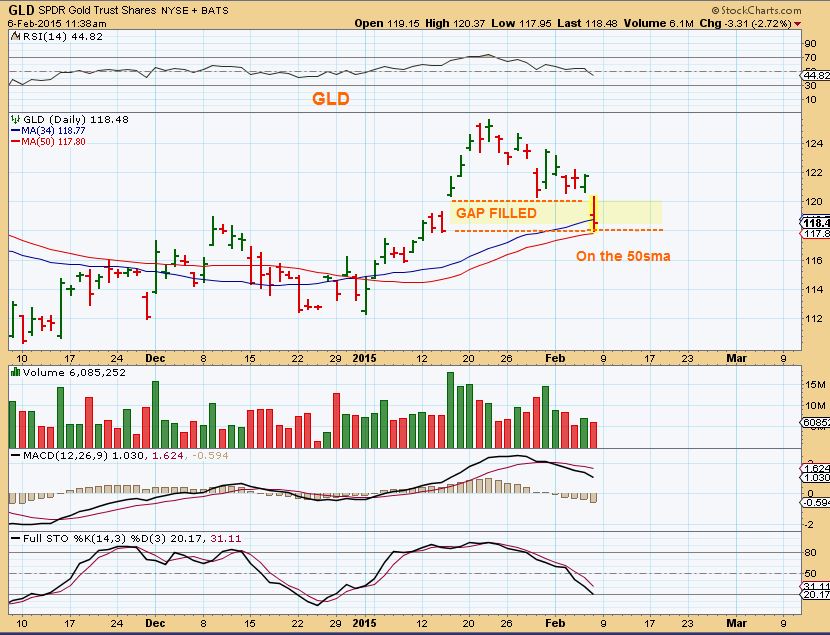
GLD did a gap fill, will support hold though? Time will tell.
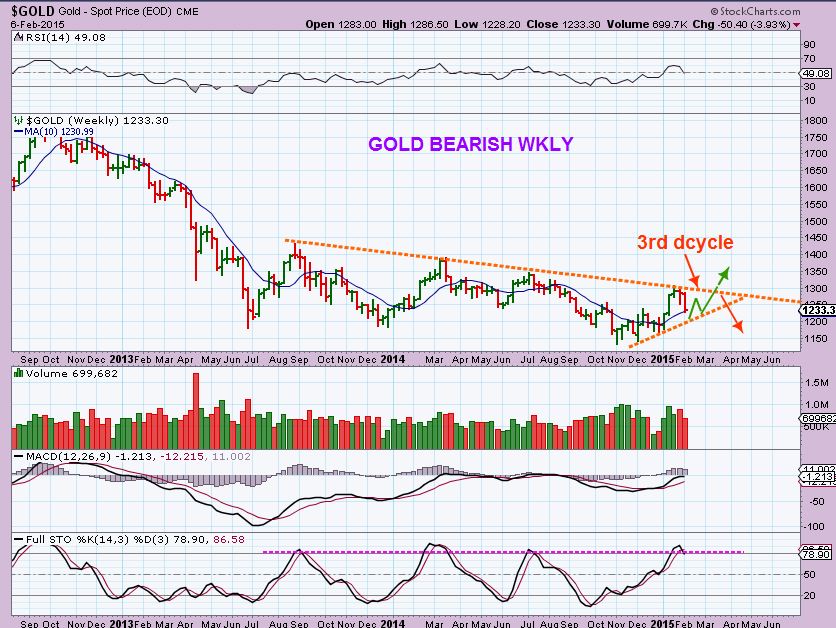
PLEASE NOTE: GOLD WKLY BEARISH – THIS SAYS A LOT TO ME. IT SAYS “CAUTION“.
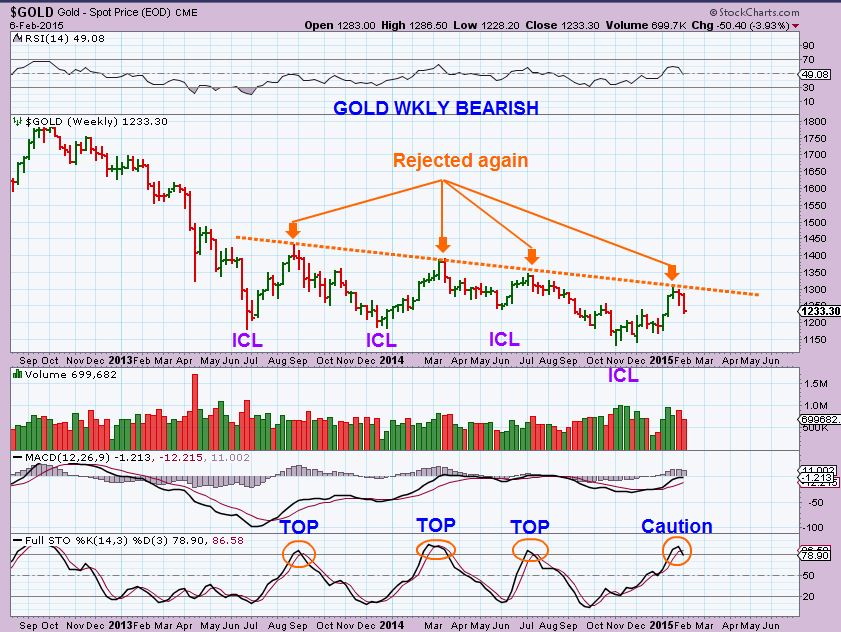
So does the above GOLD WKLY BEARISH chart mean “GO SHORT NOW”. Not yet. If we have a 3rd daily cycle, then I can see this bounce possibly happening and your short position would hurt. Watching patiently for now.
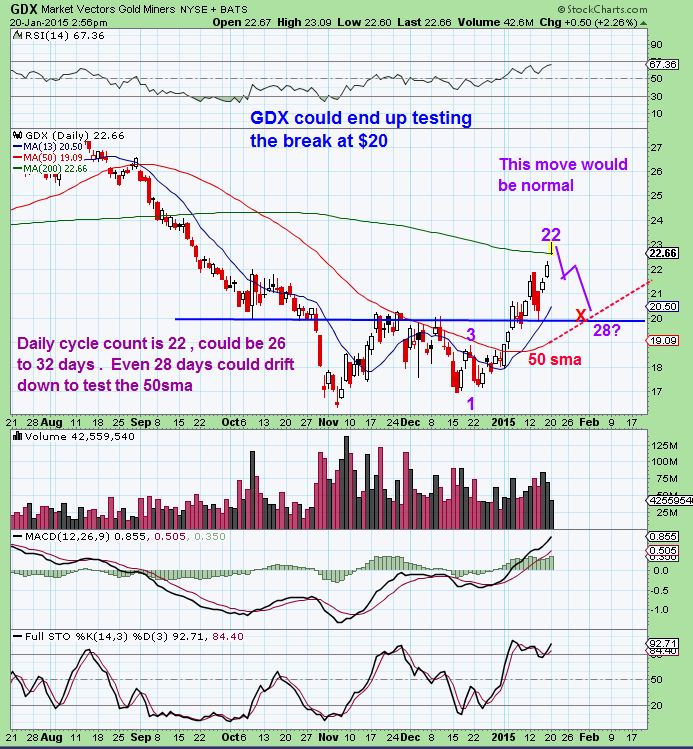
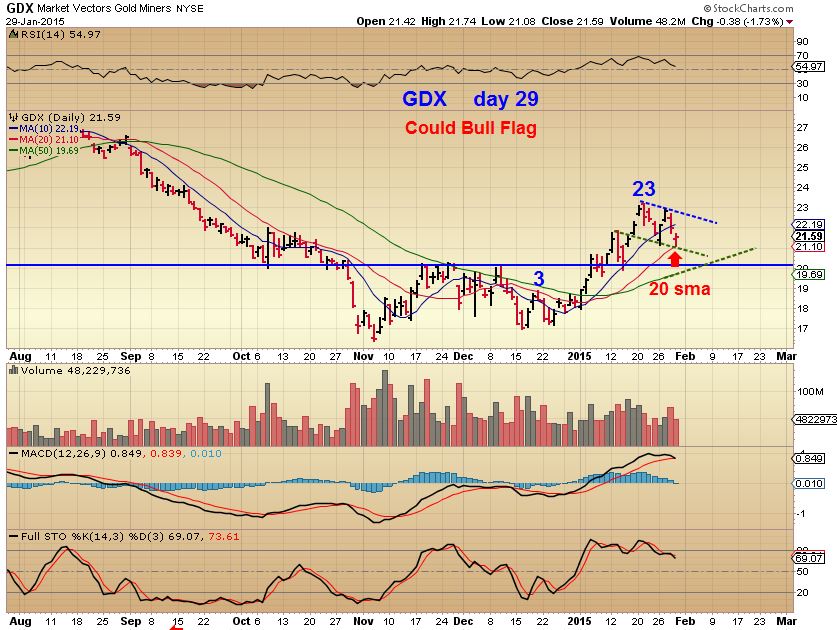
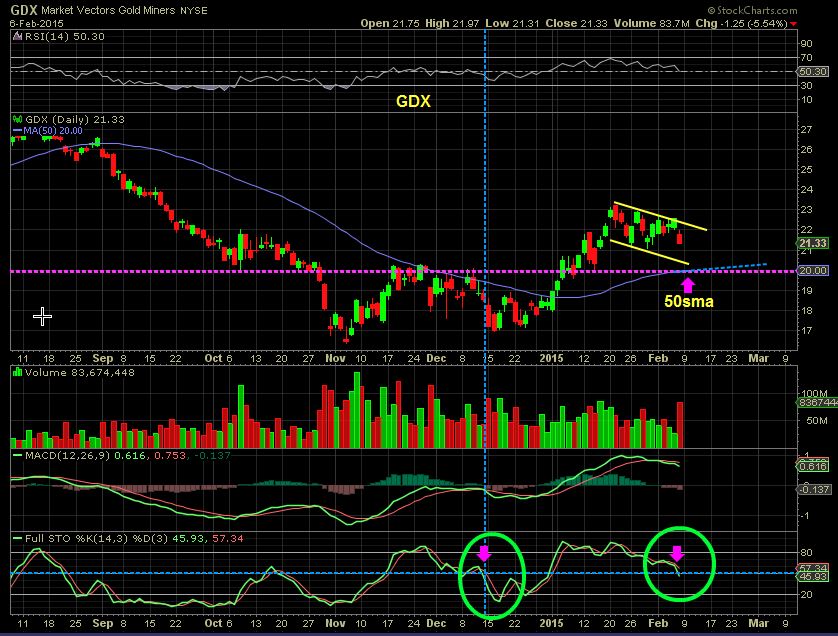
GDX WKLY – Will it finally test the break out near $20 this week?
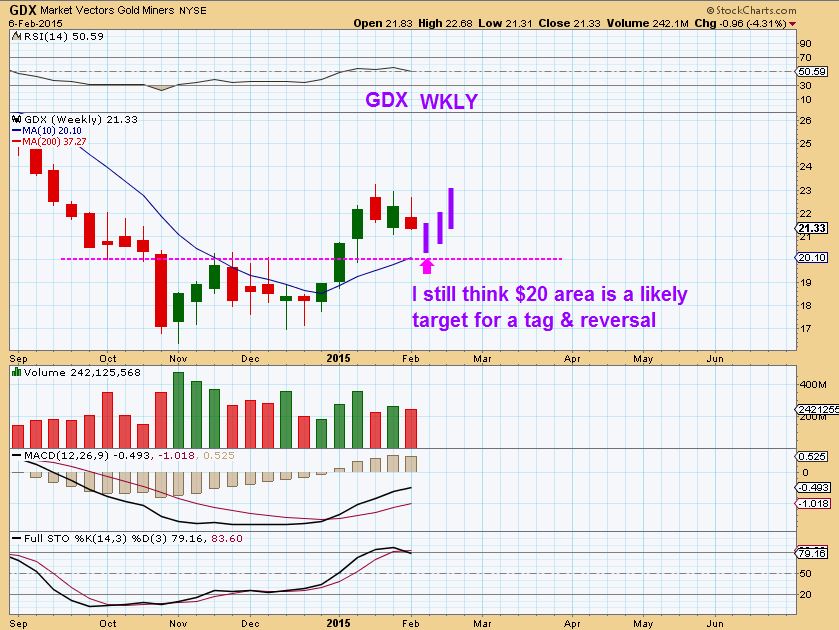
I posted this Many times since JAN 20 – I even showed it as going into February, but it feels like its been forever!
The bull flag is the reason it seems to be taking so long
GDX – looks like we could just drop there now
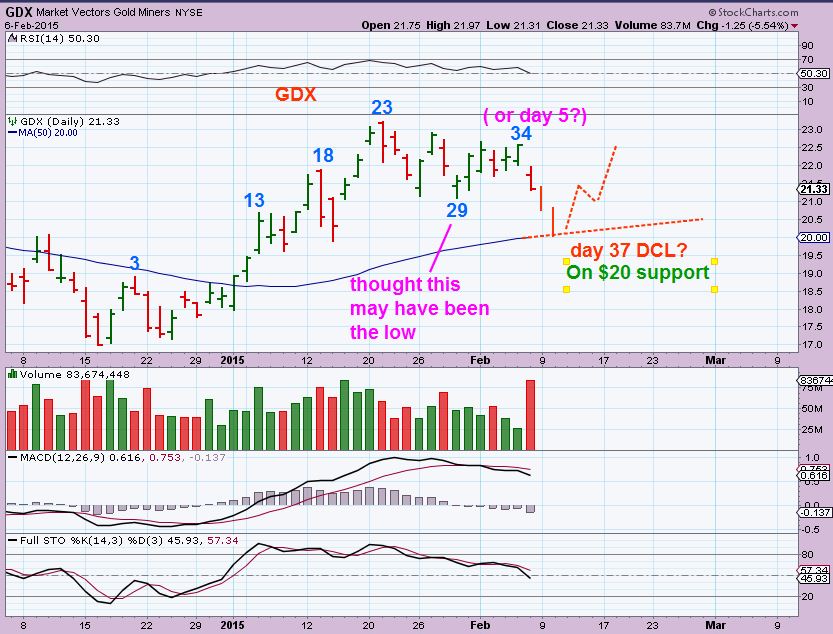
We really need more time to see clearly how the GOLD/SILVER /MINERS area is going to play out. I got quite a few emails asking , “Are you buying this dip ?” Friday. Not Yet, There was no reversal on a daily chart and the intraday reversal looked too weak & gave it up into the close. If it’s a 3rd daily cycle, they can be weak and tricky, I need to watch it a bit (And maybe even just stay away until JDST comes in to play if the 3rd dcycle rolls over) . If you use cycles, its difficult to tell if we are in a long 30 + day – 2nd daily cycle, or are we in the 3rd and it failed already. Personally , I think GOLD is looking for its Daily Cycle Low. Miners may be extended and also looking for a day 36 or 37?
How they play out in that 3rd daily cycle will say a lot. New Bull run or another Bear Mkt Rally. Now that the equity mkts have consolidated and are starting to look a little more bullish, are Metals and Miners starting to roll over? The $CRB, and Energy look pretty good right now, I will mostly be trading that area until things get a bit clearer. Solar, Uranium, Rare Earth, Steel, stocks, etc are look interesting too. I am watching those.


Alex, all charts are missing after AMZN on this post FYI . Great info tho, TKS 😉
Thats odd, I refreshed after posting to proof read and they were all there for me. Sometimes I think when the alert goes out , if many people try to read the report at once, the heavy traffic may keep the charts from loading immediately? Its the only thing that I can think of.
Glad they’re there for you now.
Yes, I beilive you are correct as I loaded immediately after you posted. Thanks. I’m always quick on the trigger, that’s why I most times sell equities to EARLY a lot. 🙂
That did make me laugh a little ; )
Charts are all on now. Great!! Many thanks! 😉
Really nice, I appreciate your work, so nice… What “DCL” means?
Mike, DCL is Daily Cycle Low, its the lowest price in a daily cycle, usually about 30 days, give or take a few.
Yes, JMIKE,
I should repeat some of those terms meanings from time to time for newer readers.
When I am discussing cycles, Prices in an uptrend or downtrend swing from low to peak then down to a new low. From Low to low is a ‘daily cycle’ & they are roughly 1 month, can be 27 days can be 30+ days. too, You’ll know when price bounces or rallies upward.
I will draw you a chart
Alex… the chart above helps me a lot.
You teach me (us) excellent.
Thanks, so as always.
Ur welcome Geurt : )
Thanks for the answer…
Alex, great update. Market indexes rolled over Fri at the top od channel, should be interesting. Do or die time for gold. I was watching 34 week avg as my line which broke at 1245. Had thought we were in 3rd cycle on miners, but see your analysis above making both cases. Was afraid it was going to roll over without last push to highs now. Looks like soon will be back into a ‘short the pops’ mentality. The bottom was a bit different had thought maybe was end of bear but now seems to be another BMR. Starting to rotate out of metals and into ‘laggard’ energy plays. Hope I am not too late to the party chasing at the end of the week.
I cant be sure yet if it was another Bear Mkt Rally or will we drive higher, but looks like it failed on the weekly.
As for Energy…If OIL holds up, you are not late. These energy plays look somewhat like MINERS set ups did in Dec ( double bottom, some popping out of bases). The best examples are DNR , OAS, etc. Its a “Base” and a run higher. JUST LIKE MINERS- they will pullback and run up and try to shake people off (And some will fail to launch, and some will lag). IF OIL has bottomed.
If OIL makes new lows, say $40, or $38? These may continue to base, but they didn’t keep dropping with oil through out January.
Thanks for reply. Gold/GDX move today may gave just been bear flag. May drop rest of short-term positions if we get pummeled tomorrow. Silver and juniors led which is good, but volume pretty paltry as you stated above.
EXXI? Whats with EXXI this morning. Everything else looking strong in Energy!
EXXI had earnings and they sold the news, but use a chart and look at the 10 sma & the 50sma.
It needed to rest a bit , and the chart is still a good set up at this point.
Alex, thanks for your thoughts on SFY, That was quite timely. Any thoughts on NADL or GDP or do you like the other enery names listed above better?
I recommended NADL & GDP last week. Did you miss that? I thought it was in my report, was it only in the comments?
I loaded up on NADL at $1.60 and posted a few charts, these were 2 of them. I have owned GDP for a while too, I recommended as Lagging energy stocks. I also bought WRES today as a lagger with the right set up.
.
I focused on SFY, didn’t buy any NADL. : (
Great recommendations by the way!
SFY looks good , its heading for the 50sma , and when they break above it attracts more buyers. See REXX , NOG & OAS (And NADL)
I hate entering “late’, but I did add to my NADL at the open, when the volume was high in the first 10 minutes , because with short covering & buying….That chart above has me thinking iNADL could even double from $2.
I also bought WRES as a lagger , just now getting going. Good volume already.
Alex, bought energy laggards last week (GDP, BAS) – in general if we get a pullback (a sensible one), would you look to add? My positions are still relatively light but many of those have run for quite a few days! BAS well above 50, GDP halfway btw 20 and 50 with LOTS of room in either direction. Might make a good topic for tomorrow!
Bought 1000 @ 1.75 sold them @ 2.15 !!!
Thanks by Alex….. Now to see when to get in again after a consolidation????
Great call on some energy stocks….I was able to pick up some nadl,sfy,yge last week….thanks
Excellent! Very glad to hear that Harry.
Some of these energy stocks are up a lot and yet the charts dont even look it. They look like they have more to go, though there will be pull backs along the way.
. Like REXX bull-flag under the 50sma, looks set to break out today for another leg up.
Hey Alex,
I too want to thank you for focusing on energy. I do have a core of energy stocks I am holding. (EXXI, SFY, NADL etc.
Although I played it a little bit differently last week……instead of adding to my core stock positions I focused on Oil itself via USO and purchased Calls at last Wednesdays pull back . at around the 61.8% Fib Level (High = 20.29 Low = 16.30) and near the 20 and 9 SMA’s it was/is defenseable IMO at the lows at 16.30. So far so good but I do not want get too greedy here……possible A B C wave 4 up ?
Hey Ken, Nice- Sounds like that core has been working for you so far : )
Many are doing the A-B-C type moves , but SOME (like REXX) seem to pause at that 50sma for a day or two – others burst right through.
Just to let you know USO is at the 50, but could just drive right through .(See OAS and PKD)
If we do bust through the 50 dma is a 38% wave 4 retracement a target on Oil ?, which would put it at around $68 per barrel ? Seems a stretch to me as I type IMHO.
I know, I had that chart in my report to show the 38% target, but seems like a lot to me too. I would say it would be more likely to bounce around for a bit not that high & then maybe a truncated 5th wave / Double bottom type lows. Then a run to that 38% area .
Actually really hard to tell at this point in time, just a guess.
Dang! Is (was) that dog trainer smiling?
On your POG chart above is the 50ma grounds for your test? and how (early) did you notice that the 10 day(pog) flag pre-empted a test?
Thanks as always. been engaging oil for a week, but ‘sense’ a dead cat bounce as the world may still have a glut of production, even at $50/bl
Hey Beek,
first question: The 50 sma got tested and that is normal & expected, but the “Test” on the chart is from a break out above the down trend line in Gold back in early January. Those usually get tested, but it could get tested at the next ICL , maybe at the end of a 4th daily cycle. ..one never knows when exactly.
Second question: I dont quite understand what you are asking, but I will try. You wrote (POG) so we are still talkking about the Price Of Gold. How early did I notice the 10 day flag? pre-empted a test? As soon as Gold broke out above the downtrend line , I thought we’d get a test someday . As soon as Gold broke above the 200sma, I thought it would get tested at some point. As soon as Gold broke above the 50sma, I thought it’d get tested….Just never know when in the stream of time it will occur. Sometimes the same week, other times its 2 daily cycle lows later.
Energy has been very good to me for the past days : )
I’m not liking the action in miners, I lightened up on my positions…..I’ll wait for a move above the 10ma before I add more
I agree Harry.
I have pointed out that I dont like the volume on the bounces when compared to the volume on the drops.
Some individual miners look ok, but GDX GDXJ I dont like. (CDE, PZG, NG, is a different story at highs, but HMY is what I am expecting to happen to those, so I am now out of everything Miners and mainly into Energy : )
For anyone else reading this…..since I sold my miners, it’s probably a good time for others to buy…..I’ve not had much luck with miners the last couple months…..If you do the opposite of what I do, you’ll probably make money
Energy Sector rocking. Alex was right on!
Harry, you are not the only one. I feel the same way! I still have SAND but it’s really struggled compared to peers. Have a light GDX position from Friday. If today turns out to be a bear flag with another slide Tomorrow or Wed I’ll just get out. I was hoping for 3rd cycle to include a poke to New highs, even a transient one. But that hope seems less and less reasonable each day.
Alex, you watching Uranium Sector? Looks like UEC and URA are starting up. Too early?
Both were rejected by the 50sma so far, and i was watching URZ. I dont like the 3 runs higher on lighter volume each time. Interest should be gaining and shorts should be covering, I am not seeing enough of that to be very interested right now.