After any extreme sell off takes place and people finish discussing all the reasons why there can be no recovery, it’s often a good time to go shopping. Why? When it gets overdone, the bargains can be great %-Wise. Recently while OIL & NATGAS sold off beyond expectations , I noticed that the equities stopped selling off and began building constructive bases. Temporary bottoms or permanent? Its too early to say for sure , but trade-able? Most certainly.
Here at Chartfreak, we have been buying & trading them for weeks now. I want to share some of the charts and ideas that we are again looking at , since I am expecting another leg higher.
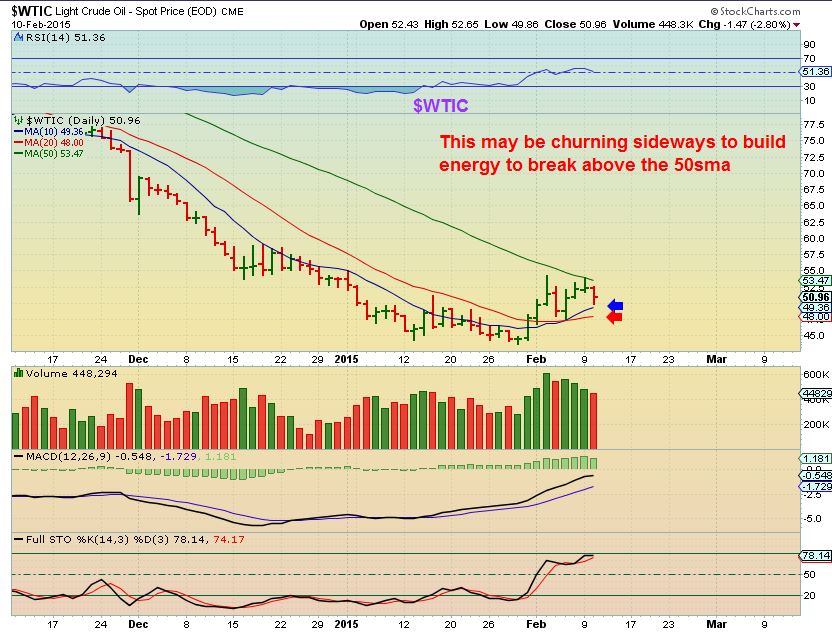
OIL Feb 10- Some said “Bear flag” We had been trading energy stocks , and I saw signs that OIL wanted to go higher.
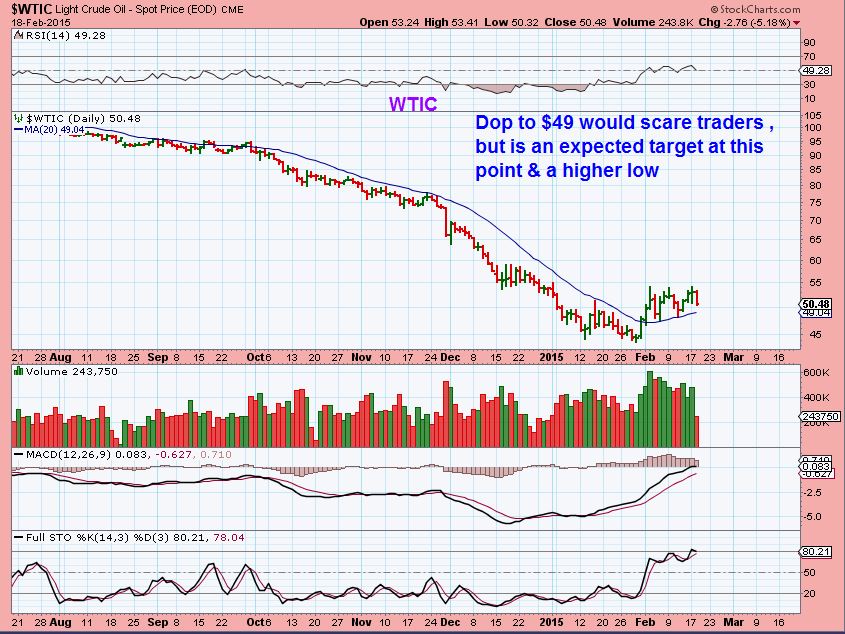
Feb 18 – consolidation/ base building. I posted this chart , I wanted a drop to $49 actually…
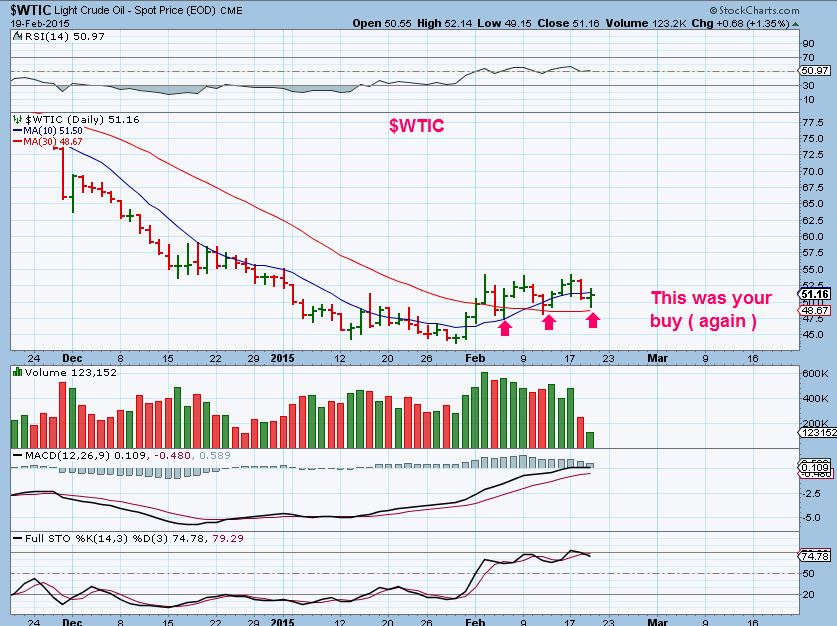
FEB 19 – the drop happened and reversed above the 20sma
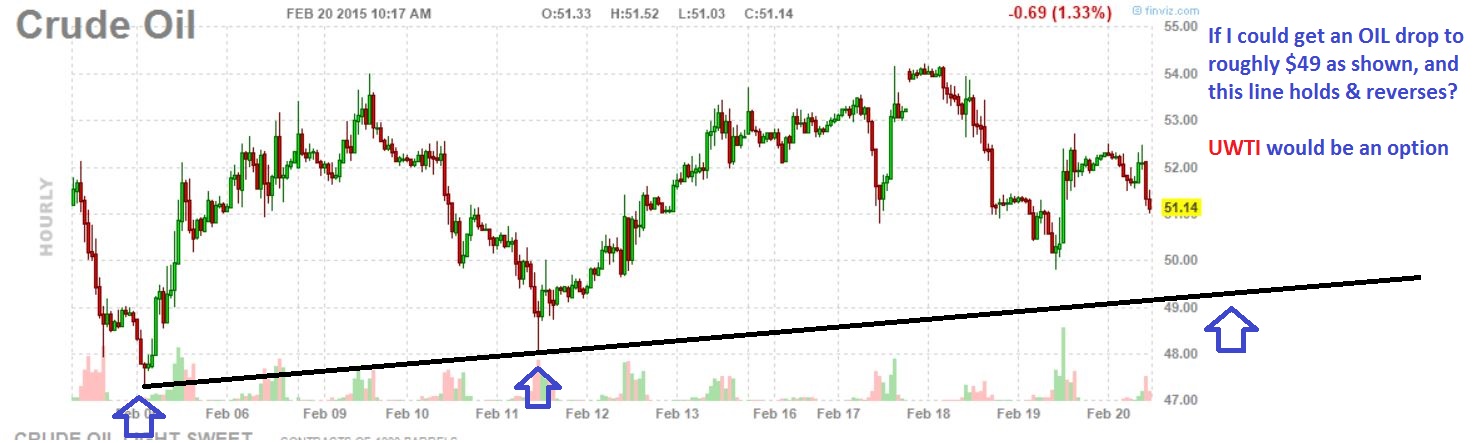
Currently OIL is down, while Many energy stocks are green. If we drop a bit more, for EXPERIENCED TRADERS , UWTI, UCO, USO are options as I watch this chart .
Last week I said that I wanted to see NATGAS hold here, above the 10sma.
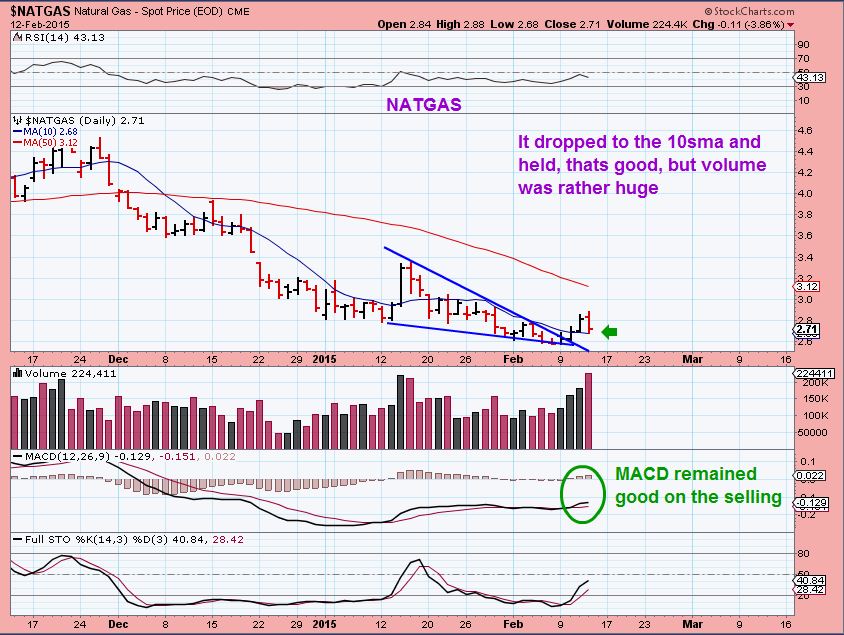
NATGAS is bottoming In My Opinion. A small base formed. I mentioned buying UGAZ & GASL , etc (for experienced traders only)
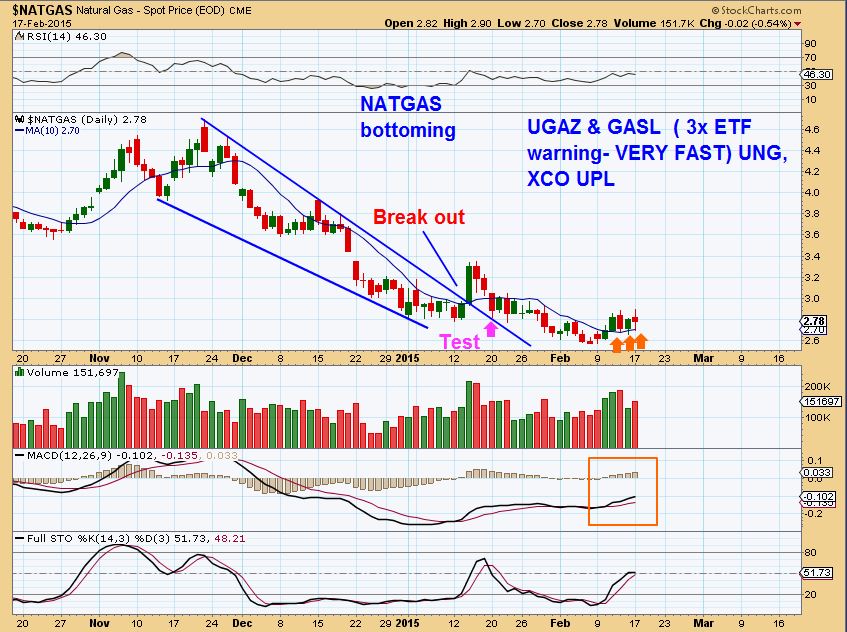
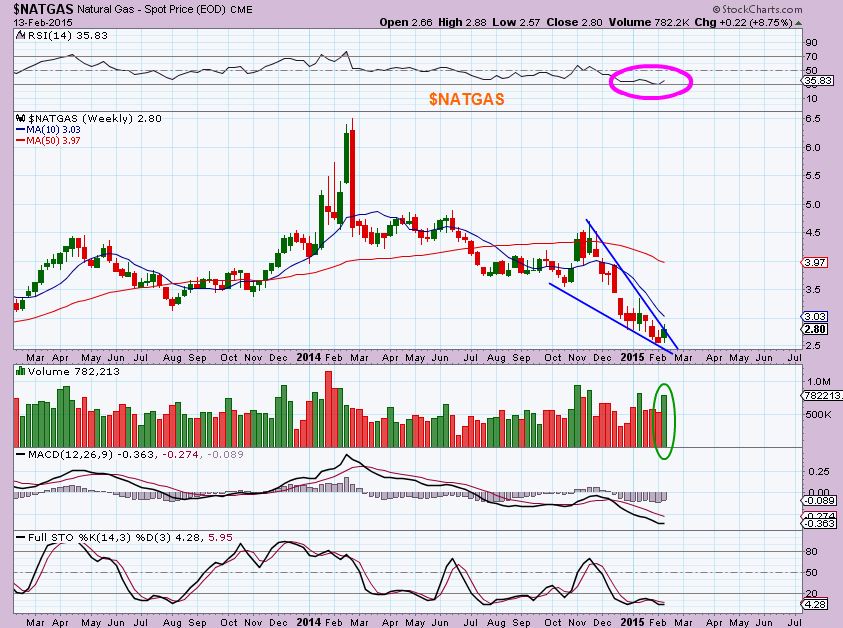
NATGAS WEEKLY– I posted this from last week. It broke out today
Let me share some trade ideas we were looking at in stocks.
GDP FEB 3- originally purchased much lower, under $3.
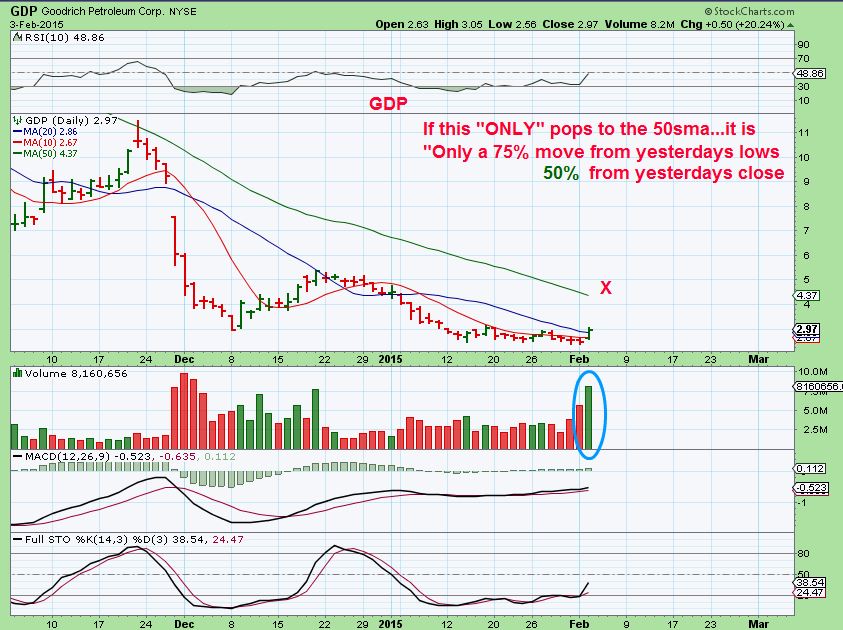
GDP – Bought again right on the 50sma (Seems crazy $2.35 to $9, but who knows? Traders can raise stops and take some off when extended)
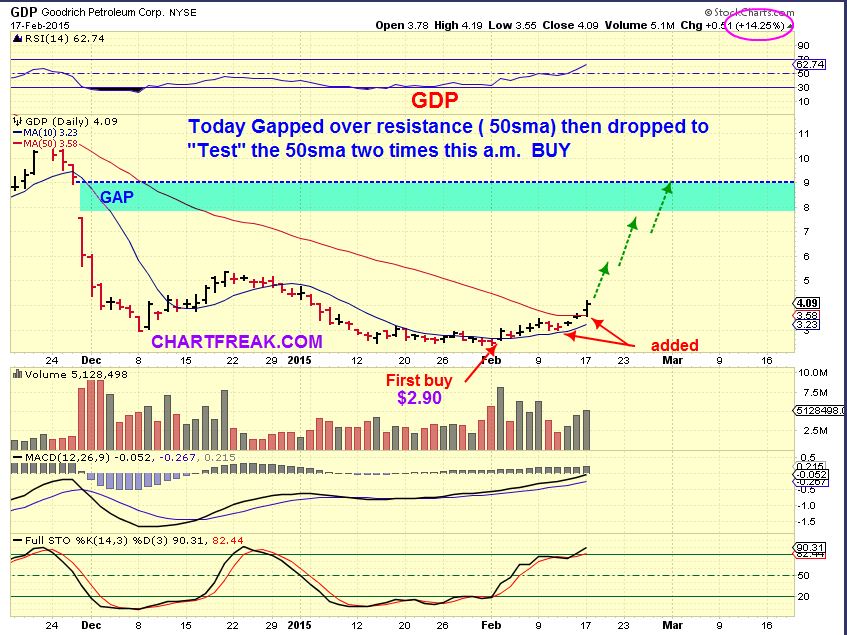
MINI – LESSON : I want to point out something else in ENERGY. When you see the above GDP chart , you see
1. A strong GAP DOWN in Dec.
2. Then it builds a “BASE”
3. Then proceeds higher.
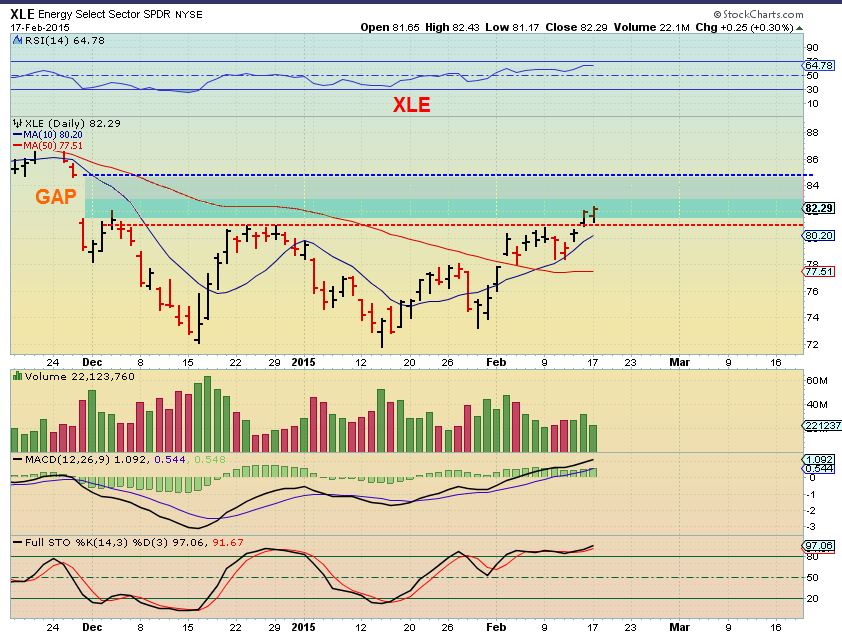
Look at XLE – also note “breaks above the 50sma , tags it, goes higher” .
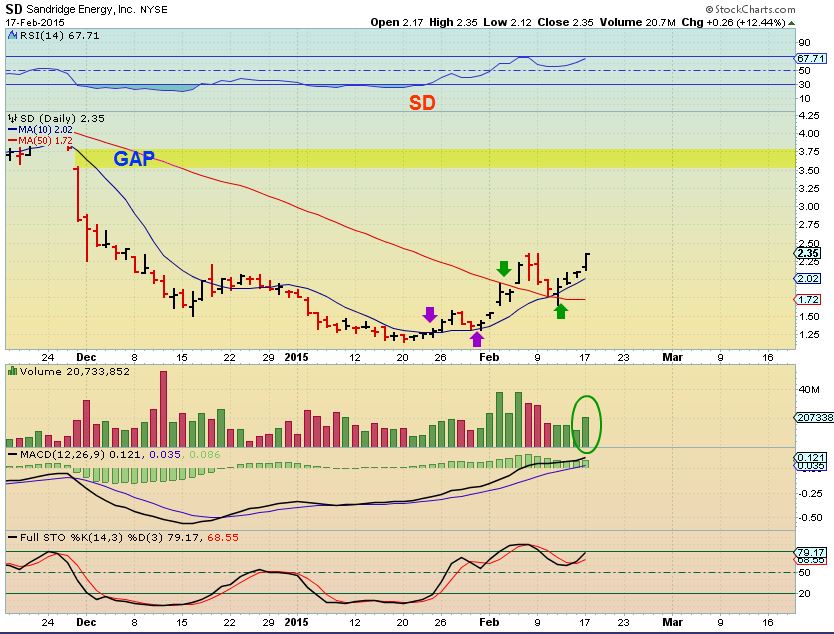
Are other energy stocks doing this? YES, some of the leaders like BASS, REXX, SD, EXXI , etc etc are, so you can add at the test of the 50sma.
SD … (ran from $1.13 to $2.35 and no one hardly noticed) Then it did exactly as mentioned above – break the 50sma, test it, go higher.The next buy was $1.72 area.
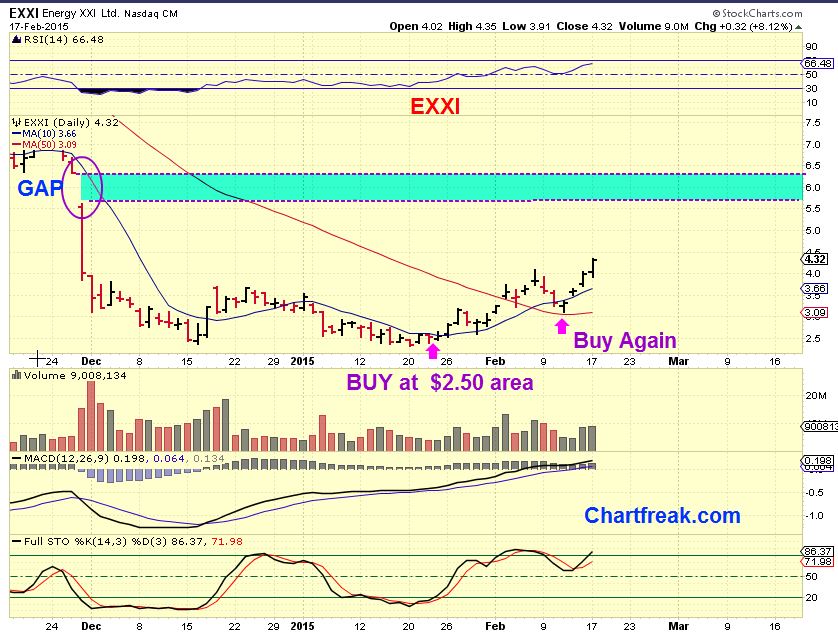
Bought EXXI at the lows ( $2.50) when I saw this “Base” setting up JAN 23. Now over $4.30 today
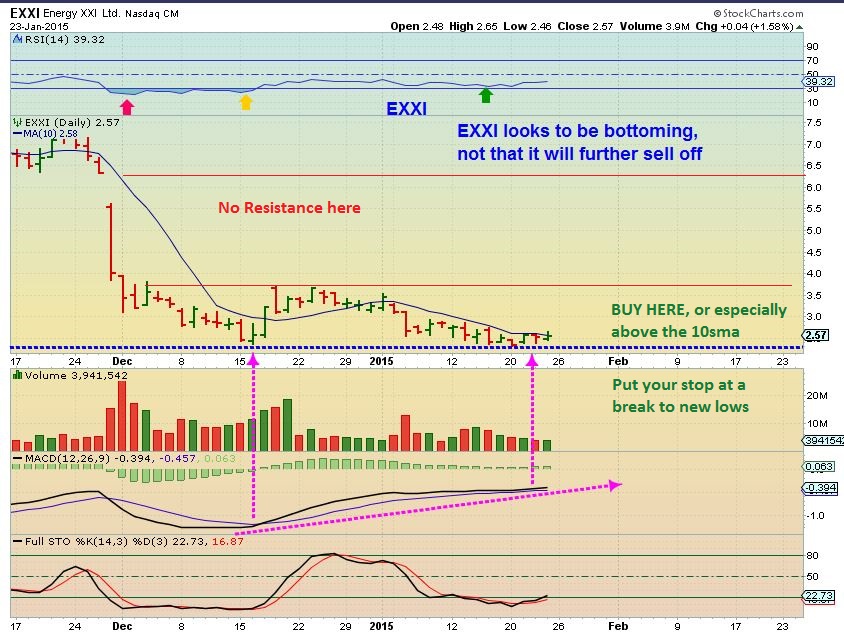
EXXI – Breaks the 50sma, tags it, moves higher. That was the 2nd buy, and now it’s over $4.00.
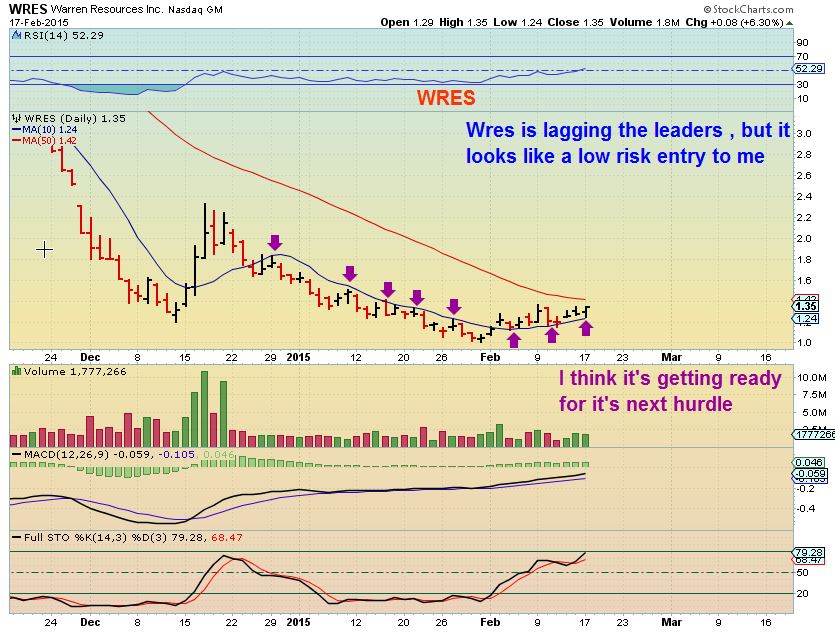
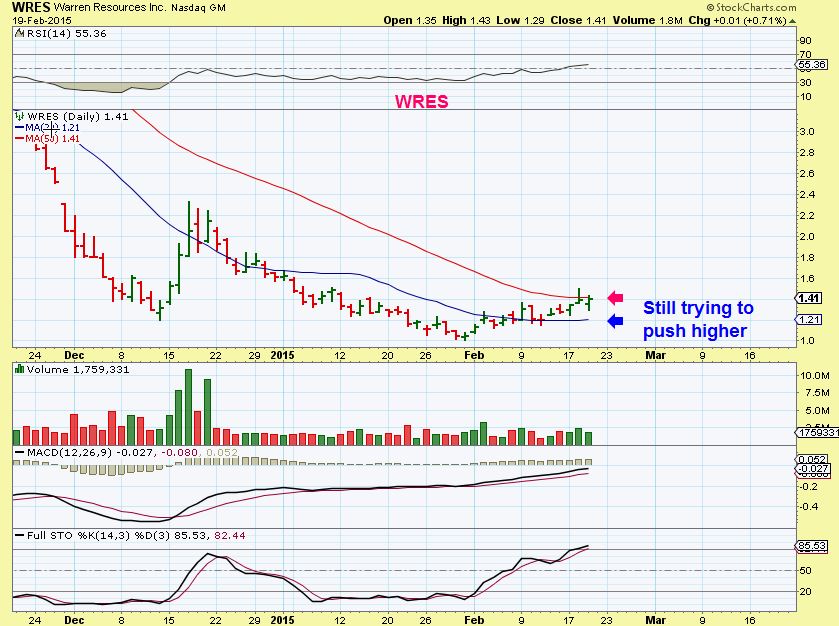
I pointed out WRES as a ‘lagger’ . Will it fly? I cant know for sure, but this set up is much like the others used to be and that is all that I can go by. This looks ready to try to break out soon too.
Using that above line of thinking , Bases, moving averages being tested, pullbacks to support, etc – I want to now show you some nice set ups in ENERGY. Some low priced, others average. Can they fail? Yes, earnings has come out on some, but others still have earnings next week. Remain alert.
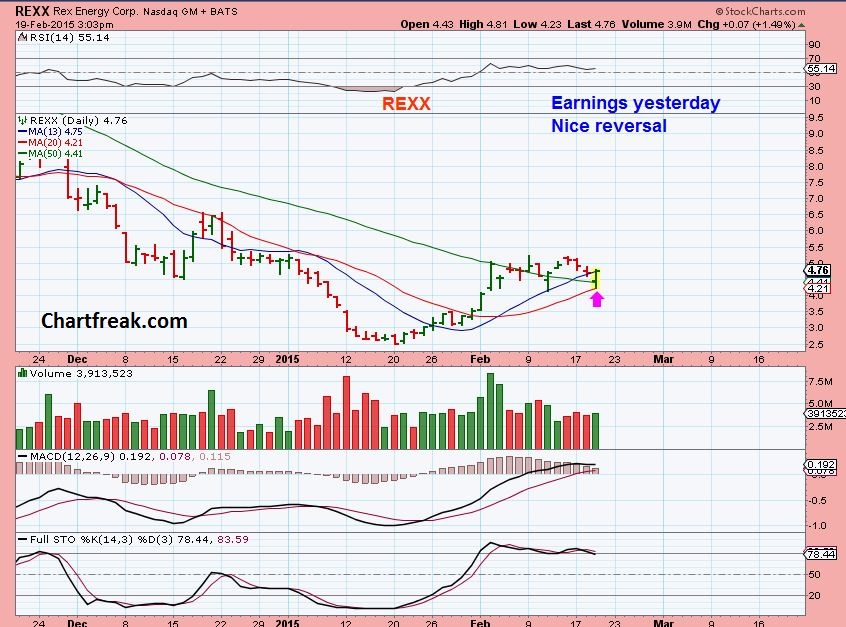
I bought REXX yesterday . It is still a buy in my opinion, especially since earnings was released already.
BUY WRES above the 50sma, or here with a stop below
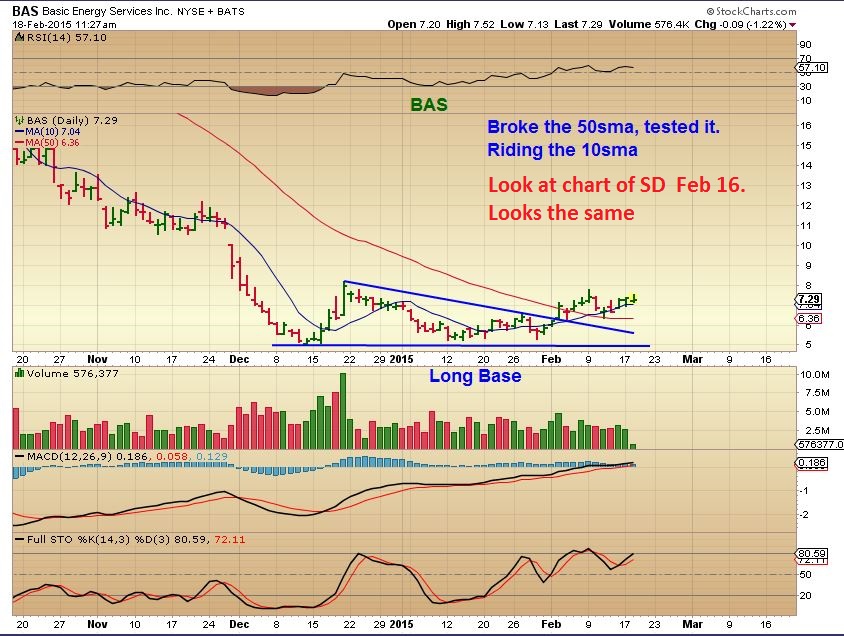
BAS chart is FEB 18 – It is consolidating sideways. Earnings came out yesterday. No POP, a bit of a drop, down a bit today. It may drop to the 50sma? It is a buy there if it does so on light volume & Energy is still acting correctly.
So thats just a few ideas of what we have been watching in the Energy Sector. Some are best traded in and out as they pop higher, others have been buy & hold. I admit that some of these stocks dont look like they’ve moved much, but look closely and you see that some have doubled while OIL has just gone sideways at its lows. They may have plenty more upside if OIL breaks from its current base. Another strategy that I personally employ is to buy these bases when they are at the lows ( When I see identifying marks that show they are ready to break out). Then I sell 1/2 of my positions as they rise up & just trade the rest of the moves, as mentioned. Watch for them to test the 50sma when they get overbought and extended, and so on. I hope you enjoyed reading this report. If you like what you see here, we offer 1 month , quarterly, and yrly subscription service for the premium reports. If you cant subscribe at this time, you can also sign up for free email alerts to let you know when I post these public reports . Thanks for being here and have a great weekend!
~Alex
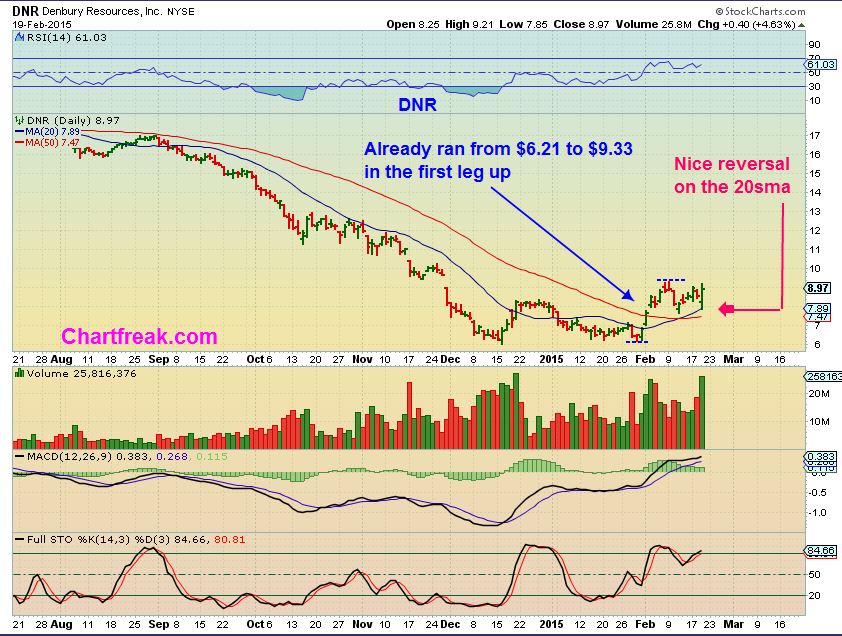
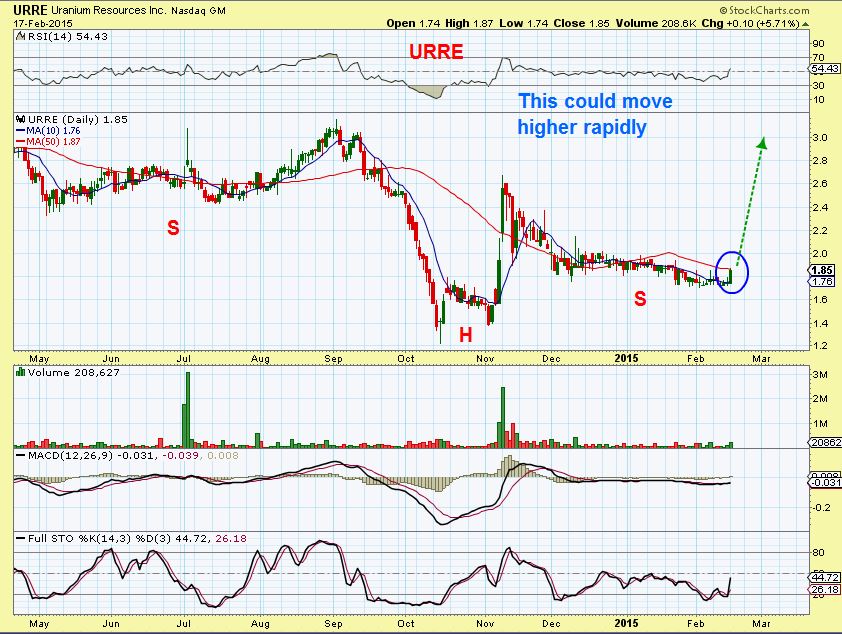
I also posted interesting looking Uranium stocks on Feb 17 – See also DNN , URZ, & UEC
URRE – popped Feb 17 and could be a huge base, however a safer buy is a pop above the 50sma
BOUNCING 
 Part 2 : More On These DOGS
Scroll to top

Alex,
Is there a chance you would tell us the trades you take personally and what stops you are looking for? I think it would be extremely beneficial to the site
Hi Knight,
Sorry, but not really. I dont know if you are aware of this, but I am a trader for a living? It is different for me than for the readers here., so I do show you where to buy , where to set a stop,etc , but I cant ‘real time’ tell you what I am buying , because I may be selling it an hr later. It takes time to see if the set up works.
As a trader, I trade real time & watch the action as it ‘plays out’ or ‘ fails’. I would have to post 20 alerts a day saying I bought this , and I sold that , I bought this 10 minutes ago, , I sold this , I bought this , and sold that. . And then I’d get normal questions like “I own it, why did you sell?” “Is it still safe?” “Why did you buy that? what are you looking for?” and so on and I would not have time to answer. .. That would frustrate many. I have to trade to earn a living, so sometimes I am in and out with a scalp, sometimes I enter and watch it for days..
What I am trying to teach you, is how to trade successfully. I do usually point out the sectors that are showing bullish set ups , maybe they formed good bases, or good set ups , And I do show were to buy & set your stops. I do clearly state what I look for going forward , and on the chart it says ” BUY at he 50sma. Place a stop below … or “BUY the pullback and look for support here, but a test of the 50sma.” IF THAT HAPPENS, like with GDP…I point that out and show SFY could do that. BASS could do that. etc
I hope you understood all of that : )
Thanks Alex! I love the educational piece as to me that’s more valuable than just throwing the food on my plate. Having said that, could you give some high level insight on how to screen areas to look for good buys? For example, while we’re trading energy, how should we set our screens up for the next areas? MACD, RSI, screens for basing price??<50dma? Thx.
Deshy….This is always a tough question for me, because it is experience that I use and not screening. I know this may seem hard to believe, but I dont do “screening” to find XXXX. I end up with too much to look at.
For me, I have a memory for charts & Tickers and I have been trading for so long in various sectors that I have written notebooks and taken notes over the past 13 years or so of how things acted and reacted out of lows, off of tops, after a run up when things base out ( Cup handle, inverse H&S, etc ) , and so on. I’m rather old school in many ways, just doing the work myself. It sticks in my brain better than running scans …I have become familiar with many good companies in each sector. Then I also search for new companies at times and watch the charts form as they progress. I usually avoid IPO’s,
Sorry, I know that doesnt help much.
Surely, you can crunch 13 years of work into a few good one liners for us newbies–everyone’s doing it.;-) Jj. Completely understand. Keep up the super work!
LOL..ok
1. I avoid I.P.O.’s because they have no chart. 🙂
2. I like William Niels books , but I break many of his rules
Thanks Alex. Explanation makes sense….
Knight,
Some have mentioned ” Why not drop covering the market and just pick “Gold” or just pick “OIL” or just pick “Solar” and then just list 3 buys if there are any currently. Would that idea help?
I like that idea and have thought of just a [ stockpicks list day] here and there , but I sometimes currently purposely leave out a sector in my normal report (like Natgas for example, if nothing changed) and others trading that sector wished I covered it.
Its a tough gig knowing what to leave in, what to leave out, but I have thought of doing that.
Alex any thoughts on mjna that looks to be bottoming to me
yes, but I need a pullback or sideways move before I’d buy it because it could pull back quite a bot from here. I have that in a list of BLDP, PLUG, FCEL, MNGA, ABAT, ULBI
awesome.. great ideas tx. hope you aren’t frozen solid. ;o) ps. im watching pxlw as well.. was waiting on the 50day.. do u not think it goes there maestro?
It may get there, but it already did break above that 50sma and tagged it. There is a trend-line that can be drawn from dec lows to jan lows tec…and that would put it there now…so its a tough call .
oh… yeah… 😡 .. if at first u dont succeed, read the directions ;o) lol sorry 2 bother u-at work&was going from memory.
Gold forming a narrow range day today. Possible cycle low if a swing occurs tomorrow. I also think it will only be a counter trend bounce good for 5-8 days before heading back down.
Energy is the place to be IMO also. Just a modest 38% Fibonacci retracement similar to golds first bear market rally would take oil back to $68ish.
http://stockcharts.com/h-sc/ui?s=$WTIC&p=D&yr=4&mn=6&dy=0&id=p42572392681&a=390269949&listNum=1
Did you copy that idea from me and put it in your report? : ) Maybe you dont remember that I posted this chart Feb 6
.
.
I didn’t remember you posting that one. I was comparing it to what gold did on it’s first big bear market bounce.
I actually posted that chart along with an intermediate trend line in my Feb. 3rd Weekend report.
Had you invested in anything from the lows ? Or still waiting to confirm with that trend line?
The move out of the lows is my specialty. If you wait for that trend-line break to get in, be cautious, , you may take a serious draw-down.
I was kind of joking, but the charts were almost exactly the same : )
It is quite a ride higher, and the Miners had some nice gains in that Bear Market bounce, so these oil / Energy runs could still have a ways to go. UCO USO buying calls etc for OIL could be great.
These steep sell offs, …Its like they give you just enough bullishness to suck everyone in, then drop back to a basing process. I would like to see a V-Bottom in OIL and the CRB myself, but I’m just going to try to follow it along.
Alex, good analysis, thanks! Pick one right now? YUME?
YUME was yesterdays buy, its getting a tad extended,. Where could you put your stop? I only have an initial target of just over $6 , and then it MIGHT pull back all the way to $5.50 area .
I like YNDX or DANG , because they are are just above their 50sma…your stop is a lot closer.
YNDX had earnings released this morning and gapped open over the 50sma ( gapped up $2) , but is closing the gap now. Watch it land on the 50sma (just did) . Thats the buy , stop if it breaks the 50sma
YNDX is a buy ( read the chart)
Hi Alex. Any thoughts on FCX? It tested 50sma yesterday but closed under. Broke above today on good volume so far.
Hi Conrad
FCX and TGB both look good ( they may pop above the 50sma for a day or to and then drop back and test it. I see this SO OFTEN, but I like them here ). You could buy a partial position and add if it drops. I did that on a lot of the energy when they broke the 50sma.
Hi Alex.
How is the charts SSL-T looking?
Thanks a lot for your excellent teaching, it looks you were some year a professor!
sorry, I cant find what it is.
It’s Sandstorm (SAND) TSX: (SSL)
Well, this is tough. I do not own any Miners right now, I wouldnt buy it here. .
Its breaking down below the 50sma (bad).
It has only pulled back 50 % from the entire move. (Good)
It s oversold , and could hold or bounce when the Dcycle low is in
It looks like a rounding top pattern ( often a top is in, but it can bounce).
Not sure if you own it & if so , where you entered , or looking to buy?
My stop would have been tripped , but it could reverse higher if we get the dcl. I would have already been out, not buying until it gets back above the 50sma.
If I was looking to buy, not until it gets above the 50sma.
forgot the chart
THANKS A LOT ALEX !!!
I bought it @ 4.40.
My question was HOLD or SELL ?????
hammering up on gold….see if it can hold. good volume okay volume on gdx
hammering up on gld…good volume…..does this look like a possible low area Alex….