After watching various sectors endure some prolonged sell-offs, we’ve been able to buy near the lows and make some decent gains %-Wise. This does raise a few questions. Are these THE lows? Are these sectors just bouncing from oversold conditions, only to continue lower later with a double bottom or even making lower lows? Lets start off by looking at some “lows”
This is our current chart of OIL
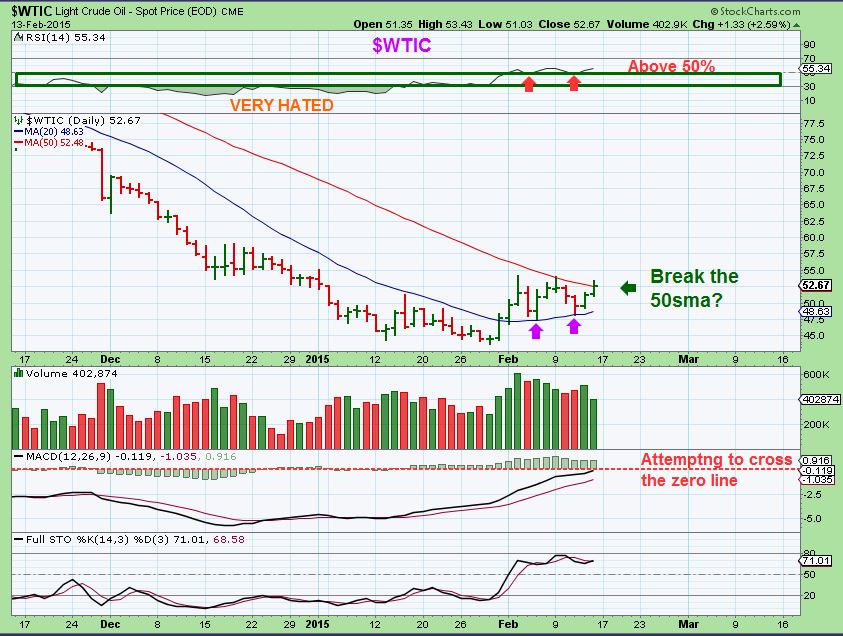
You see definite signs of improvement in this bounce, but I wanted to point something else out just to keep us alert…
In the above current chart of OIL you see an attempt to get above the 50sma after bouncing off of the 20sma as support. This is healthy. Then you note that the RSI & MACD are both becoming more bullishly aligned too, and things look pretty good.
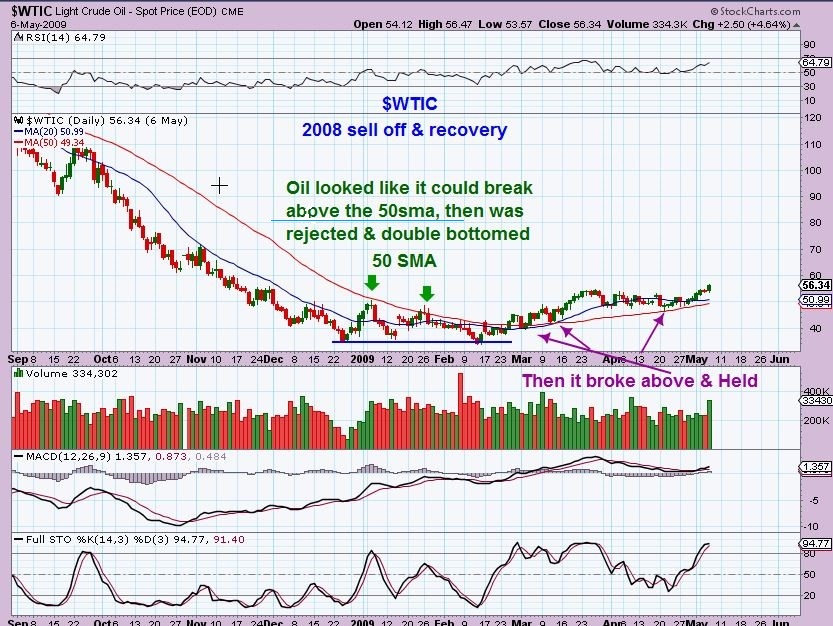
I decided to check out OIL at the 2008 lows after the steep sell off ended back then. In a way, it looks similar to where OIL is now right before it dropped and double bottomed, so I want to keep an eye on a couple of things. OIL 2008 had a period in Jan 2009 where it attempted to re-gain the 50sma and was above the 20sma too. OIL tried breaking above the 50sma ( green arrow) , but closed below it 2 times, it then weakened and double bottomed. I am watching OIL at the 50sma right now.
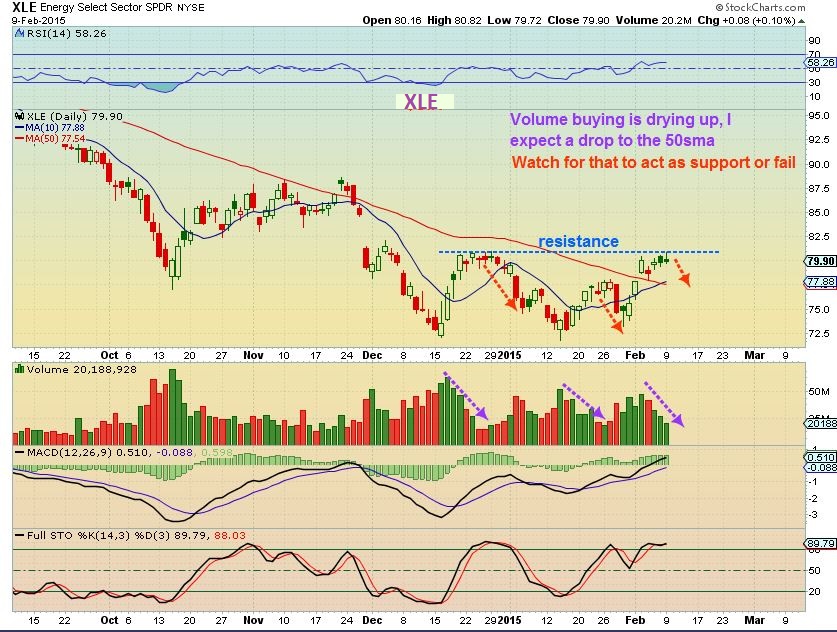
On Feb 9 ( Still discussing Energy ) I mentioned that the XLE looked to be struggling a bit at resistance, and I thought it may drop to the 50sma, as noted in this chart .
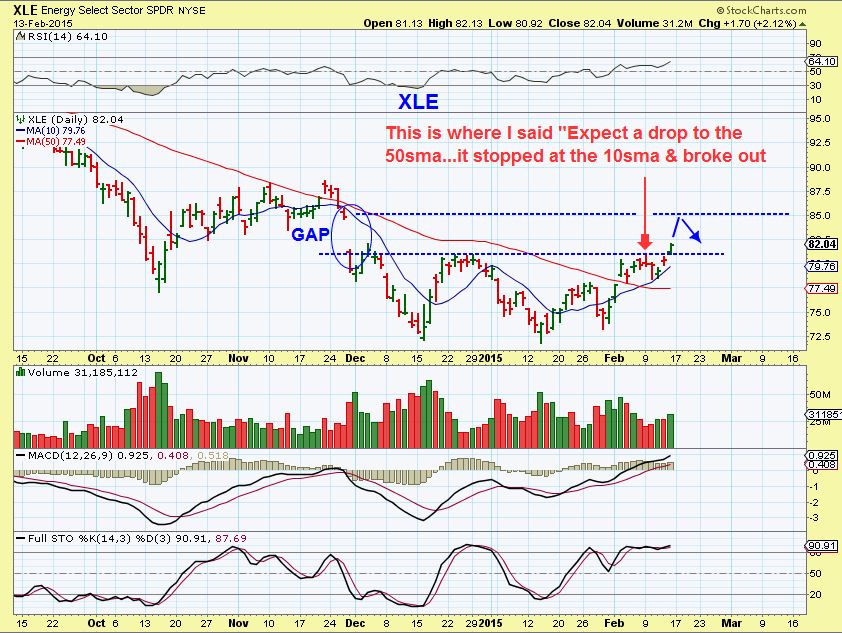
It did drop, but it did NOT need to drop to the 50sma. It found support higher on the 10sma and then broke above that resistance. There is a gap overhead and it may fill that gap next, so I did not sell my energy stocks going into the weekend. I still like the set ups that I am seeing.
NATGAS – After showing a break out in NATGAS and taking a position in UGAZ, UGAZ went from $2.41 to $3.17. I got in above those lows closer to $2.65 and thought we might test the break out after a negative report came out on Thursday, so I raised my stop to $3 and got stopped out. I posted this as a possible support ( 10sma) for anyone looking to enter or hold current positions.
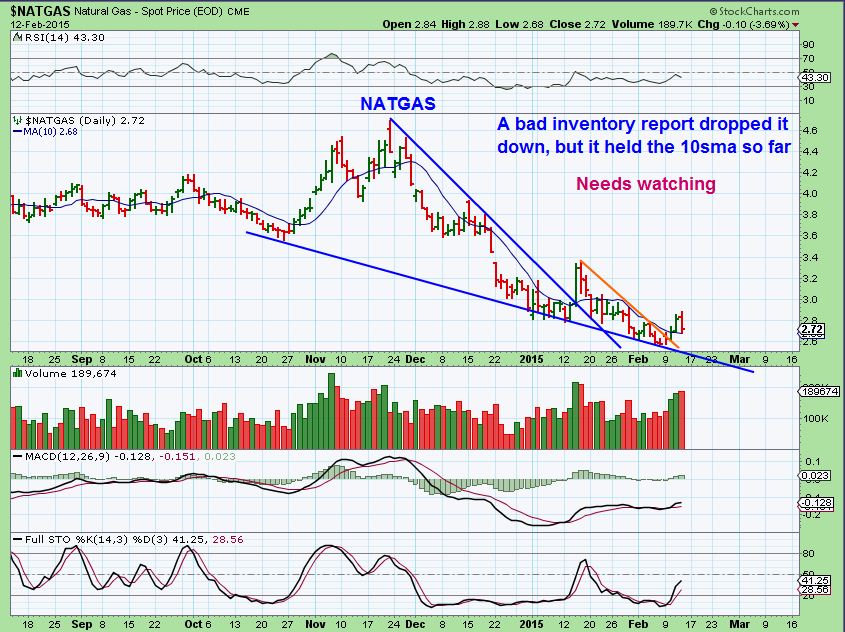
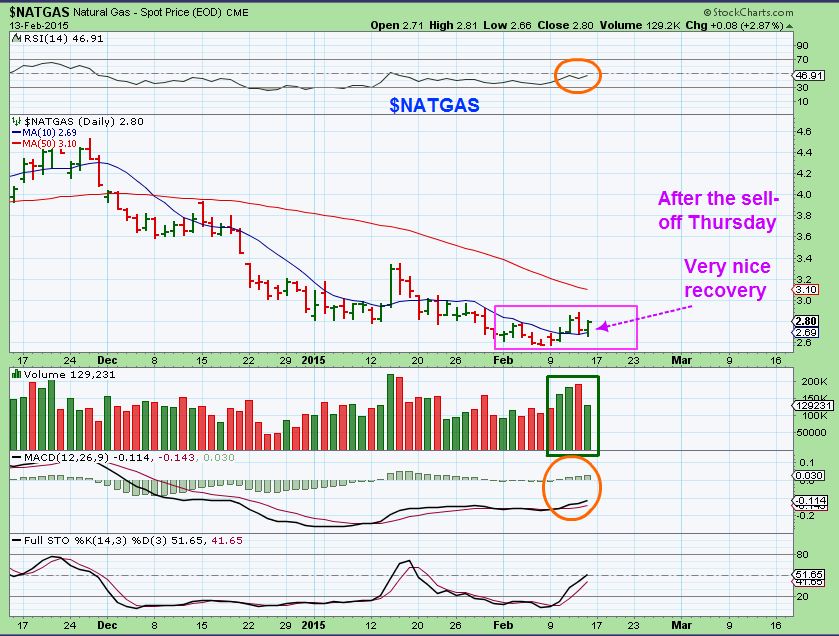
NATGAS the 10sma did hold on Friday and price reversed higher. THAT would be viewed as a low risk buy with a stop under the 10sma. The bad news didnt hurt it and the 10sma was re-gained. This could be bought.
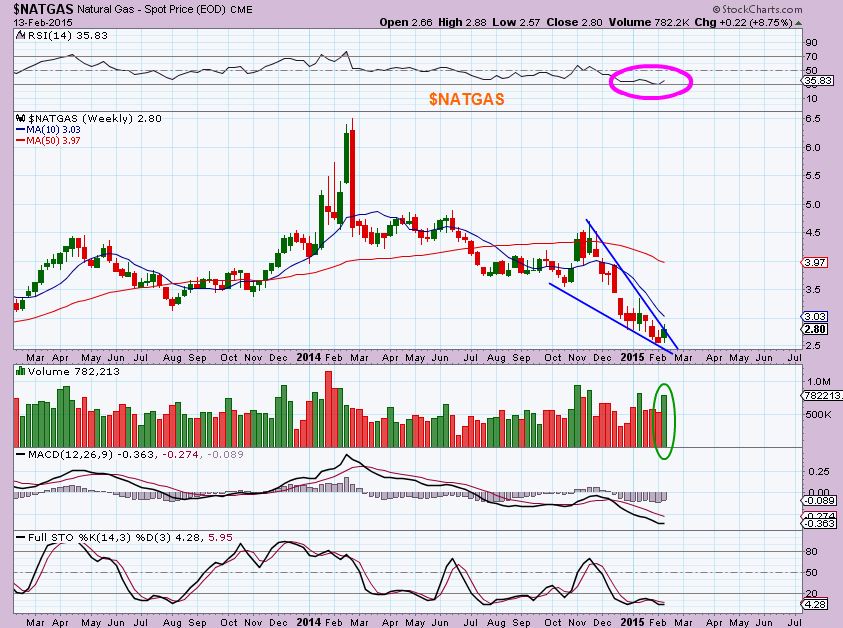
On a wkly, NATGAS is also looking to break out with volume
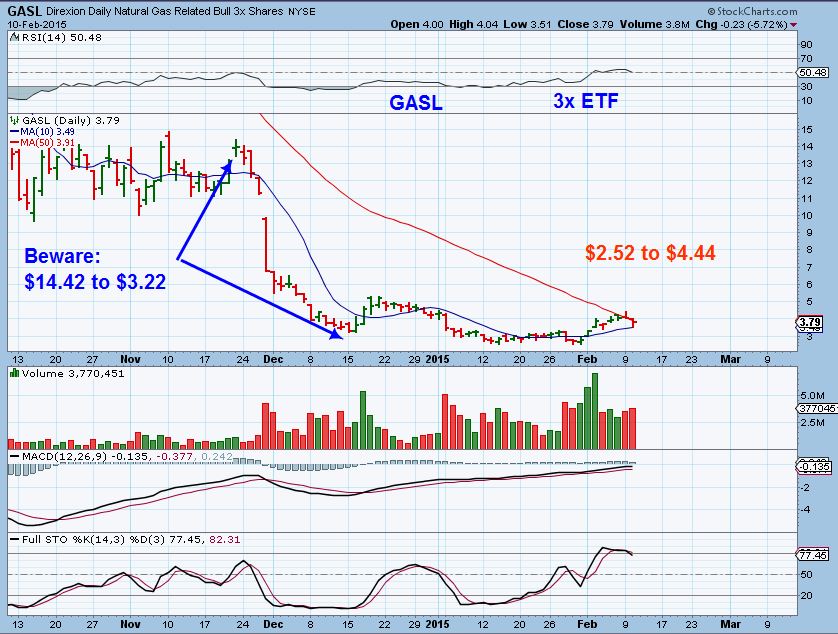
I also posted a chart of GASL struggling at the 50sma. ( 3x ETF – Dangerous – moves very fast in both directions). It broke out above the 50sma and is currently at $4.37 now.
The equity markets are trying to break out of their consolidation , and NASDAQ has made new highs. I posted this chart to show a price projection if the break out gets confirmation.
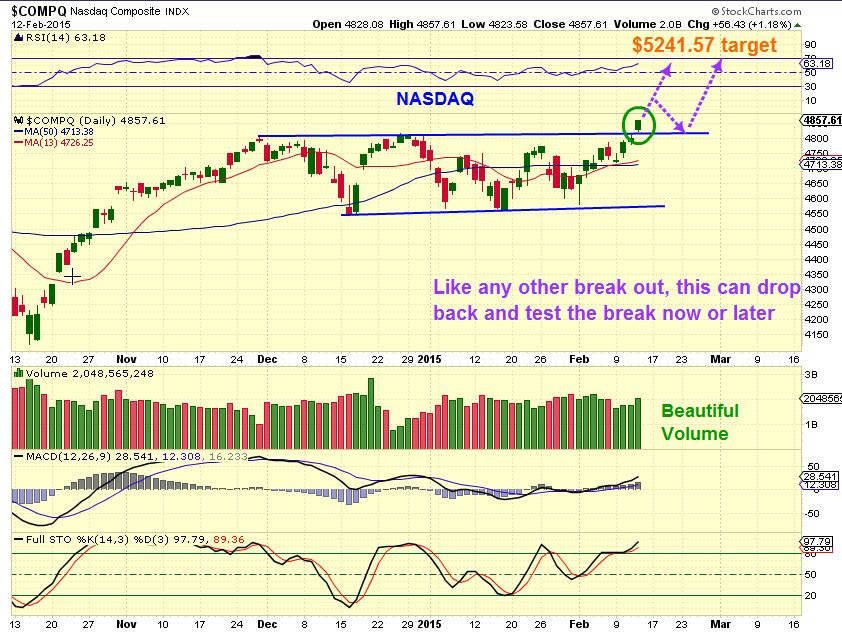
I know that Nasdaq 5241 seems like a lot, but it is only 700 points higher, and the NASDAQ did the same 700 pt move last Oct to Nov .
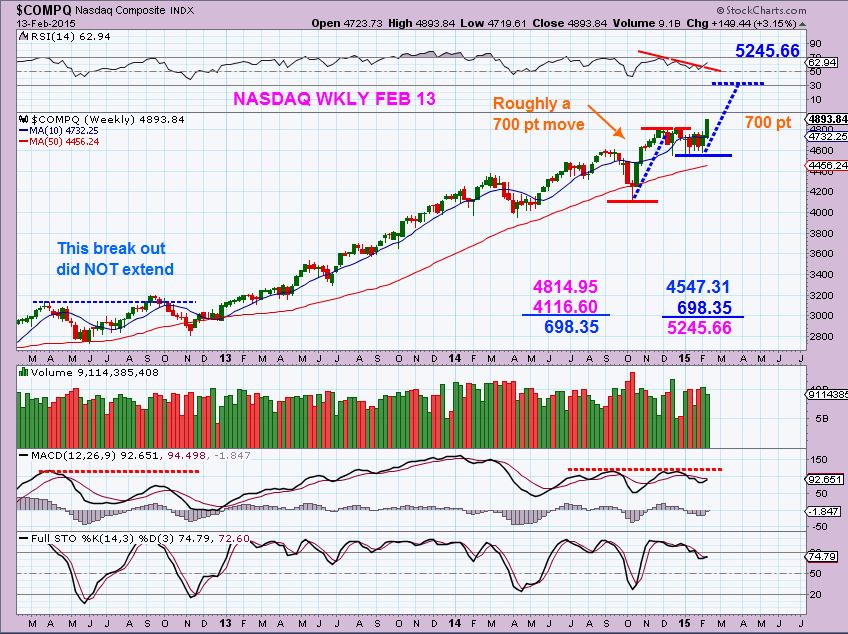
On the NASDAQ WKLY chart I got 5245 , still roughly 700 points higher from recent lows. The break out is not fully confirmed. Look at the break higher in 2012 on this chart/ It was a false break and dropped back down before resuming the strong uptrend. The current break out after a long sideways consolidation looks stronger.
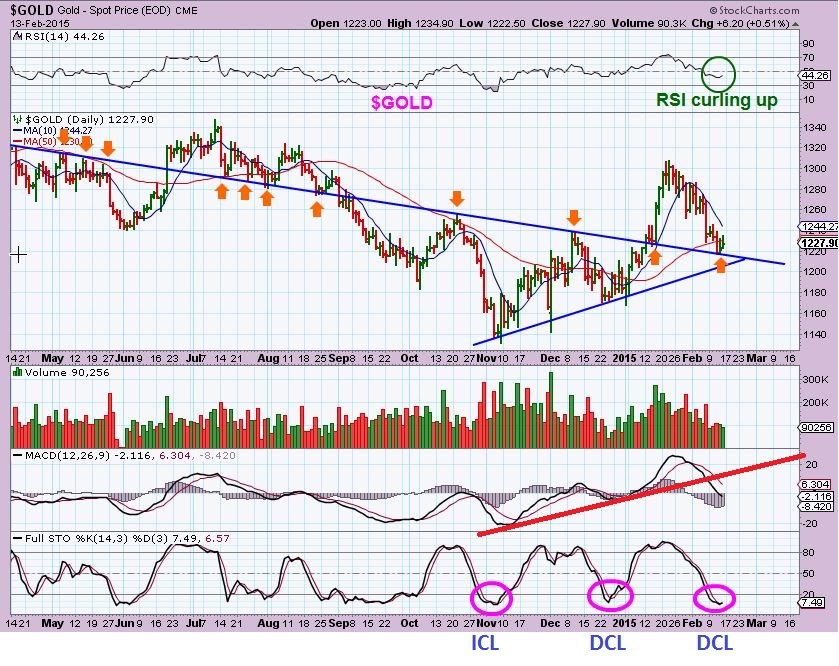
We are due for a LOW ( 3rd daily cycle) in Metals and Miners. When I called the lows for the 1st & 2nd daily cycles, I said that those were very strong trade-able lows for the Miners . Good money could be (And was ) made. Now I have mentioned that IF WE ARE STILL IN A BEAR MARKET RALLY type bounce out of the lows from November, then the 3rd daily cycle will be weak and roll over rather quickly. If we are not in ‘Bear Mkt Rally’ mode anymore, we could break to new highs after this sideways move, much like we did in 2008 coming out of that steep Gold sell off. It will take time to know , but caution is recommended.
A few things that I am watching in Metals / miners-
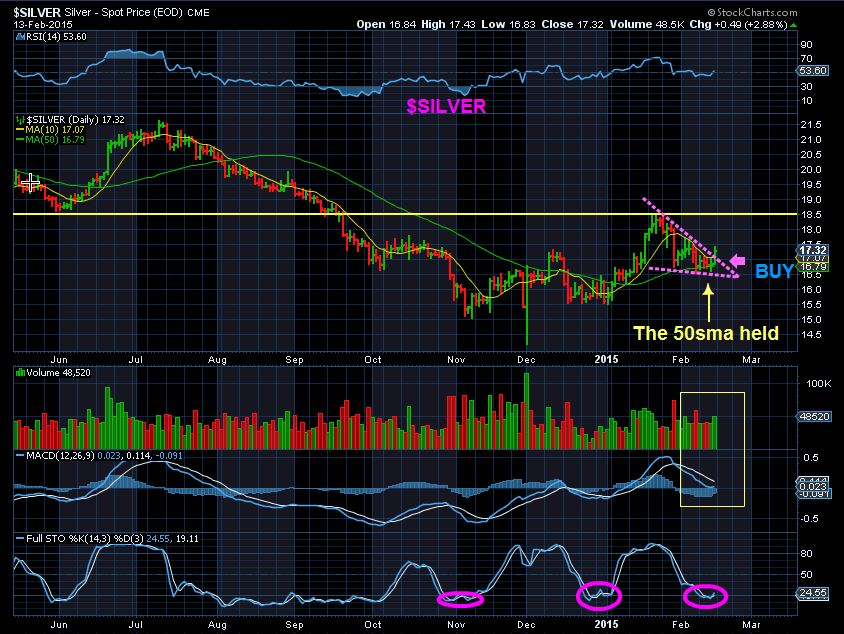
For one thing, I pointed out on FEB 3 that SILVER needs to re-gain JUNE 2013 lows Red arrow ( we havent yet). Pointed out the 50sma and wanted to see that hold during the drop. (Blue Arrow)
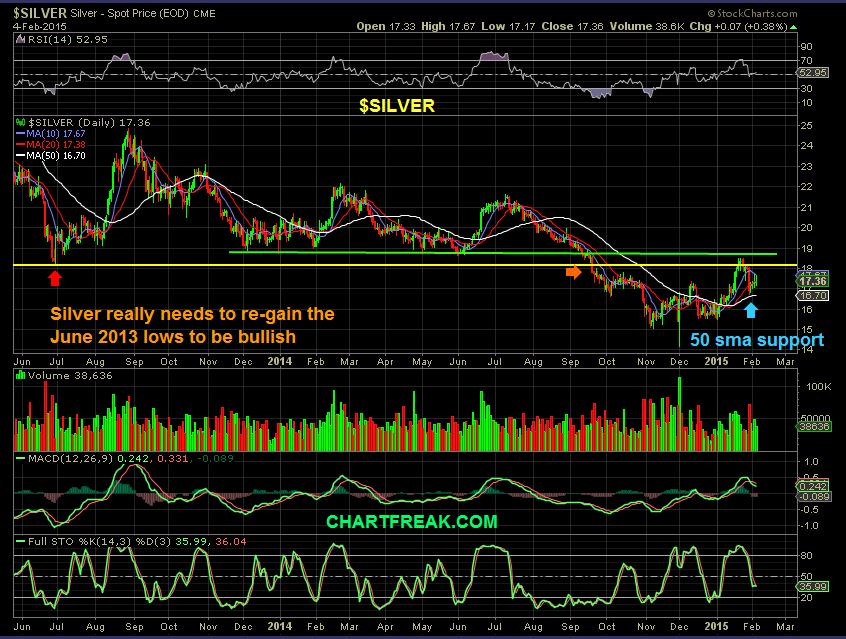
I Also said that if we break above this sloping trend line, it could be bought
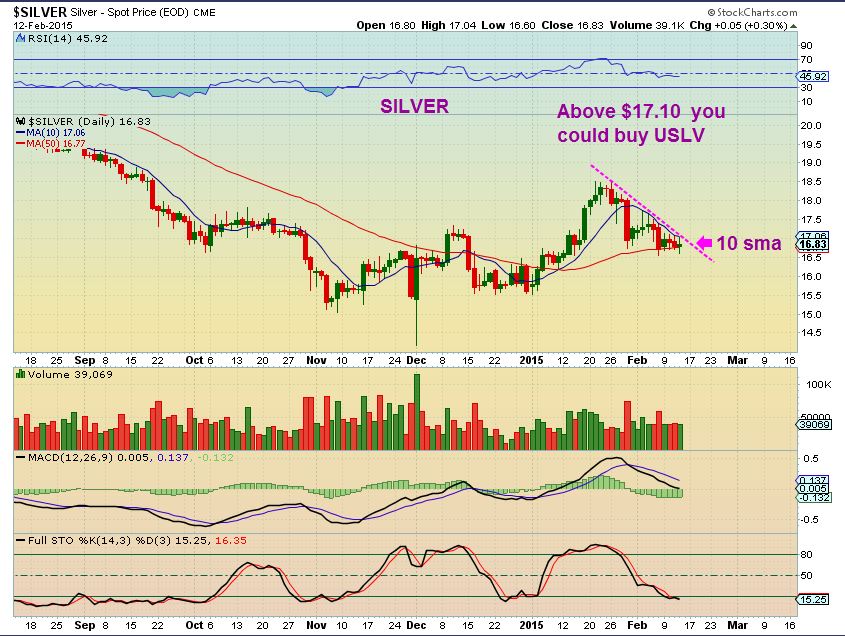
Silver did break out before Gold on Friday , and the 50sma did hold all week.
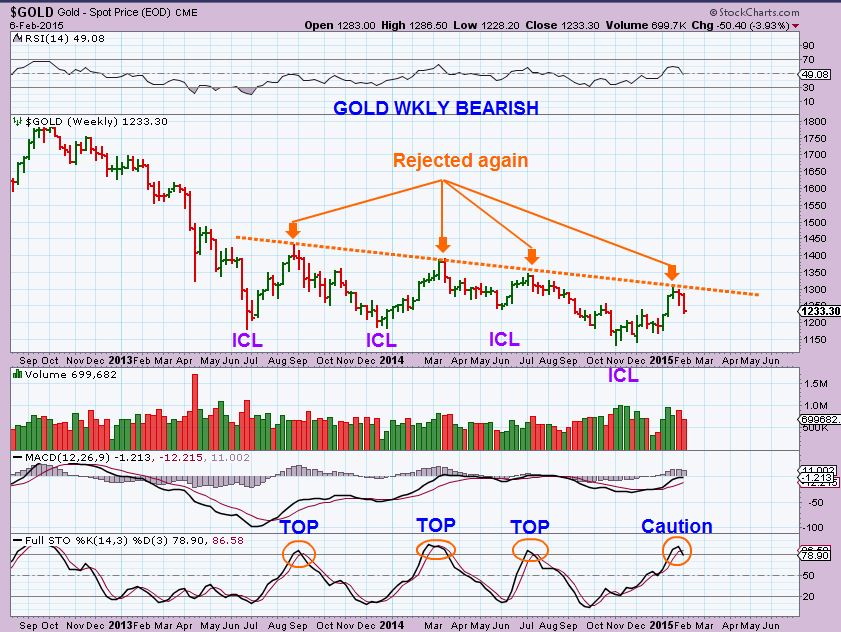
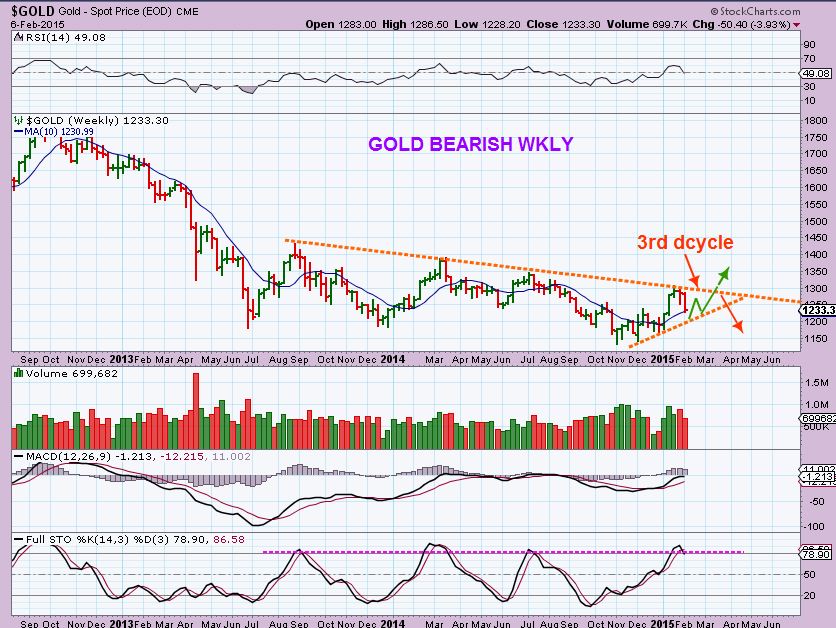
WEEKLY GOLD – Just a review, nothing has changed (Yet). 2 charts of my expectations for the 3rd daily cycle. Notice lower highs so far
FEB 11 I posted a possible bottom / support for Gold with this chart.
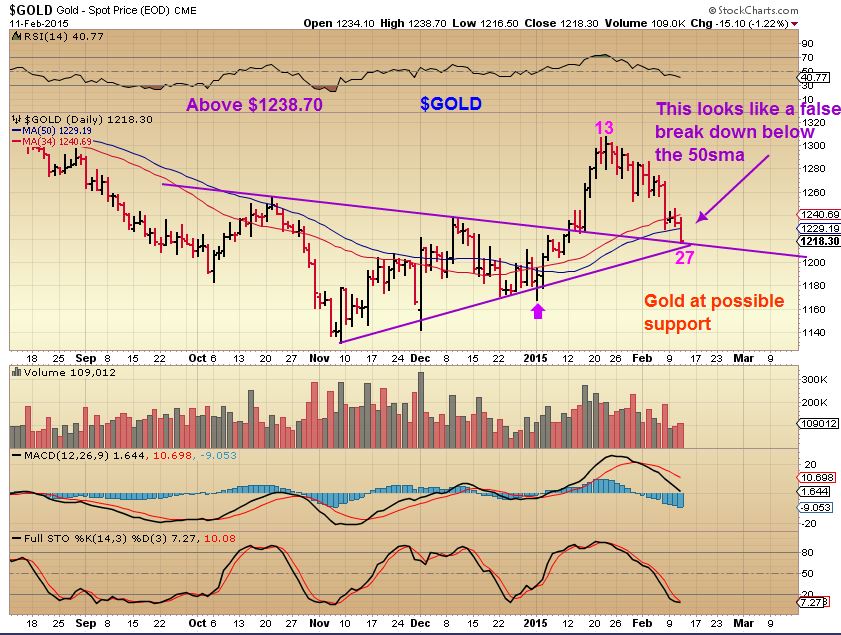
2 Days later, And again nothing has changed. With Silver break higher, I still may have the lows in place before a bounce higher.
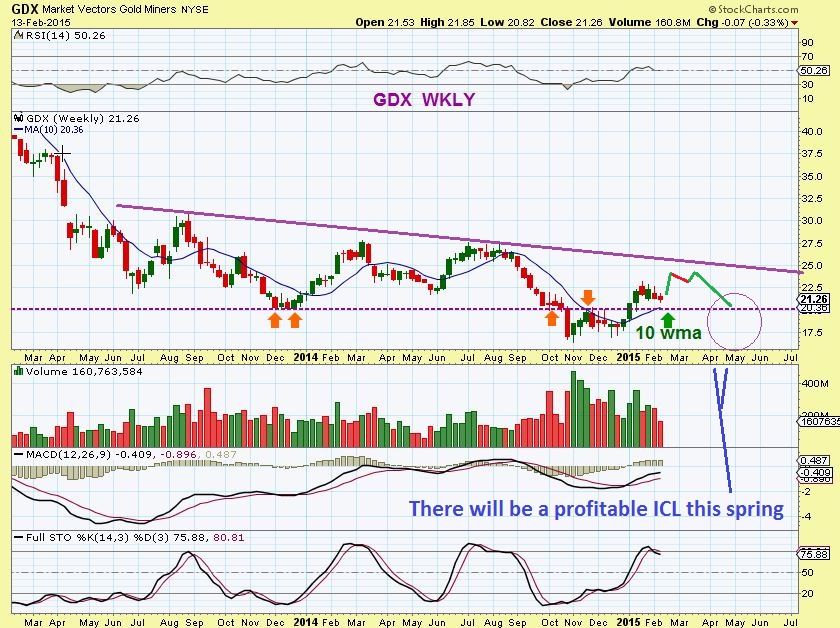
I am not expecting much of a bounce in Miners if we are just experiencing a bear market rally.
GDXWKLY – could tag the $25 area like this… The real buy will come later this spring. If we are not in a bear market rally , the $25 area may be broken after the recent consolidation.
This is a tough call, because some of the Miners are acting very strong at the end of a 2nd daily cycle. Look at CDE, PZG, NEM, GG, etc. They are holding up very well, so it will be interesting to see how this plays out. IF you are buying these lows, keep an eye on positions, raise stops, maybe lock in profits near GDX 25 and if it breaks higher, you could re-enter for another quick trade.
I have mentioned SOLAR STOCKS, ENERGY STOCKS as my main plays right now, but there are many other trades shaping up out there.
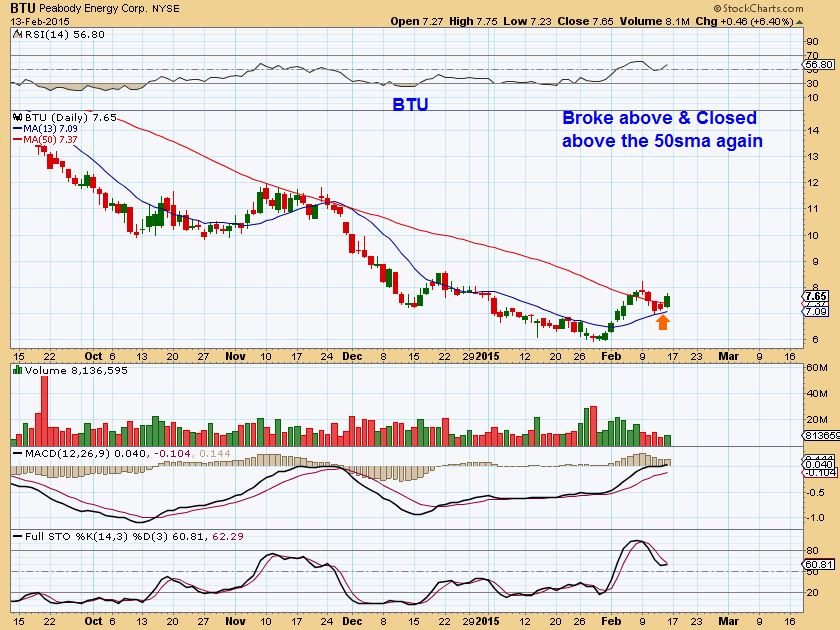
KOL ( COAL ETF) Looks about to break out, so I looked at several COAL STOCKS like ANR, ACI, WLT, BTU and BTU broke back above the 50sma Friday . This set up is bullish and the other coal stocks that I mentioned are moving sideways between those moving averages , likely to build steam to break above the 50sma too.
The markets are closed in the US. today, but I’ll be watching the Metals and NATGAS and OIL to see how things play out there. GOLD above $1238.70 puts a swing low in place and with SILVERS move higher Friday, I pretty much expect to see that very soon. I posted a free article under the blog tab on chartfreak.com about the 3d printer stocks perking up. https://www.chartfreak.com/3d-popping/ I am seeing other sectors line up too, so there should be some good trading opportunities for the traders here. I will just post some bullish charts in my next report. YUME looks very good , for example. WLT is at its pre-pop stage, most likely. Have a great day !
~ALEX
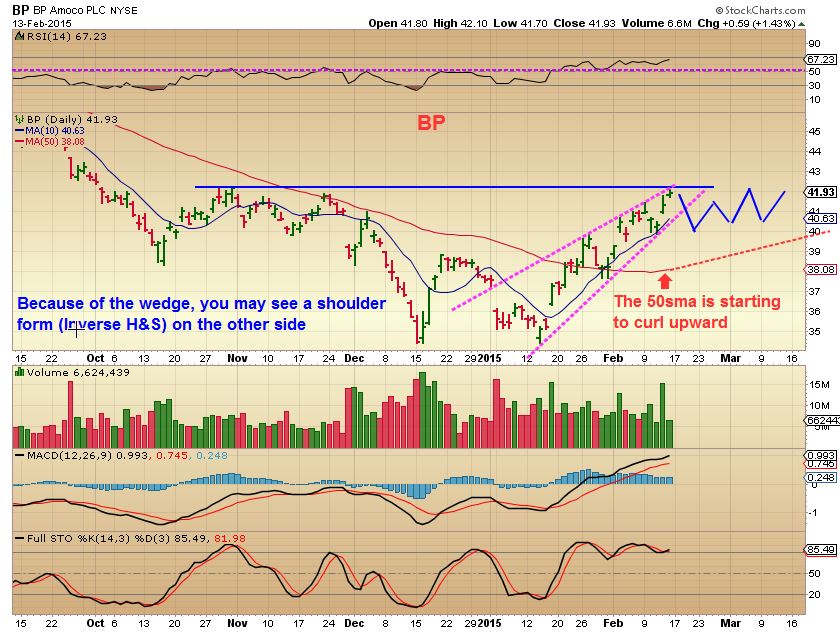
Someone asked about long term investments in big oil companies and mentioned BP. For many reasons, it is too early to know. After a deep sell off like we see in OIL, you may see a strong short covering rally that just dies and rolls over into another sell off, or double bottom . Also price can bottom for months if a V-Bottom doesnt form. With that in mind, lets look at BP on this past WKLY chart at lows. It has at times started out looking good out of the lows, and then bounced around building a base for many weeks . It is also too early to know if OIL has bottomed or will double bottom? Will OIL break down to the $40 level or are lows in place? Etc.
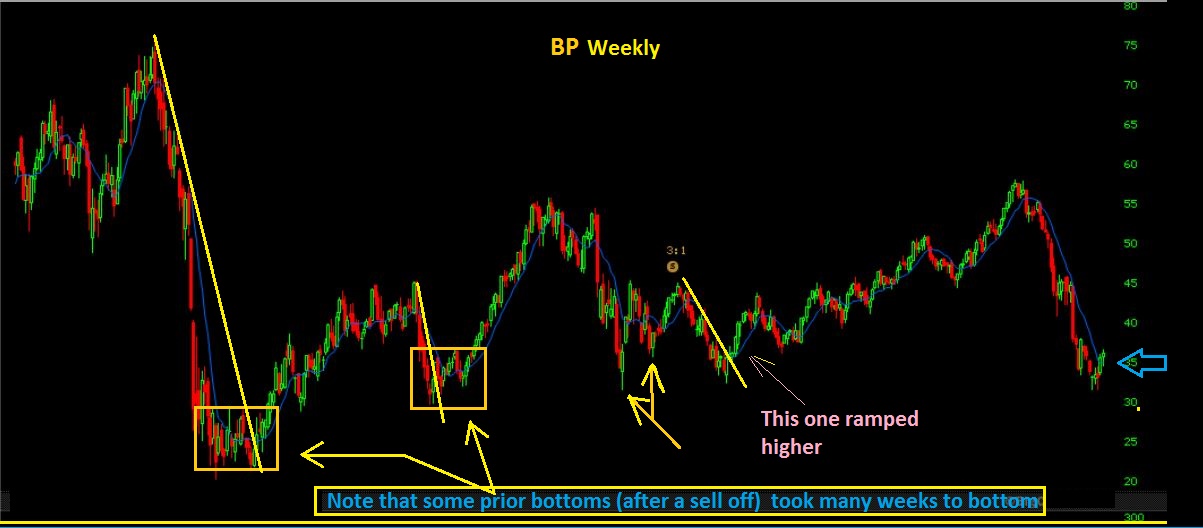
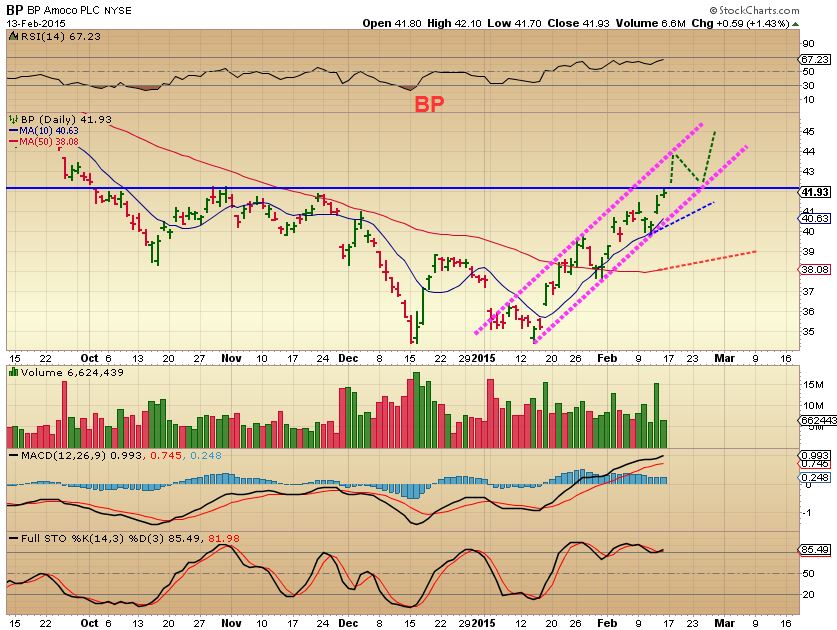
BP – 2 charts to show possible path near term if it remains strong.
Wedge patterns often cause a drop. Inverse H&S forms?
Or can it break higher & eliminate the wedge?
FRIDAY – We Have Another Sign 
 The Dogs Are Lining up.
Scroll to top
Alex, I wanted to ask you. I have about 25% still in cash. Most everything else in energy or solar. Would you recommend investing in YUME or WLT on Tuesday? Or keeping some cash for the next miners setup? Thanks Bhowe
I dont think I can help you …I’m having a similar battle in my mind : )
Sometimes I cant find a decent trade, other times I see way too many . I like YUME, WLT, Some other energy stocks ( I like SZYM 4 month chart as a possible set up too) …while trying to keep in mind earnings for many energy stocks that I hold are Feb 25, 26, area. SZYM too.
I could say to diversify..go with a miners trade on a short leash .
.
YUME earning release is on the 18th so I would keep that in mind.
Always good to check the earnings release date in advance…thx!
Hi Alex. Many thanks for your thoughts on BP.
You’re welcome.
Basically I guess what I was saying was that Short term the chart has been promising. If you’re thinking LOOOONG term, I also dont think they’re going out of business, so we could be near the long term lows, but right now I cant tell if that OIL bottom is really in, or just a bounce. That may affect BP. Also In the past, BP was sometimes up & down at the lows, then eventually went higher . It may be a while before the gains take hold on long term buy & hold.
Thanks Robert. What is your opinion of the
rare earths? REE and others had a crazy up day on Friday. REE was up 58% on Friday. Others 30-40%.
Yeah, I watched them come out of the lows, but they went so fast that I couldnt time a low risk entry.
I saw MCP going from 24cents to 80 cents and thought maybe I’d buy the pullback ( IT kept going) or a lagger like REE?
Then I just watched REE really surged higher ( 24 cents to 82 cents in Feb alone).
Then I watched AVL , QRM. QRM was last to leave the nest and it doubled in 2 days. I wanted to play the sympathy bounce ,
but I couldn’t time it well. There is no low risk entry now, jump on any one of these and you could double or get cut in half….so I have to watch it for now and see how they settle down.
So basically I missed this one, mostly because they were 15 & 20 cents stocks and I didnt trust the short cover rally. I have to just wait & see from here.
Pretty much same situation here. Could have gotten into REE when it was up 8 cents Friday but let it pass. Bought a small position in AVL but think we need to see what happens next there. Maybe there will be some profit taking.
Alex,
Nice report….If it’s not to much trouble can you throw a chart up for AG and SSRI and indicate where the stops should be.
thx
Sure , but first …
Do you mean stops if you were to buy it tomorrow? I ask because My stops are based on where I enter the trade usually, so its different for different entries. For example:
If you aready own it, your stop should be based on either locking in some gains before they all go away ( Like raising a stop after some gains come in) ….or a little below your buy point if you enter at a low risk area.
If you bought it really low in DEC and just want a stop in case the selling picks up? I can do that, but its possibly lower than if you were to buy it tomorrow. thx
bought last week in hope of a cycle low in gold….. and they appeared to be holding up well.
Yes, I just looked at both of them and they do look to be holding up well and seem pretty straight forward. I will attach the charts. I think you got a good entry.
The good thing is that they are above the 50sma, and we are due for the cycle low (Silver looked really good Friday). The rough part is thats basically the ‘stop’ and it could mean losing 10% from here if it gores there. Click on these to enlarge
Exciting times! I picked up UNG at Thurs lows as it backtested, still in energy stocks, and added silver on Friday per suggested trade. Very interested to see how this 3rd daily cycle will play out in miners. Reminder that Fed minutes from most recent meeting come out on Wed at 1400, may affect markets, especially gold and rate sensitive areas.
Well, so much for the Silver trade. Record low temps all over but Nat gas down once again. Alex, do you see this as a chance to add or just hold tight stop under 10-day and see what it does (entry from late last week – near break even currently).
I still like the NATGAS chart. Overall it looks fine , UNG looks fine.
I expected Gold & Silver to be weak and unsteady at this stage , but also to have 1 more surge higher. It still might, if this is a false break down ( into a DCL) , but Silver sure did the unexpected after that break higher last week. I thought SILVER broke out & was going to lead the way .
I still think GDX wants to drop to that $20+ area to tag the 50sma.
Alex, really appreciate your thoughts. I let SLV trade stop out. I was sure it was going to lead also, but part of this is learning – need to learn when what you thought doesn’t work out and let it go instead of digging bigger hole. It was a small position (for a reason) so all good. I like gas chart also. Will look to add then but probably on strength so I know were going in right direction.
Crazy morning – everything down – energy, indexes, metals, bond, even $ opened lower!!
Many energy stocks look like good set ups to me. OIL & NATGAS Down & I like that GDP broke the 50sma, came down & tagged it, and went higher.
so on just a 3 month chart only using a 10sma and a 50sma , check out GDP, SD, EXXI , REXX, WRES, GST, CRK and I wont even mention FXEN, GEVO, or LEI
If GST had more volume I’d buy it here, and NADL went from $1.12 to $2.37 and pulled back only to $2.00 / 10sma . I Kind of like what I see (So far)
All with Oil & NATGAS down
And I agree on your thoughts with Silver going against the break out. Not only didnt have follow thru , but broke down too. Just step aside and see what it will do.
Thanks! Am sure the group got some good info out of that post! I sold GDP as a winner on Fri (wish I had held now!) since earnings are due tonight. Added REXX on dip this morning. That was is lagging others but good sign up against oil as a whole!
Wow, look at GDP, really sorry I sold that now. May trade next time it comes back down!
I added to my GDP when I wrote what It did above. It was a GAP OVER the 50sma and then a light sell to fill the gap & Test the 50sma. I like the way many of these are acting. It looks like a second leg up may be underway for many. See SD as mentioned for example
Also : I think you may have received wrong information.
http://www.marketwatch.com/story/goodrich-petroleum-announces-fourth-quarter-full-year-2014-earnings-conference-call-2015-02-12?siteid=bigcharts&dist=bigcharts
Not sure what happened, had been listed as the 17th by my broker but see now it is corrected to the 27th. Weird. Thanks for info.
Hey Alex,
It is after the close but wanted to see what you thought of a few Miners after today: HMY, SAND, SIL, SLW……..all four at the 50 dma which gives us a defensible stop and all four with oversold Full STO…….might be worth a short term shot long with a very short leash ?
Hi Ken
They look fine ( If we were nearing the end of the first daily cycle I would be buying them for sure). The only problem is a shake out move might occur. A quick dip below the 50sma & it might shake you out…can you wait for a reversal – or see if the 50sma holds here first. A dip below and recovery would be a safer , more comfortable buy
Hey Alex: gold looks very interesting. Big move down today and maybe again tomorrow. RSI is coming down nicely. I can’t quite put my finger on it but it looks to me like it’s trying to scare everyone away for the next move higher. I have to imagine many are shorting this. GDX 20 (and GDXJ 25) as you suggested looks very likely. One concern: higher volume on some of the silver stocks on this decline. Maybe wait until after earnings when things settle down? e.g., GFI still getting hit since earnings release. And look at them uraniums- volume creeping in nicely. Maybe they move like the REES with little or no notice.
I have been watching uraniums and I like them. I dont own any, I bought moreEnergy today and I think Uranium, Energy , and SOLARS might be the next nice % – Launch .