Week ending Jan 9 Review
I like to look back at the end of each week and just see if the charts are telling us anything new. Are they confirming what we expected ? Are there new implications? Is there something there can boosts our confidence moving forward? This week , I see all of the above . Lets review .
Lets take a look at the $USD for a moment- practically straight up

Ooops, wrong image, but they look the same. Here is the correct chart of the $USD
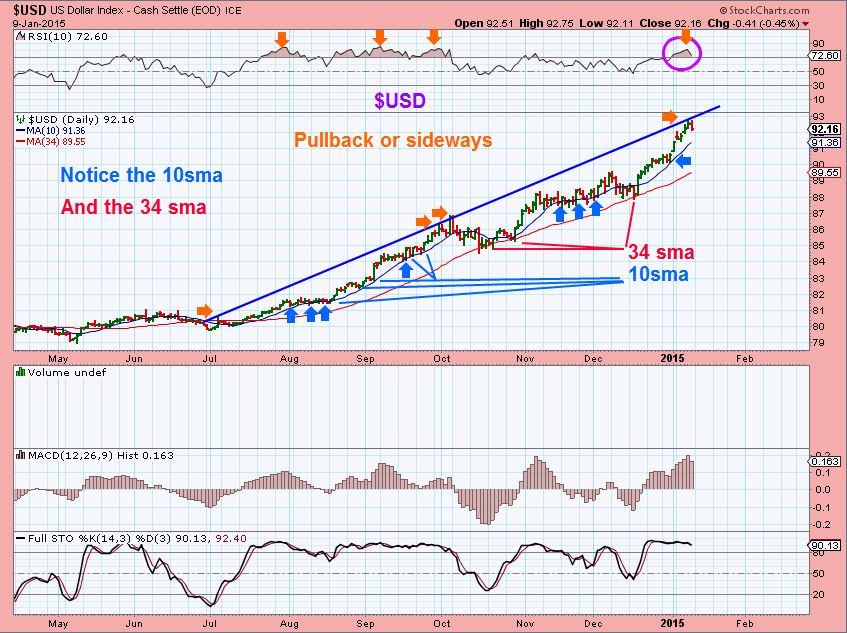
Is it really going to pause? Well, lets look at a few other charts …
AUDIO ( for new ones.. Right CLICK the link, click “open in a new tab’ , when that tab open, find the word “Download” click it & choose “Open” and it should start playing , return to this post to follow the charts) click here for weekend report
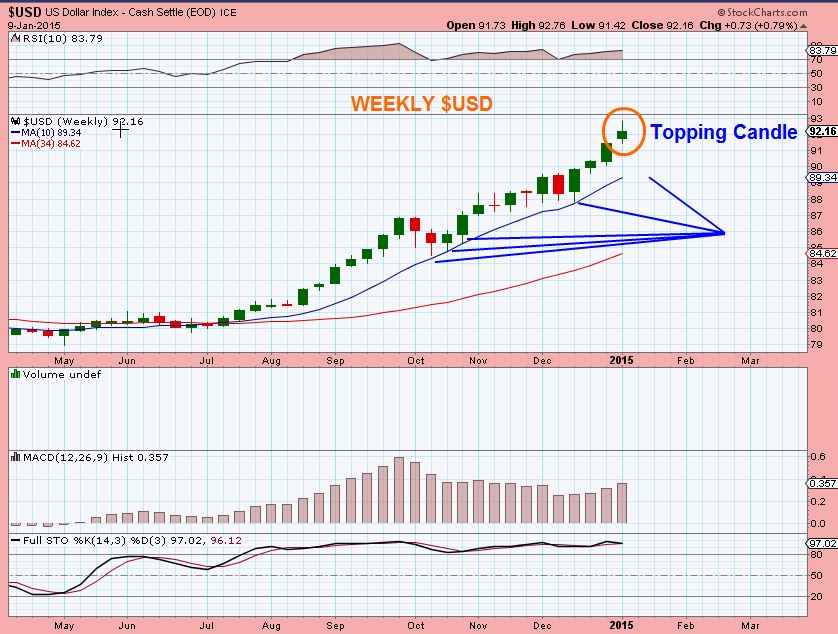
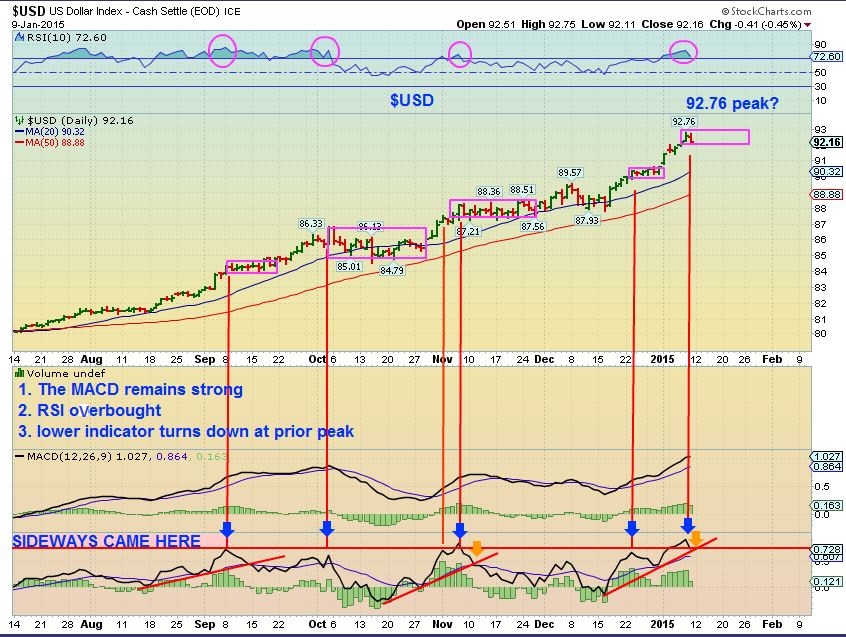
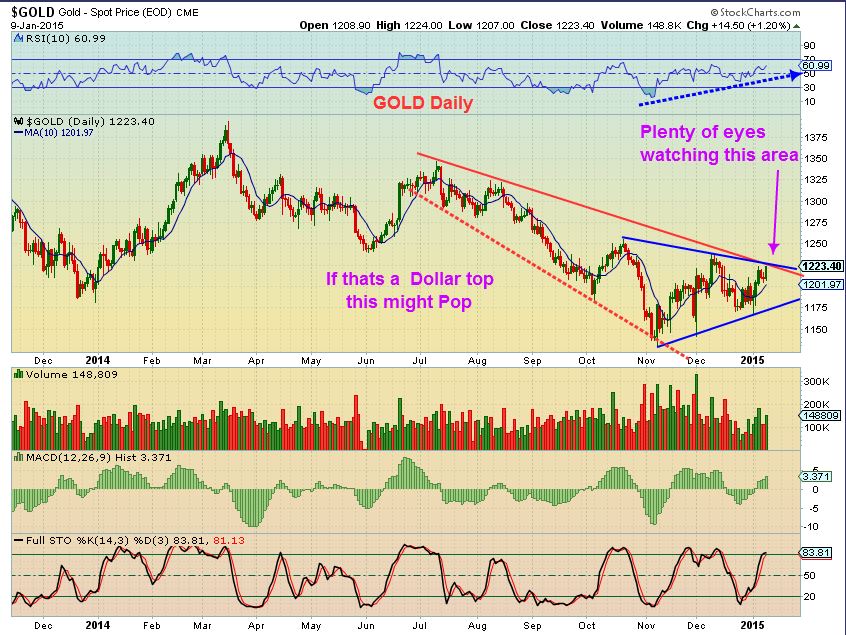
$USD weekly looked like a topping candle
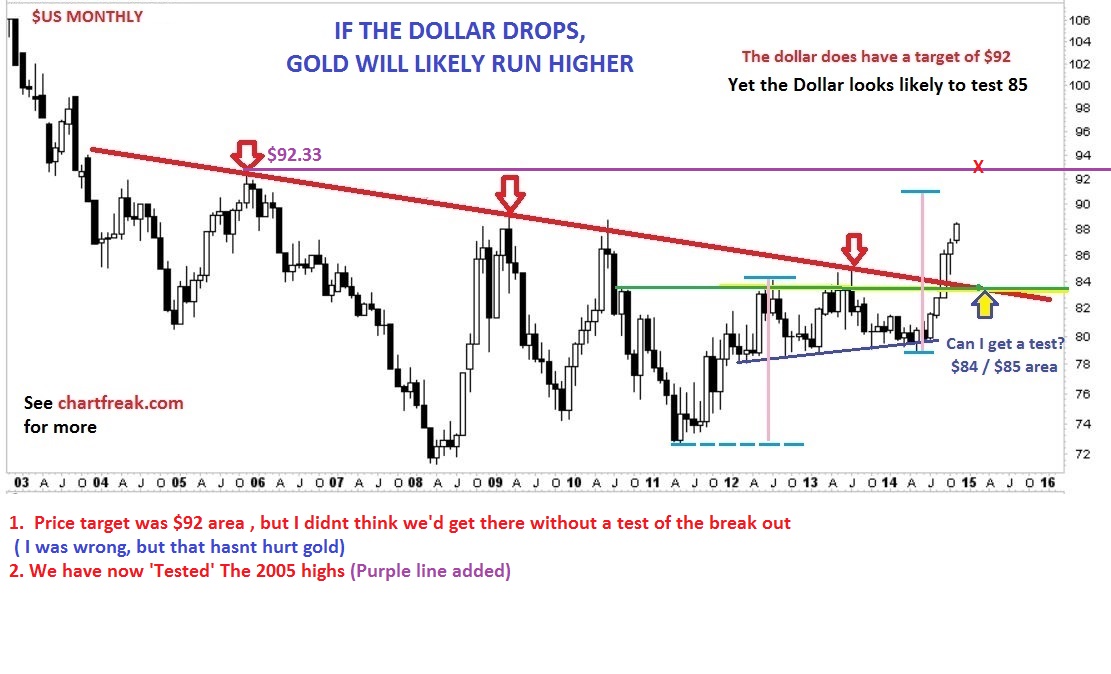
$USD Monthly (Updated)
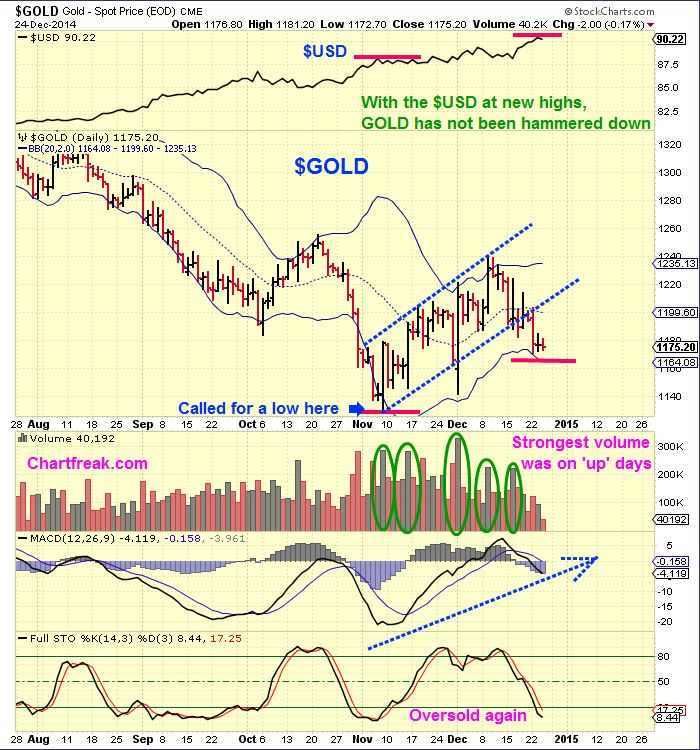
You may recall that I posted this chart in early Dec with a 92 target, and wasn’t sure that it would get there. I saw GOLD Bottom and pointed that out as early as Nov 5 & 7 onward, and since I expected a back test of a recent break out, I thought it would pause & pullback . Well, I was right about GOLD, but wrong about a $USD pullback in Dec. It is strong , an it definitely got to and slightly above 92.
Now going back to this monthly chart, I have added Purple line & Price from 2005 highs ( 92.33) . Now that that area has been tested too, we could pause .
This daily chart also shows an indicator (Bottom Box) that I’ve devised that often pointed out a pullback, pause or sideways move in the dollar when it got extended and turns back down. AS I write this morning, the dollar is up (And it looks like a lot). The dollar is at 92.30 , so on this chart, you see that it could be normal for it to be in this area and still just going sideways up & down.
The KEY is that AGAIN, the dollar is at new highs each week, GOLD doesn’t care at all.
The MARKETS have been strong in a strong dollar environment (unlike a few yrs ago ) . So if the dollar pauses or pulls back, what about the markets? They may do the same.
I have called for weakness and selling / sideways moves in the markets too, and so far we have exactly that. We may just get that type of Chop that can be great for traders, frustrating for investors. This week didnt change much in my past analysis. We can just chop sideways in a range.
As a review – I posted this sideways type chop idea last week.
I posted this in the comments section, could we just chop & form a flag consolidation?
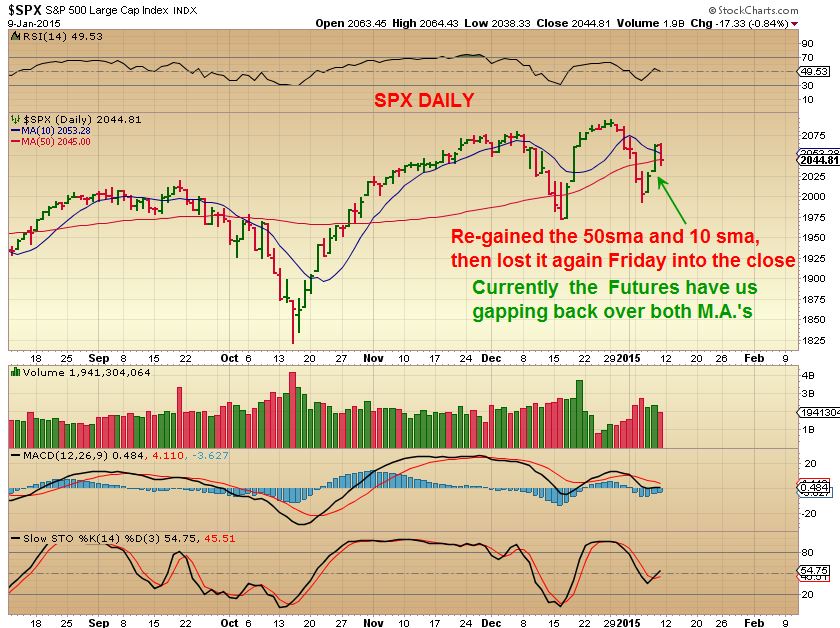
Its not clear yet, but so far we sold off, re-gained the 50sma and 10sma, then lost it again Friday. Now we have futures up , so you can see that this is TOUGH to trade. You pick a direction and your wrong the next day. You switch directions and your again , wrong the next day. I will continue to look for clues moving forward. I love some of the ‘set ups’ that I see forming and it has lead me to believe that Small Caps and Micro Caps may do well. The have consolidated and set ups look good.
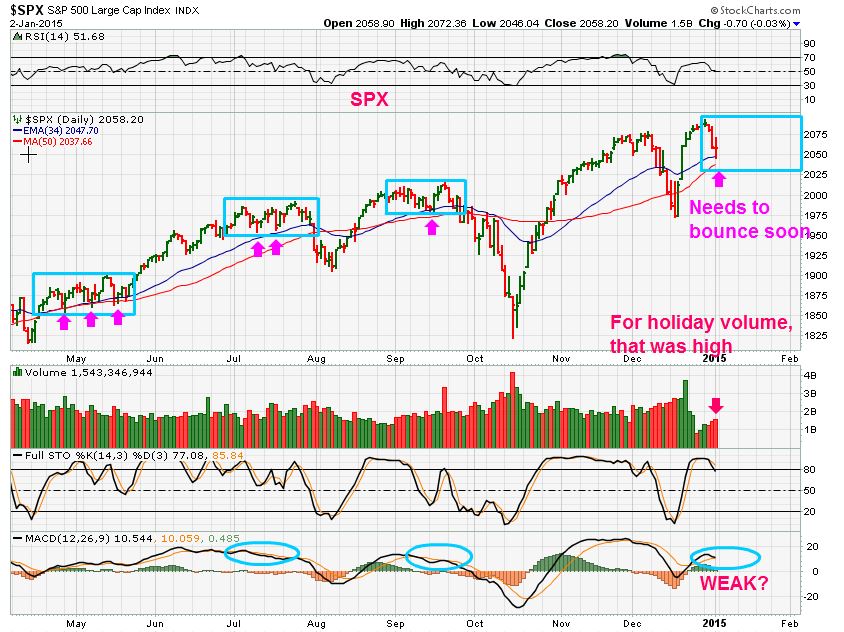
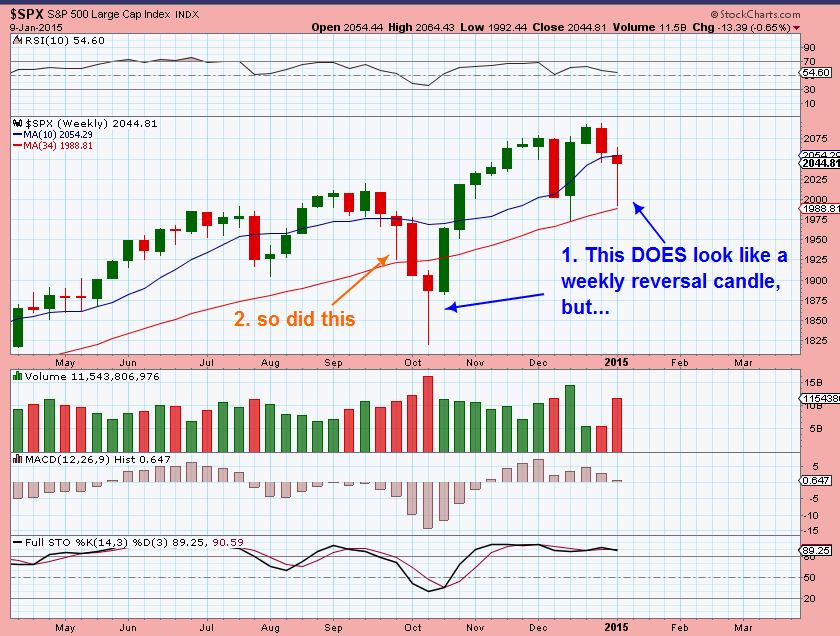
This is the SPX WKLY at the end of last week. Notice that It DOES look like a reversal candle on the 34WMA, but we had that in Sept and sold off the following week.
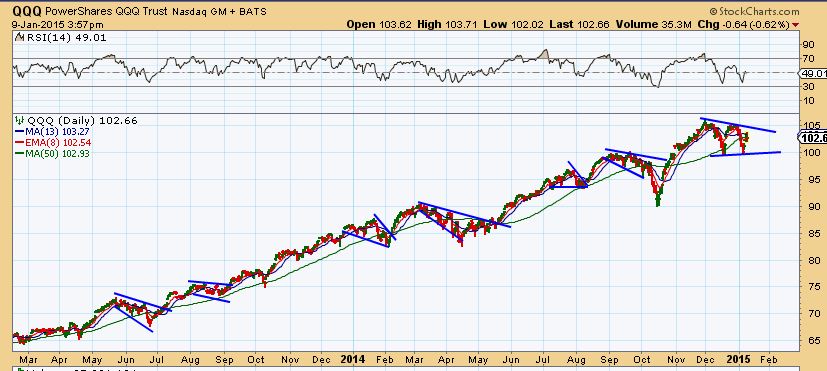
So the SPX DAILY – lose the moving averages, re-gain them, lose them, chop chop chop
In my last reports I have pointed out some nice set ups forming in various equities . These can fall apart in a genuine sell off, so ALWAYS use stops if you are taking any trades in this environment. I am working on the “FreakCharts” section of this website. I have had trouble being able to post new charts there…its a small glitch on my part and I will be working to fix that soon, so that all trade ideas that I post in reports will be available there at a glance. Thank you for your patience, for now you may have to review prior reports from the last few reports to see what I was pointing out.
OIL / $WTIC
I wrote a public blog post last week under the BLOG tab, and just realized that some may not be signed up for alerts there. I post there 1 or 2 x a week if possible, so you may want to check under that tab at times. In my last report there, I mentioned “SAFE” entries in OIL and ENERGY would be a move above the 10sma. I still feel that way , and used this chart as a reference.
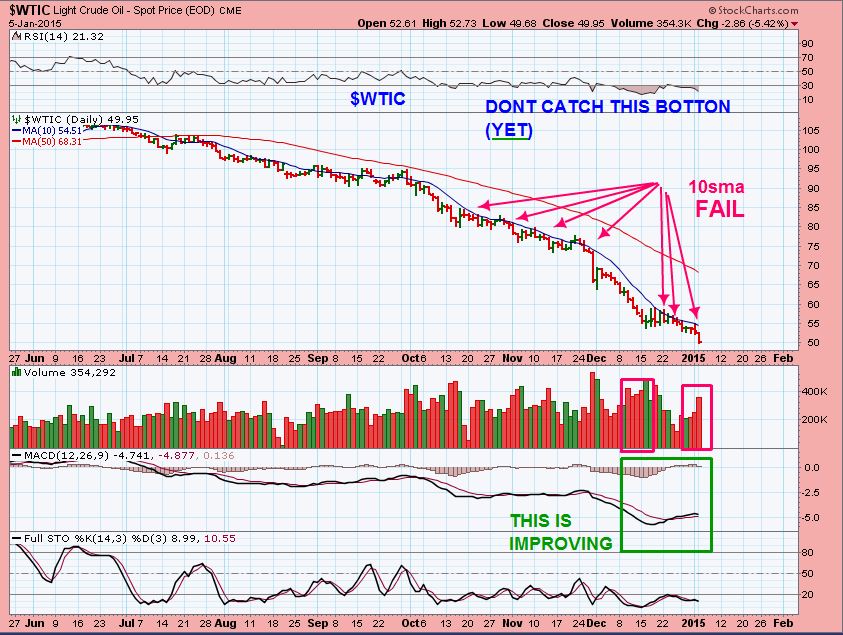
That was a blog post about “SAFE” entries. I am known for buying at bottoms, and a little riskier trades IF things line up. Divergence, cycle timing, exhaustion of a move, and I can be in front of a computer to watch my positions. BY REQUEST from a reader here.
With THAT “being Safe” part in mind, I will briefly point this out .
OIL just broke to NEW LOWS this a.m. ( down to $46 90 as I write) not trading here since 2009 .
It is dangerous, but I am starting to see ( see the chart ) 1. divergence 2. Oversold ( It can stay that way) 3. Wait for it? Todays low could reverse & bounce, but right now I am not watching this area much .
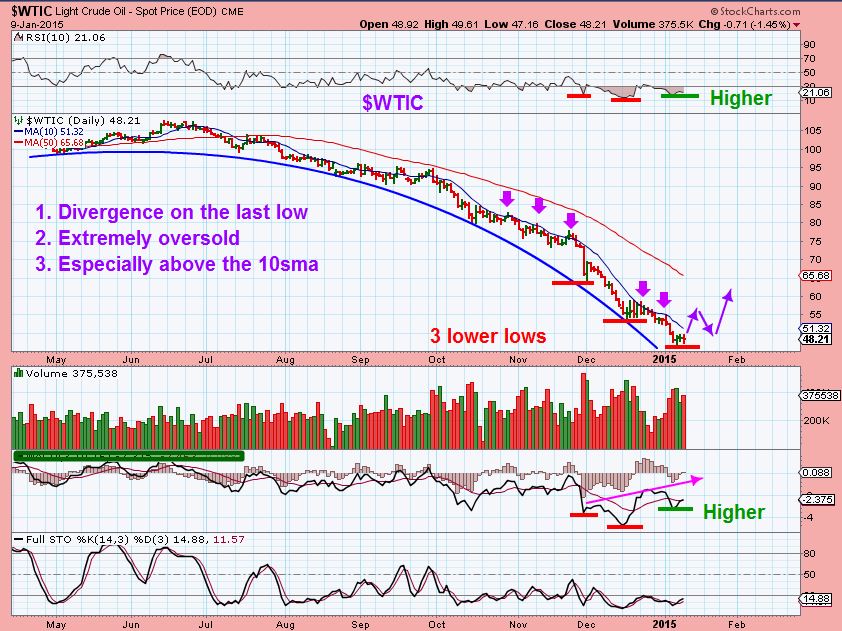
I have been focused on…
GOLD/MINERS
From a technical analysis view point, I love this
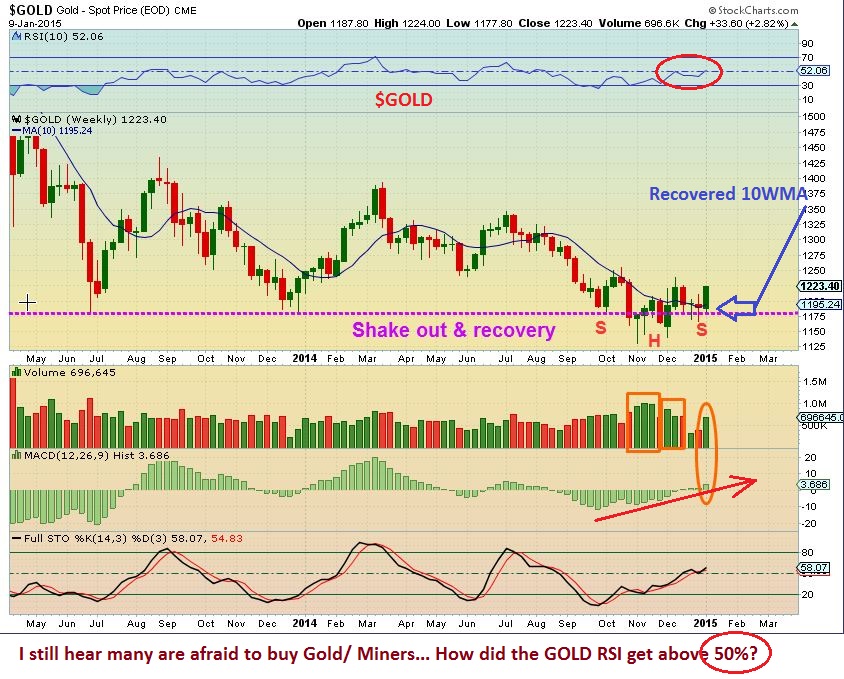
GOLD DAILY – a break out likely causes short cover & additional buying. We could pullback first .
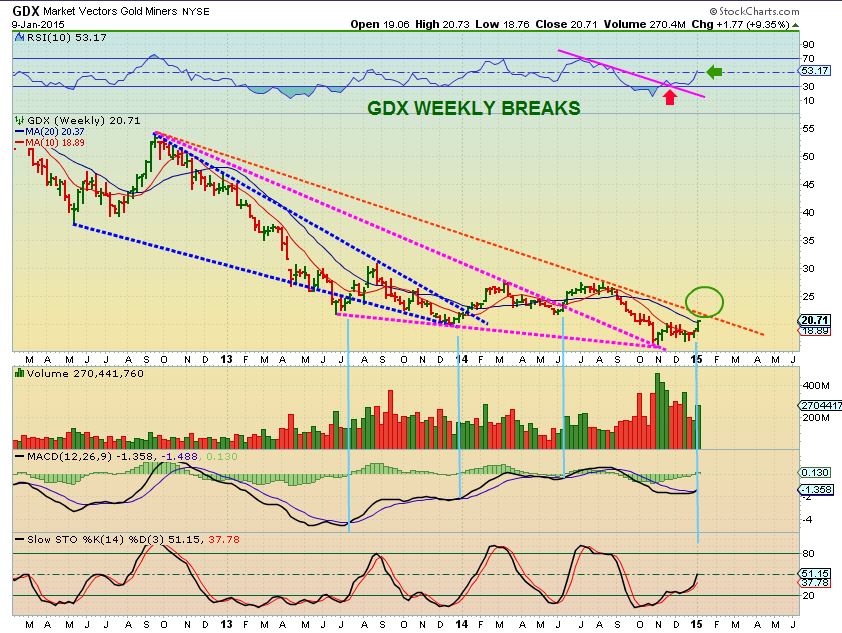
GDX WEEKLY – Many still afraid to buy that base formng. Our Miners ( IAG, CDE, HL, etc mentioned here in Nov & Dec ) are up double digit %, some 50 – 100%
GDX finally ‘recovered’ last week on a wkly. Nice to be way ahead of the crowd.
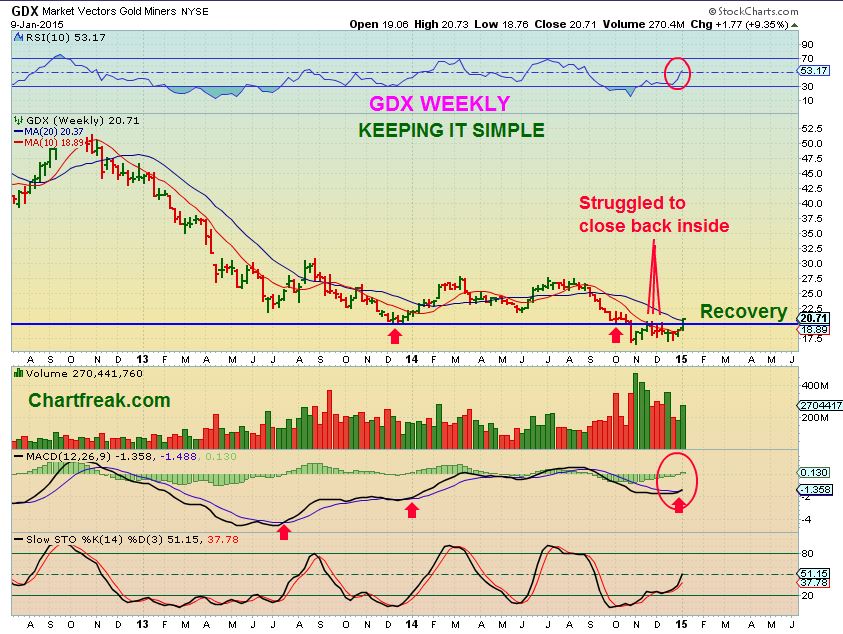
A different Wkly view…More buying may be encouraged with a break above the orange line.
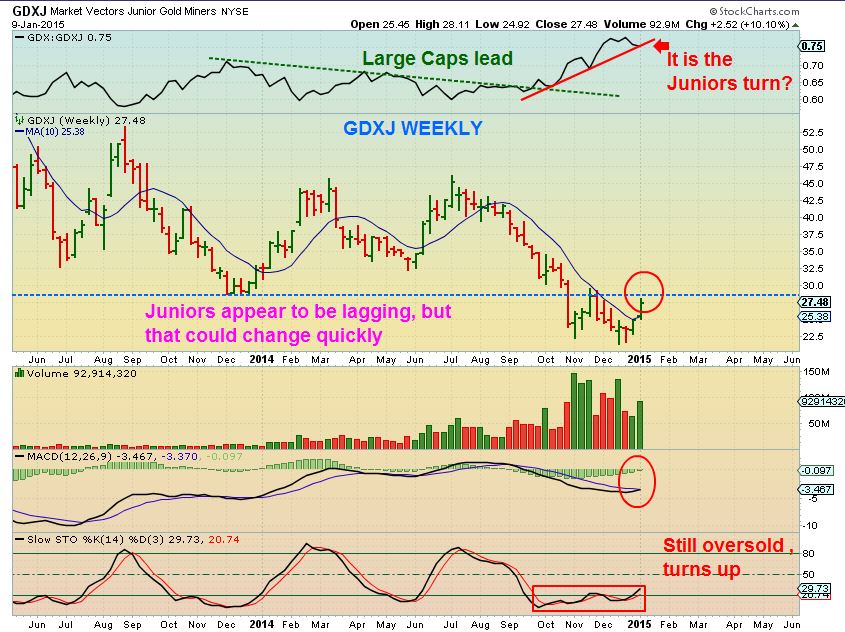
GDXJ WEEKLY – It appears that juniors are taking longer, but I like that. They may play catch up QUICKLY once they also recover . They still show up as oversold stochastics on a weekly.
So some Miners moved up into the end of next week, others pulled back. They arent WEAK, they are doing what they need to to remain healthy. Short covering rallies run straight up & then when shorts are done covering, if Buyers arent there, they drop quickly. A stair-step higher is healthy and I look for areas to but the dips. Lets look at a couple of charts .
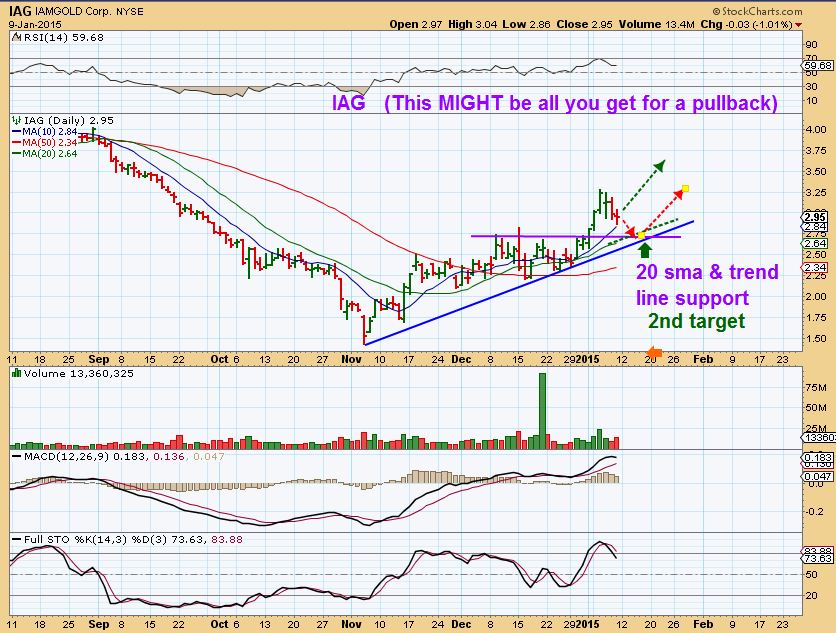
IAG has been strong. It has doubled! So it basically pulled back the past 3 days . Is it sick? No- It hit the 10sma and that might be it. OR it could drop to the trend line. still very healthy looking.
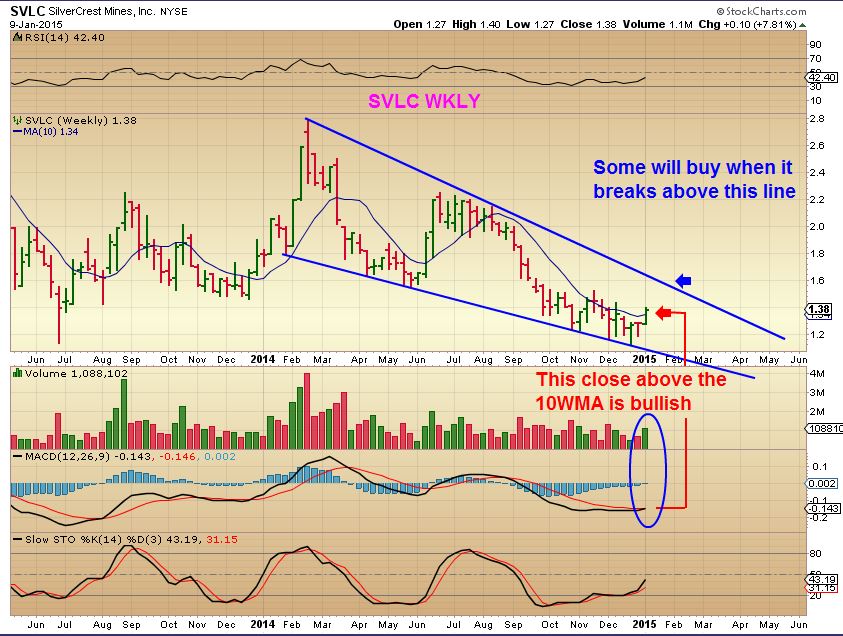
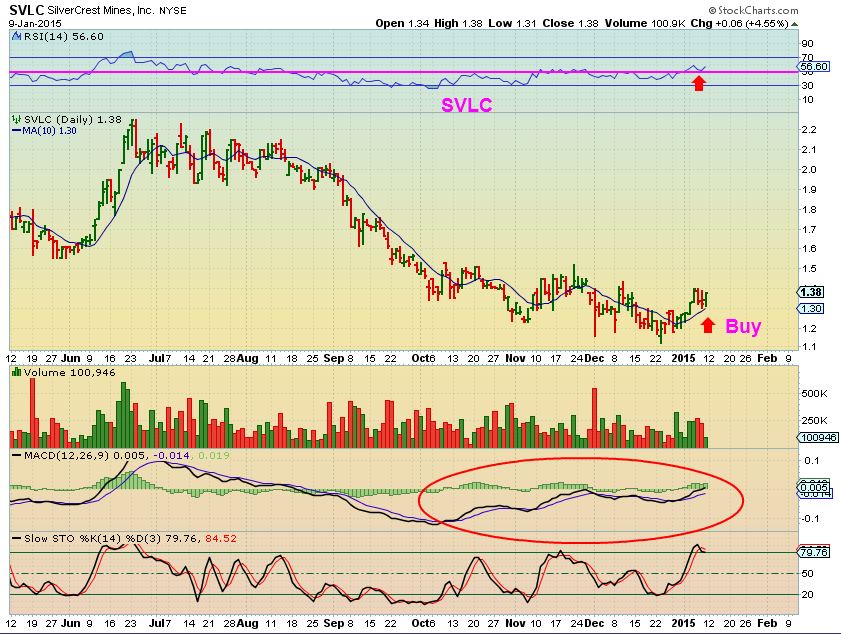
SVLC (Silver stock) this company last yr was a fundamentally sound company. It alwas seems to lag and I dont know why, but when it moves higher, it also caches up nicely (See prior runs). It looks good now (2 charts)
Wklly – Above the 10WMA / Wkly MACD turning up
SVLC DAILY – landing on the 10sma and moves higher (Broke a down trend line that I forgot to draw).
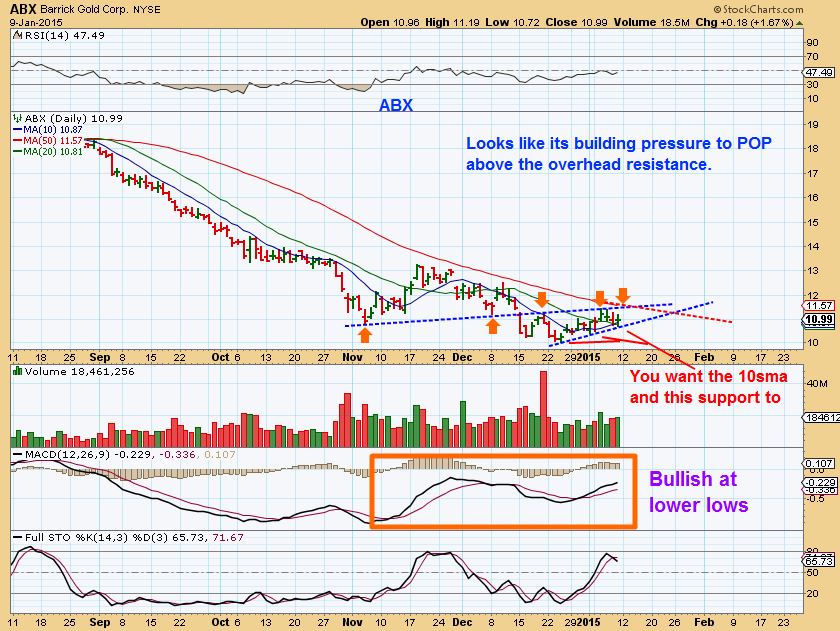
ABX – Its near $10, not super strong yet, basing out. I get the feeling that someday we ‘ll wonder why we didnt buy it if the Miners are bottoming here.
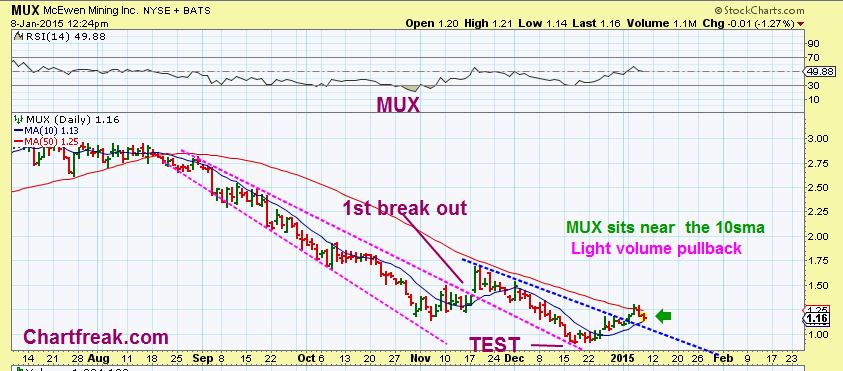
Some dont like lower priced stocks, but MUX in the past has moved quickly once it gets going. I recommended it when it gets above the 10sma in December.
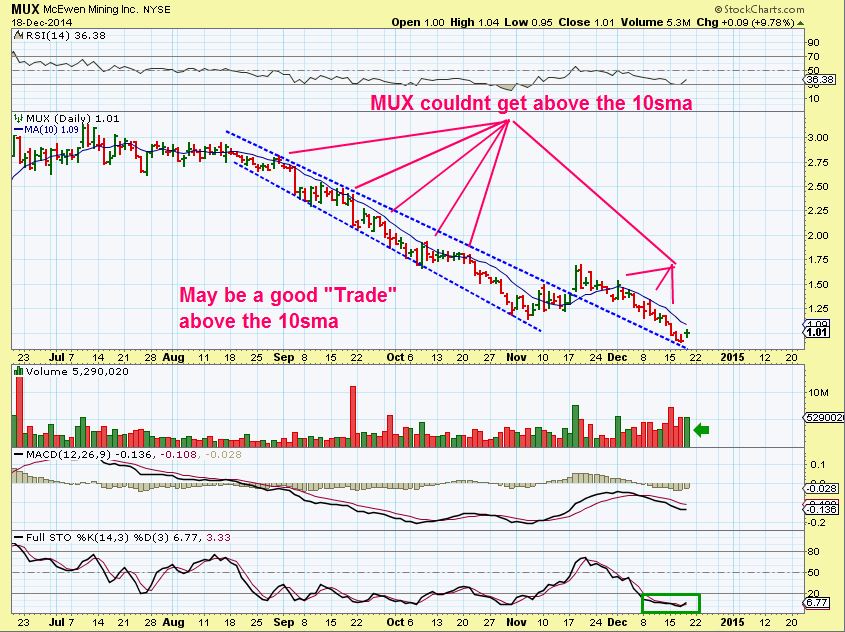
JAN 8 …Mux . It moved up to $1.30 ( 30+% move ) & has now dropped back to the 10sma. Watch it and if it looks like its starting to move higher again, it my be a nice trade.
SO thats your weekend review to help with Mondays trading. NOT a lot has changed, but I like the set ups in Metals & Miners , even on pullbacks . I will have a report Tuesday morning after we see what today brings, but I must say that Wed Morning will be difficult to report . My mother is going into the hospital early ( 6 a.m.) and I really want to be with her, I need to leave at 5 a.m. . I will try to release a quick update Tuesday night to cover anything important. Maybe just a quick review . I know that I will be quite busy most of Wednesday and then Thursday should be a morning report after I have a chance to see what happened Wednesday during trading. Thanks for your understanding on that slight schedule alteration.
(regarding the SPX, DJIA, NASDAQ….I am also watching the VIX as we move forward. ) Best wishes and thanks for being here.
~ALEX
I had a few new people sign up recently , I want to warmly welcome them and thank everyone here for their interest and support. For newer ones, if it is difficult to understand why I have been investing in miners for the past 2 months, you may want to review some of my prior posts and analysis from Dec when you get time, but all I can say is that things have played out almost exactly as expected and now it is more bullish looking that back in Nov & Dec. ( disclaimer : ) We had a deeper pullback than I expected in GDX & GDXJ in Dec, and the Dollar was relentless when I expected a pause, but that strength in the dollar did NOT affect Gold / Miners). New highs in the Dollar, NOT new lows in Gold. That is also bullish.
On DEC 24, I pointed out the top box, $USD at new highs, GOLD is NOT selling off. Bullish & that continues today .
Alex, yet again thanks for the great work! Wondering if you could quickly comment on some relative laggards (NGD, EGO, EXK) that I had heard a lot of during the last run but now their names seem to be absent. Some seem to be below 50dma and this may be the key?? Thx!
Hi Deshy
I have NGD, EGO above their 50sma and just pulled back to their 10sma and bounced. That could be a place to add . EXK is pushing on its 50sma and may break out ( I think it need at leat 3 million volume to do so) . It is also climbing along its 10sma , so It is a lagger, but acting fine.
If you follow cycles, there is a small dilemma – Gold “seems” to possibly be early in its daily cycle ig it can break out of that triangle, but Miners are getting late ( like day 17). Say we guess at a 28 days cycle for GDX, and we hit new high on day 17, its right translated and should be strong, hitting new highs again after the DCL. What will it do from here? stall and drop to a DCL ? Sideways to a dcl? or surge to day 23, then 4 days down?
Its an unknown that can affect miners. Will the DCL be a mild sideways move & therefore some individual miners can just go higher like they have (Iag ,CDE seem to ignore cycles recently)…Or will they all bounce around and end up on their 50sma by day 28?
These are unknowns , but I keep in the back of my mind if considering adding this late in GDX cycle, but again, some individual miners look to be acting correctly. Another few days up might come about, then a dip. Can you take draw down IF they dip? Or should we wait to buy AFTER the coming DCL ? Some are more cmfortable with the latter, some are traders looking for a quick trade. (I hope you understood that?)
DESHY
Total guess, but just an example of what I was thinking. NGD has a nice 3 day run, and pullback. COULD get another 3 day run, then fall 5 days into a dcl. End back near the 50sma. Just a thought for traders. Do I trade & see? Wait for that DCL?
Thanks Alex! It is the cycle thing that confuses me…$gold ?just starting but the miners don’t seem to take a break. I hate to chase but would like to add at a good spot…all jrs seem to be >5% above their 10dma. Seems a bit steep. Not sure best way to add…maybe just a limit at 10dma and cross fingers (I’m not at the screen all day so best I can do??)
Thats why a few days ago I said I have to ignore cycles. They would have kept me out of many trades more often than not here and in 2012.
Plus for you, If your not at a screen, its difficult thing…I used to trade that way. The good thing is that some are really acting very well, confidence that the move is healthy (See GFI & HMY) .
SOMETIMES in the past I have seen stocks above the 10sma and they simply go sideways or a quick dip until the 10sma catches up. IAG looks to have just done that. Some are stronger than others for sure.
Alex, pretty much had same question as Deshy and as you answered in response. I had poor position management on Fed day last week and got stopped out of some of my position (but at a gain) so want to add to GDX but initial target was $22 and we’re about there. In the past once these moves were over it got ugly quick (March anyone?) so leary of adding late in cycle.
I think for now am adding laggards like SAND and after PM report plan on picking up SSRI tomorrow. Will continue to watch updates tom and on Thursday. This has been an amazing run, glad we caught it. Hopefully, we get a controlled pullback and another run b/c gold looks primed to break through DT line and stiff resistance.
Alex,
We are due for a DCL in equities in early Feb., do you think we continue this chop until then? What do you need to see in your charts to tell you the consolidation is done?
Thanks
We would need strong break higher on volume, close above the 50sma first, and the 10sma too. Today “Could be’ a gap fill for SPY & QQQ, but I see weakness internally still, so we need rpive recovery I.M.O.
I am seeing right now a pattern of futures green in pre-mkt and then they sell it off. That is bearish action to my ‘gut feel’ – and choppiness or selling seems to be the overall feel for things. I am NOT seeing convincing BUY THE DIP that I used to . Former sell off & recovery were several days green , now I see red & green mixed. Its quite indecisive at this point.
Good morning Alex. Learn a lot from you my friend!!!
Two questions:
1: Do we get still a report tomorrow morning? (what I think)
2: TWTR, how does the chart looks like Alex?
Wish you strength and love with your precious mom this coming Wednesday.
Warm Greetings…
Hi Geurt,
Yes, I will write tomorrow morning.
TWTR is still looking ok above the 50sma, but I think it may follow the markets and I cant tell exactly which direction they’ll go in. I’m leaning towards weakness so far.
Hi Alex,
Thanks again for another insightful report. Of course, I look forward to your reports every day, but like others have said your priority has to be your mother. Good luck to her and to you.
I just wanted to share something that I noticed a few days ago and has been continuing since. This is clearly seen on an hourly chart of gold. I would post the chart if I knew how but I am looking at it on finviz.com.
Starting Dec 30 all the big 1 hour volume spikes are on green candles. Not long ago these spikes would have been red and we would have called them flash crashes. And they would have come in clusters which we would have called stop runs.
It is not that the bears have run out of triggers and intent. Last week we had attempted crashes on FOMC minutes and NFP. But they fizzled out quickly and were reversed. Then, which seemed significant to me, gold kept on rising between 4pm and 8pm. Normally, it either goes sideways or down. So buyers were willing to hold over a weekend. Then at approx. 0330 EST this morning there were co-ordinated trades on USD (up) and XEU, Gold, Silver (all down). Again all that quickly fizzled out. The image in my mind is that the bulls now have the cannons and the bears have peashooters!
I have no idea what it is but something seems to be changing in the gold market and, for the moment, it is favouring the longs.