You can just Re-Read yesterdays report on the General markets , and then come back here and see how much clearer it looks with the charts supplied today. Yesterday I was saying that Futures where up , but could it last? ….
Well, Let me just start with a chart that I posted yesterday …
Now check this out…
Report was Written Wed Night midnight / recorded 7 A.M. Eastern (Audio)
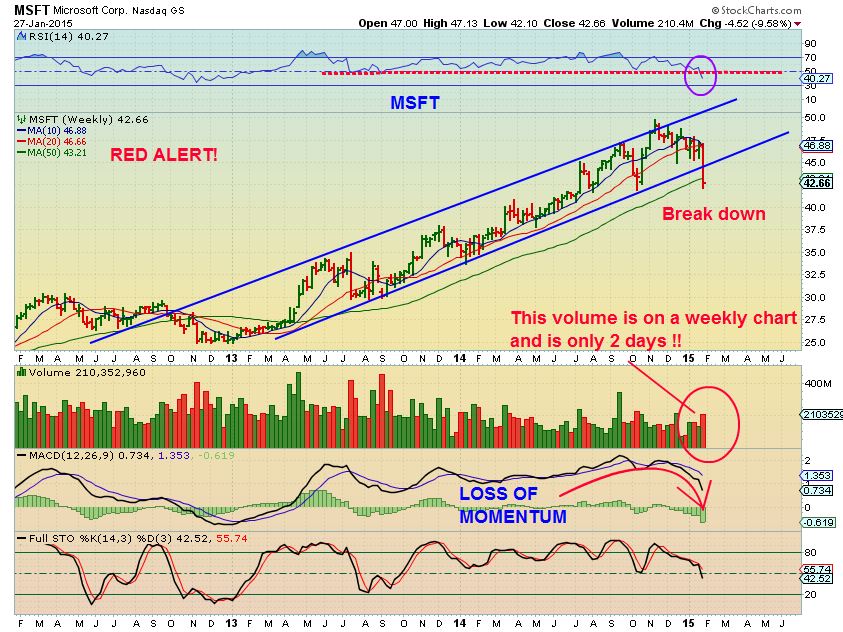
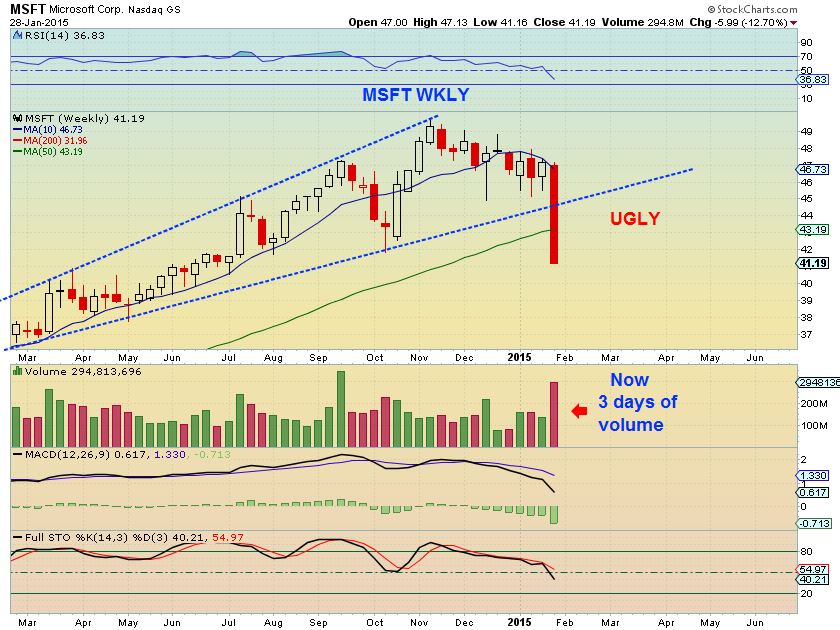
MSFT WEEKLY – 1 day later…
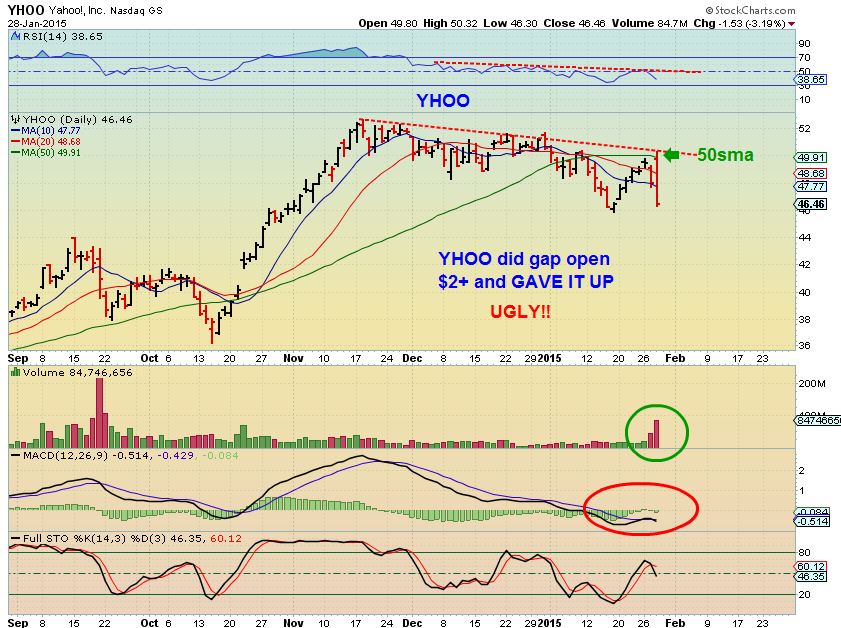
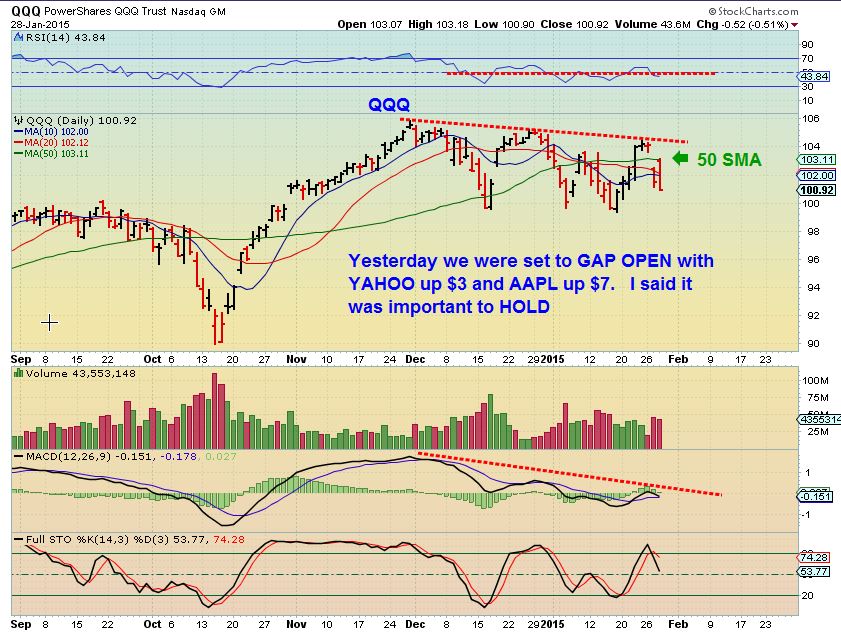
Yesterdays report was saying that pre-mkt YHOO & AAPL had earnings and were both up nicely, but was it enough? I’ve been seeing so much market weakness in various ways that those Pre-Mkt gaps open would need to HOLD .
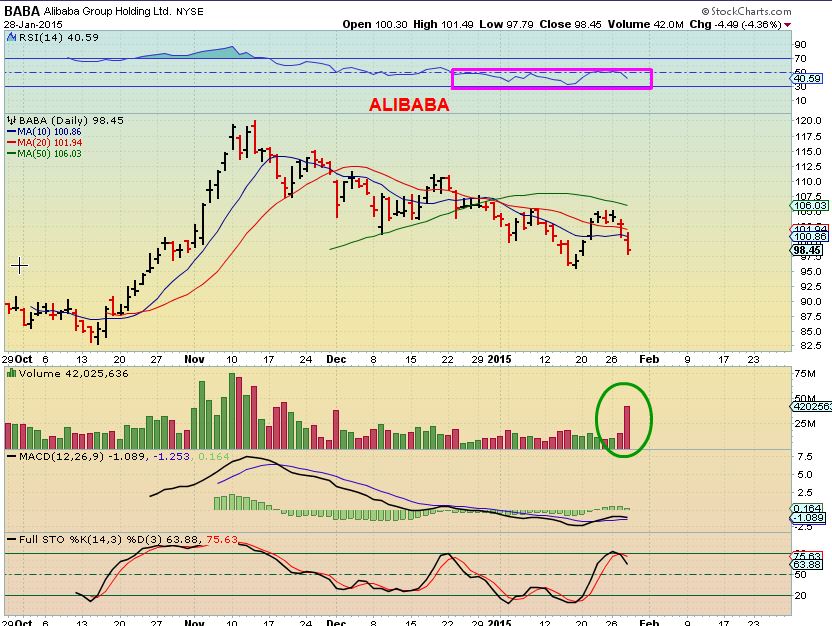
YHOO gapped open and so did ALIBABA on the news – this could have helped the QQQ (NASDAQ) . Here it was by days end.
BABA too ( High volume ‘giving it up’) If you watched Yahoo- you should have shorted BABA Here!
Cut to the chase, QQQ Died at the 50sma
Yesterdays chart below – I pointed out the SPX or SPY – FOMC needed to give it a burst higher too.
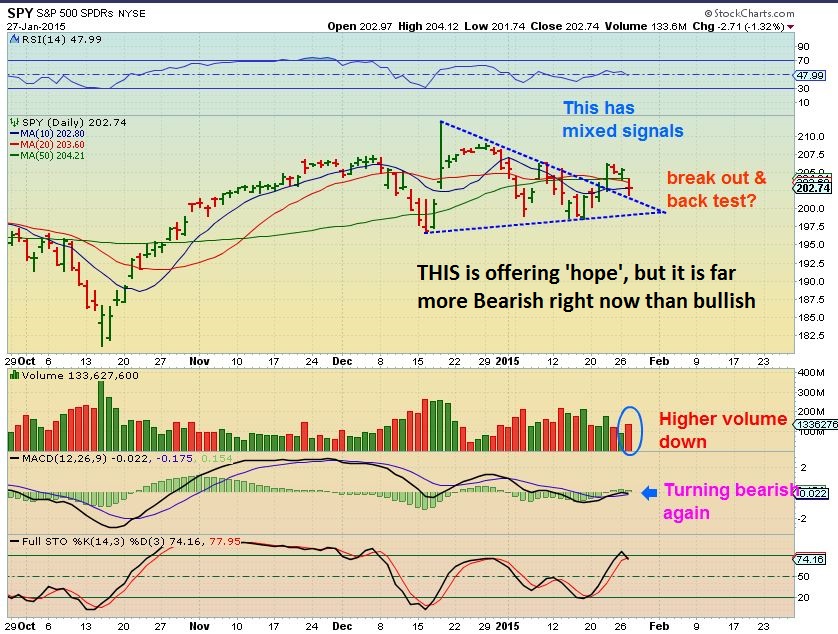
Did it hold?
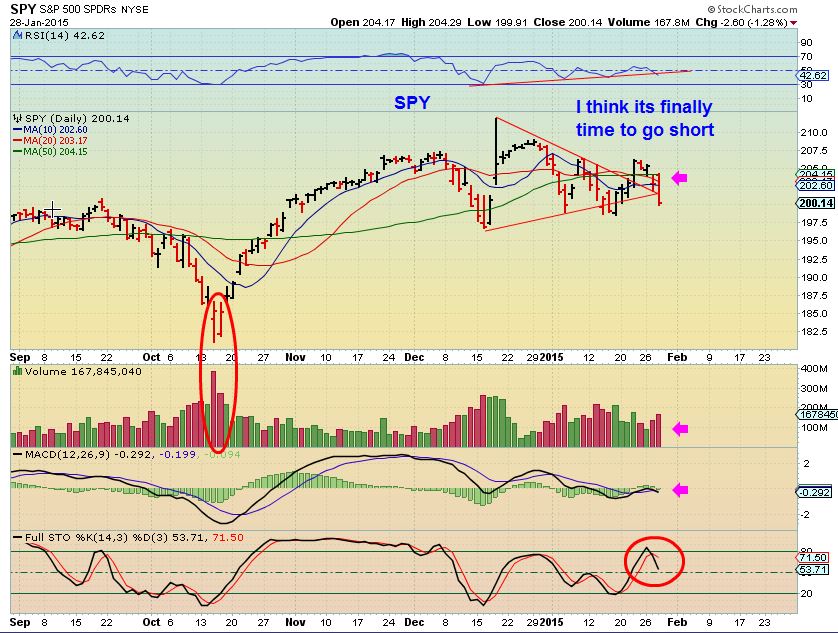
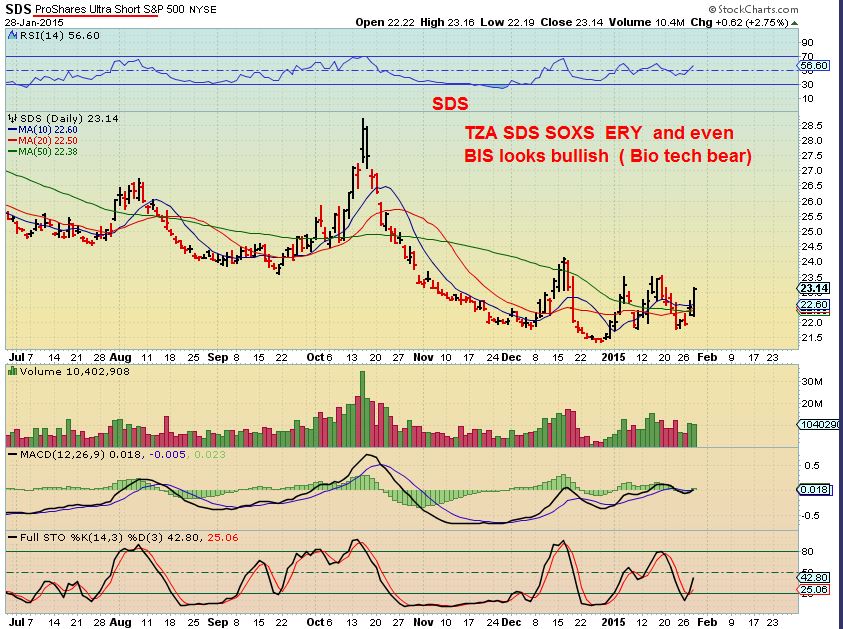
I pointed out this SDS chart as a way to short and have mentioned TZA to short the NASDAQ at a failure of the 50sma. I honestly think its time to short any bounce, these MKTS seem really weak.
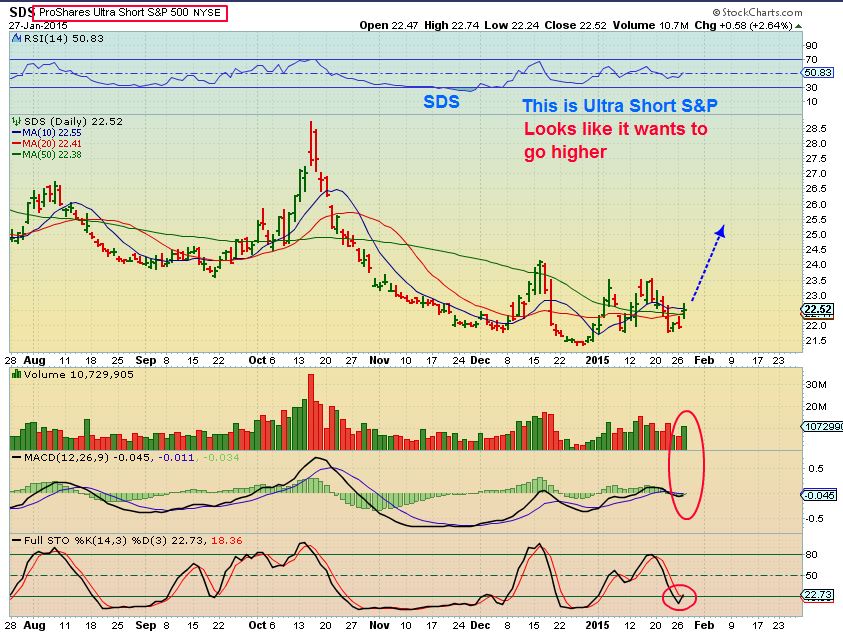
SDS NOW
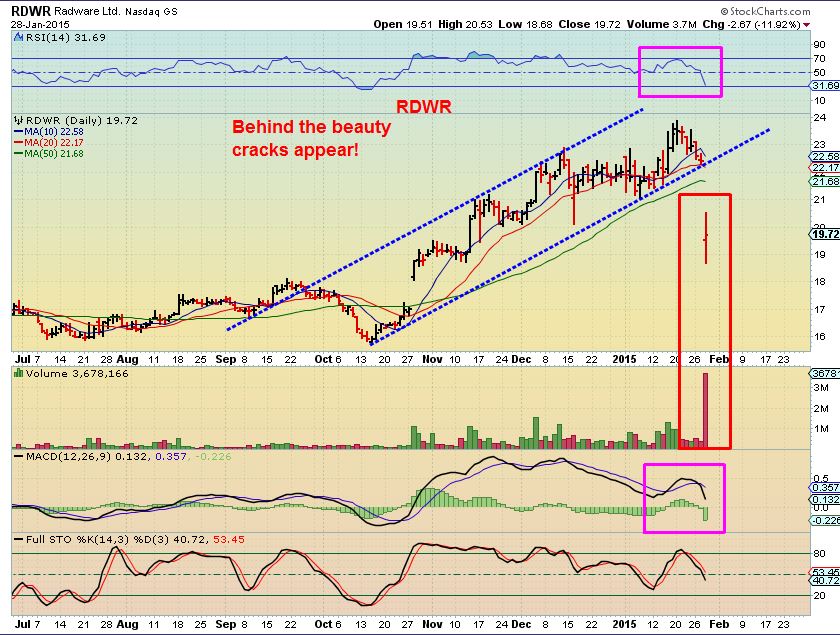
Need more proof? Remember I pointed out P&G , MSFT, INTC as weak , ugly, Broken in yesterdays report? Well another that looked really good has lost its support.
RDWR
So I actually took a small position in TZA Wednesday. Small because there was a large enough B.O.W. # to cause a bounce. If we get a weak bounce Thursday, I may add. You can use TZA, SDS, or buy PUTS, short a stock that breaks down…or even better, wait for a breakdown and a “test” of that break down on really light volume bounce. If I see one, I will point it out.
ENERGY. OIL looked bad and ENERGY started to give it up early. IT was F.O.M.C. Wednesday – so all things need to be watched. I mentioned in yesterdays mornings comments that I had to go away for the day, so I would ( Using my phone) be watching the XLE. It was sitting on the 10sma as I wrote and I sold my GDP. A break of the XLE 10 day moving average would be a bad sign, and other Energy stocks breaking down would too.
So this is XLE now – It broke down through those moving averages as did many energy stocks. The double bottom looked good with MACD rising, but the selling is a warning.
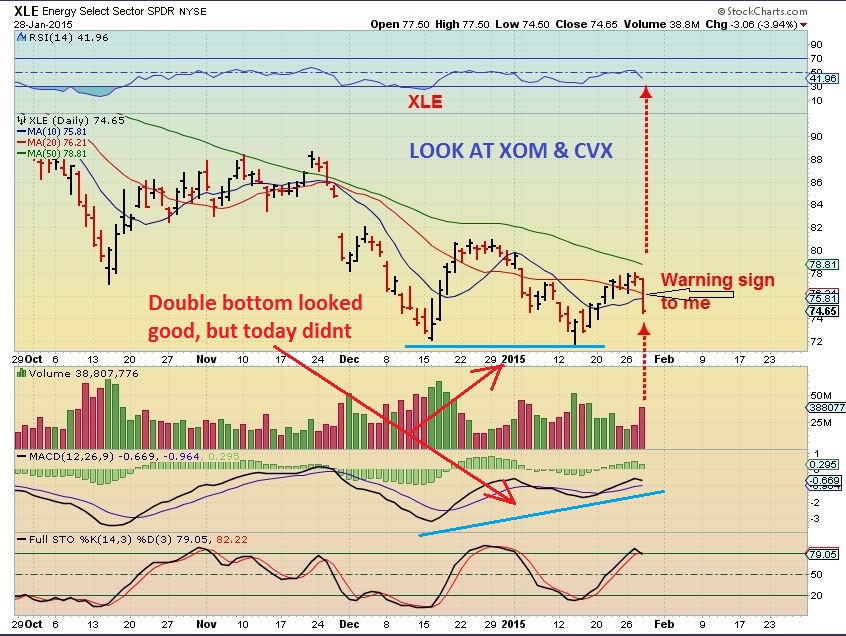
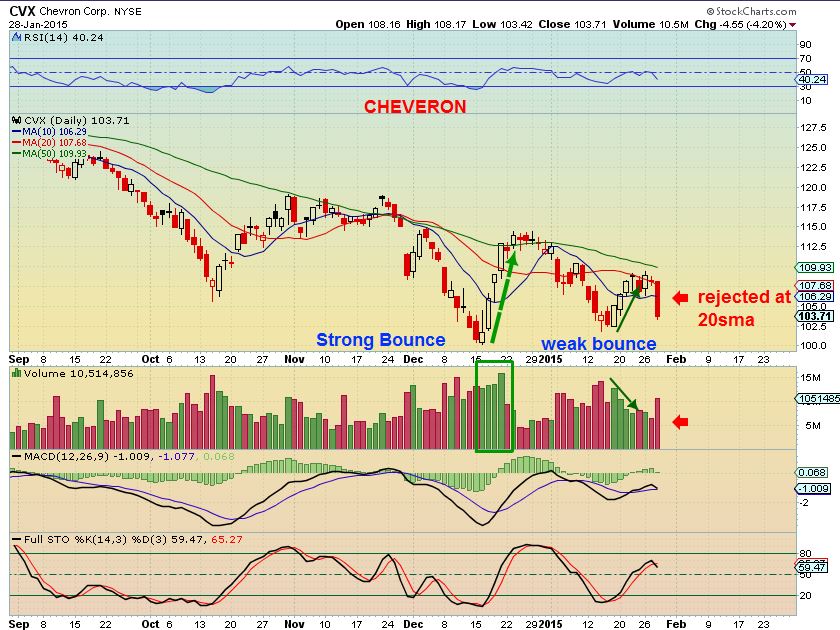
Some big energy stocks began breaking down ( Like I saw XOM and CVX)
LESSON:
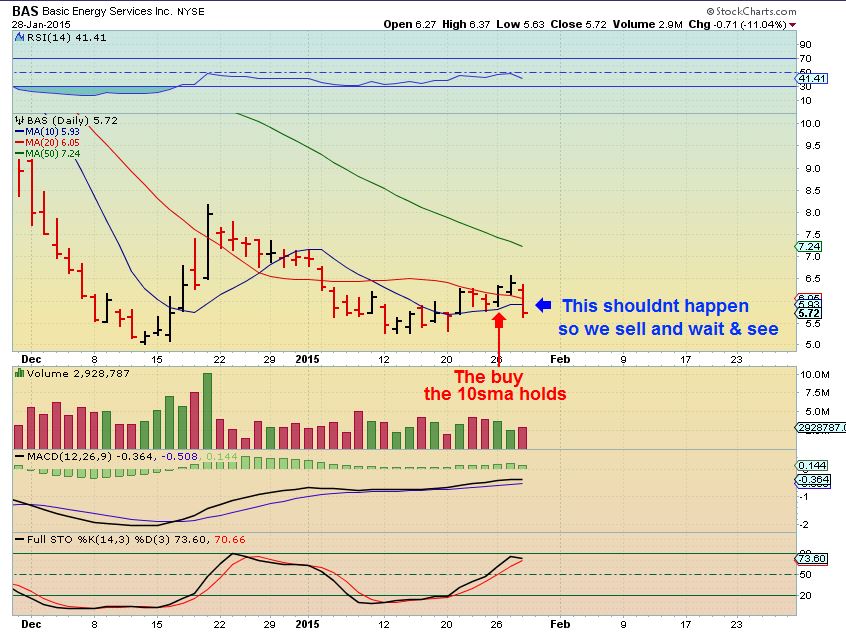
So when I pointed out that this move above the 10sma was your buy (BAS & many others) – I also said its low risk because your stop is if price breaks below that. You then are out and can look for another entry again later if it presents itself. SO- your stop is below the 10sma
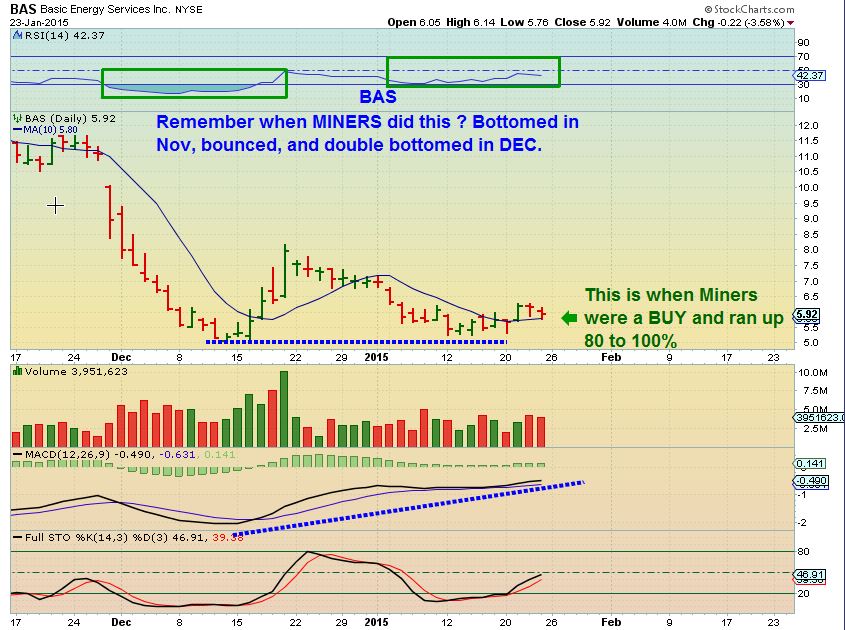
BAS now…below the 10sma – it may recover , but why chance it, since the whole sector is dropping ?
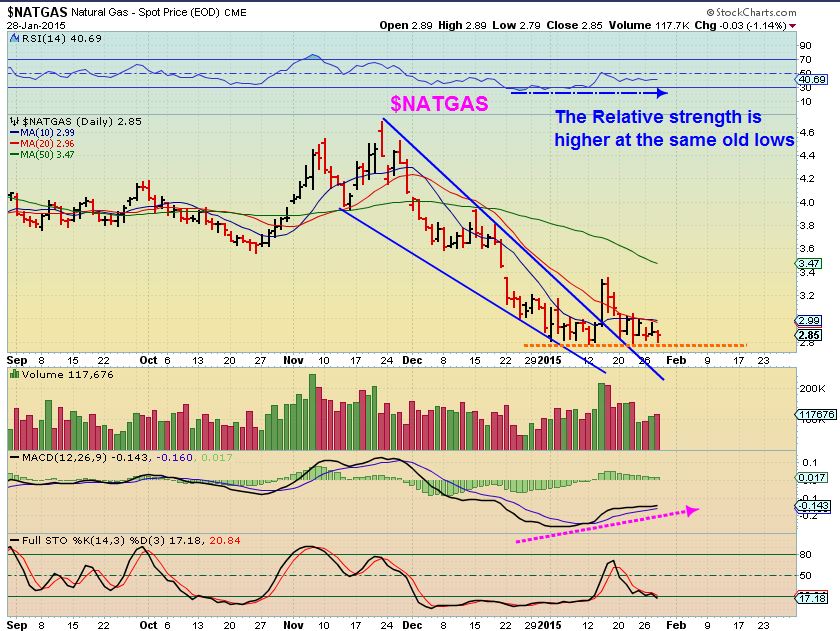
$NATGAS is still holding steady , and it looks ok, ( but makes me nervous when the OIL / XLE break down).
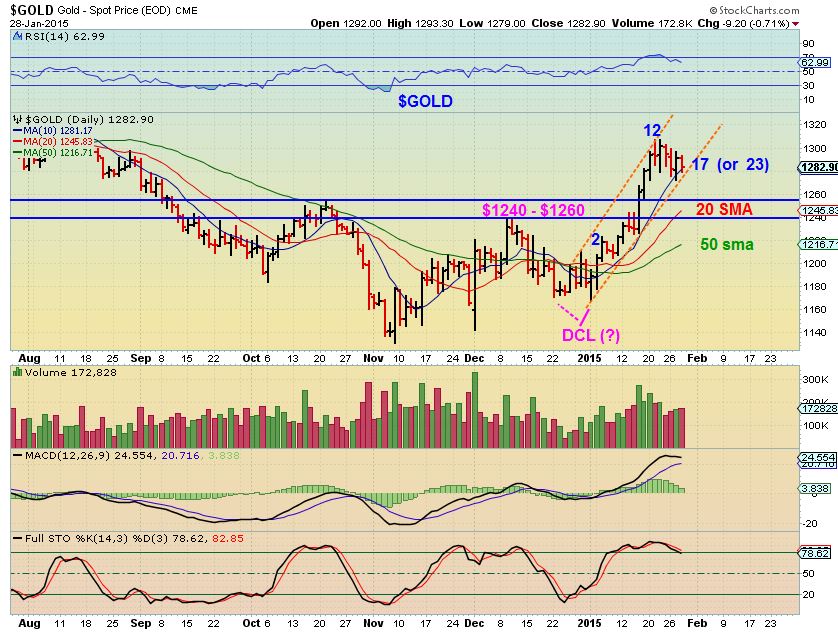
Where are we in GOLD / SILVER / MINERS?
$GOLD should break down to at least the 20sma, maybe the 50sma. That will clear bullish sentiment and you will hear BEARS start shorting.
They held up all day , it seems even after the FOMC release , they held up from 2-3 pretty well. Suddenly going into the end of the day they started selling ( I missed it real time since I was on my way home, but I do see it now on the 5 minute charts) . What would cause that? I am thinking that THIS chart of GDXJ looked like we may have started the 3rd daily cycle Monday .
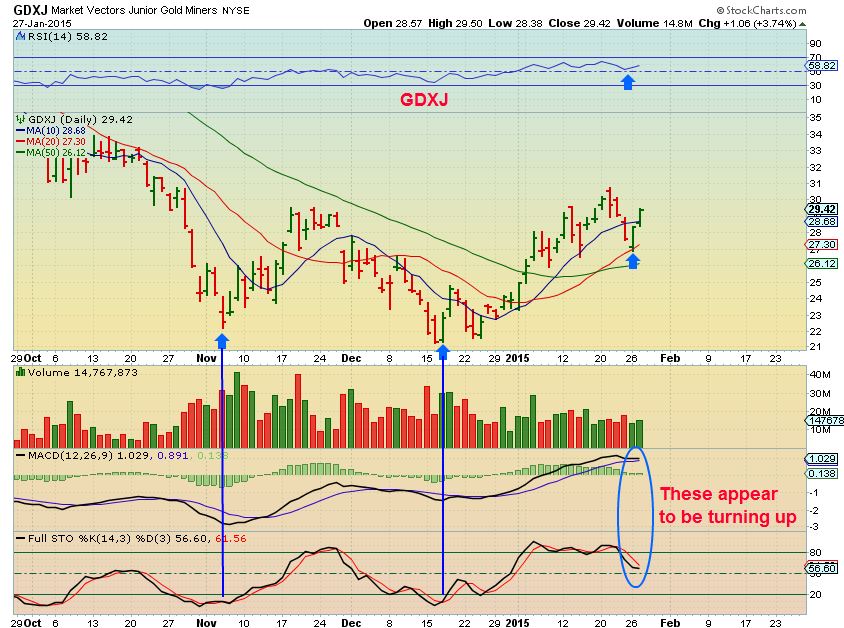
However, Since we started selling off today, I am thinking that we are dropping down now into the 2nd daily cycles low. Timing wise , this is a very right translated daily cycle and should still rise up to new highs. Notice what I mentioned a few times on this chart when I thought about how this could play out .
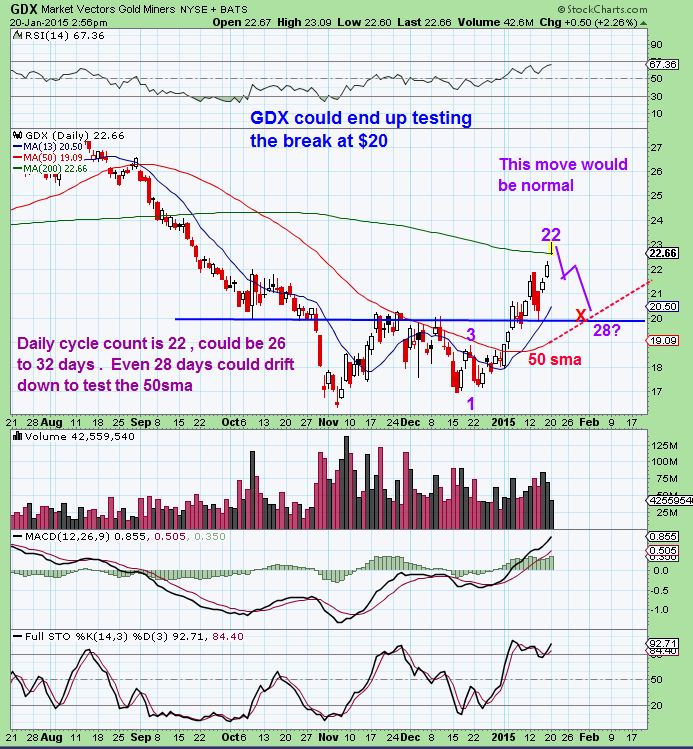
This JAN 20 GDX chart should look familiar, I posted it a few times.
1. Break the 200sma
2. Day 22 / 23 high
3. drop, bounce, drop
4. tag the 50sma and break out area for DCL
GDX NOW- Almost exactly the same.
1. Break the 200sma
2. Day 22 / 23 high
3. drop, bounce, drop
4. tag the 50sma and break out area for DCL ??
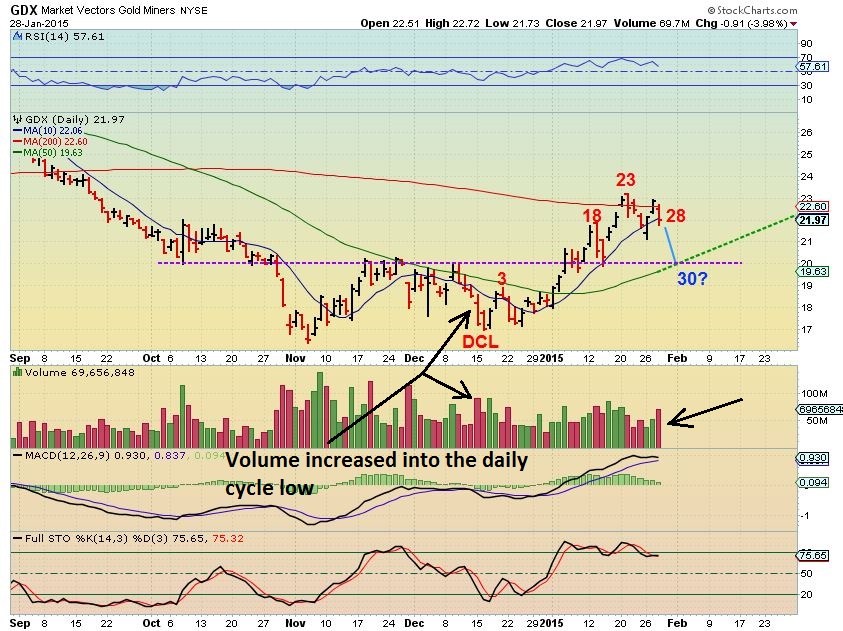
SO GOLD & MINERS may be dropping down into their daily cycle lows, and then should make another run higher. I still hold my AG and some JNUG. I would have sold JNUG if I was home, but I bought it at the 50sma and didnt get stopped out yet .
At this point, I am really thinking that its a short-able market. I am really seeing no BUY THE DIPS mode overall. Good earnings in YAHOO/ BABA and a few others hasnt helped and other stocks like PG, MSFT, INTC are getting ugly and MU looks next. I took a starter position in TZA and if the markets bounce or gap open…I may add if it gives it up again mid day.
I am also waiting to see what GOLD/MINERS are going to do next…I expect a dcl in 1,2 or 3 days and then another run higher. Patience on that one could offer a nice trade. I am watching the 50sma area.
ENERGY looked good with many double bottom/higher lows , moving averages were starting to curl upward – it was a good set up , but today was a big let down. I dont like to see price drop back down under the 10sma , so now I have to just keep an eye on that sector and see how that plays out.
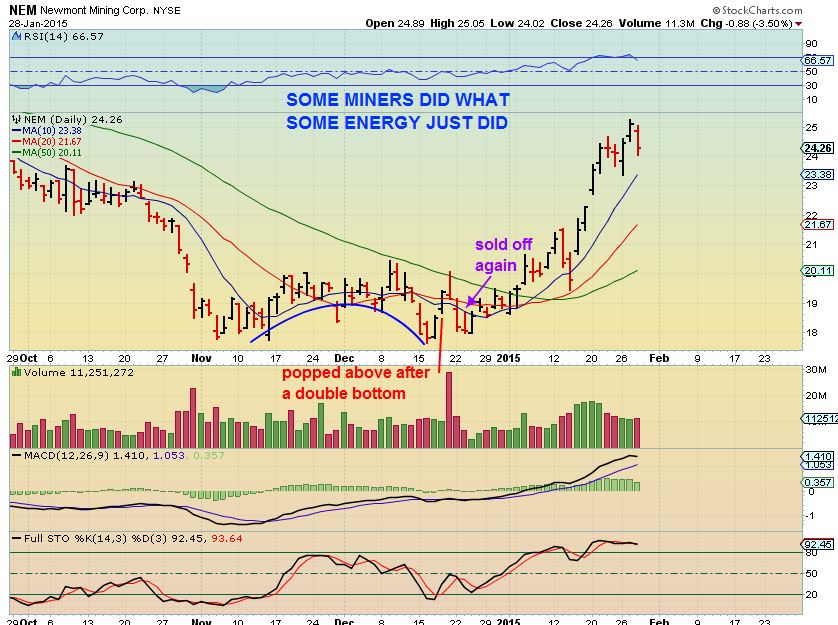
I looked back at the double bottom in Miners from Nov low to DEC lows and did find a few miners that did what ENERGY just did, but ENERGY needs watching from here to see if it does as the miners did after that .
NEM for example: Double bottom / broke above the Moving averages/ dropped back for 2-3 days, then rallied.
Time will tell in all of these sectors. My thinking is Short markets / DCL soon in Metals /Miners / Energy is very iffy NATGAS is holding up, but makes me nervous until it finds a direction. Lets see what day after FED brings : )
Best wishes to all
~ALEX
F.O.M.C – Back At The Crossroads 
 Quick Friday Update
Scroll to top
Alex, you’re really killing it. Thanks for your great help, clarity and guidance.
Thank You Jonathan.
I have to admit though, in The ENERGY trade I was a tad sad in some ways. The set up was good, but in BAS for example…. I was up from roughly $5.80 to $6.57 in 2 days with a couple 1000 shares, gave it ll back in a day. I was hoping for a move to the 50sma, but most of the energy set ups fell apart.
only kept smaller profits in GDP & EXXI
And it is vital you continue to show how your suggestions are working or not, in a most timely fashion. As you do.
I moved into EXXI before 10am ET y’day, down 2.5% at close. On verra.
NB. $GRDOW…
GREK too ( just looks to be a small a bounce so far)
$NATGAS gave way. I knew it made me nervous trying to hang in there while OIL & ENERGY started to sell off. Just wish I grabbed DGAZ : ( Oh well…trying to be patient for a good set up
I meant Greece as a potential long term investment
of course if GREXIT then the price will be even lower
thx
Good stuff Alex. I have small positions in energy and metals, hope to be on the right side of a brief DCL and hoped-for rebound in the miners.
Thx CS
I still have a few Miners positions too. I may have sold JNUG if I saw the closing sell off yesterday , realizing that we are likely heading for the Daily Cycle lows, but I was driving home around 3 Eastern. I am break even on a late entry there. By the way – I DONT RECOMMEND JNUG / NUGT / Leverage for a 3rd DCycle ( But I do trade it & thought we might break to new highs and then roll, so I bought it at the 50sma )
The drop to the DCL can be a couple of days. I’m thinking Miners were leading & can find their lows first. looking for a reversal.
As you mentioned Alex, this is looking very similar to the 2008 path for GDX. The 50 day is curling up nicely as it did in 2008. Volume is increasing as we go lower just as we did in 2008. Should we end this decline at the 50 day as we did in 2008, we will have created a beautiful double head and shoulders on GDX stretching out from October 2014. What may really encourage the bears even more over the next few days is the MACD pointing down which it’s about to do. In 2008, it actually crossed down. Those who have been predicting a washout capitulation still remain in that camp and haven’t wavered. Seems almost like yesterday’s war. Maybe instead we’ve already bottomed with a quiet “thud” that very few are open to:)
Just so others can see GDX 2008 tag of the 50sma & MACD cross that you are talking about . Ittagged the 50sma on day 27 back then, and the 3rd daily cycle went to new highs.
I cant say for sure if this is like 2012 bear mkt rally, or 2008 lows, but as you mentioned, 2008 lows did drop back to the 50sma.. We’ll see.
Thanks for doing that, Alex.
Thanks for the great targets and sharing of thoughts. Really helps to avoid losses and look forward to upcoming set ups. Good to hear you were able to drive yesterday with the large snow accumulation you had.
Thx Shermo- yes, I’m looking forward to some set ups too. really just looking forward to seeing how all of this plays out.
And yes, they cleaned up the roads pretty good. I have 4 wheel drive too, that helps a lot.
Alex, Curious if you will be looking to purchase any of these on the upcoming cycle low: UGLD, DGP or GLD?
Not personally
I usually trade the miners , they have more %-Gain .
UGLD up 50% from lows – DGP around 35%
JNUG was up 150%. NUGT was 135% – riskier on the downside, but I can trade with less money in JNUG / NUGT and still make greater gains.
Just another thing to look at Alex but in the bear camp: a clear H&S pattern on GDXJ which has now broken through the neckline should we open where the premarket is indicating. Many will be shorting that pattern is my guess.However, to me the difference between now and September 2012 where we created that right shoulder completing a massive H&S patten is sentiment. (link:http://bigcharts.marketwatch.com/advchart/frames/frames.asp?show=&insttype=Index&symb=hui&x=37&y=4&time=100&startdate=11%2F4%2F2008&enddate=1%2F29%2F2013&freq=2&compidx=aaaaa%3A0&comptemptext=&comp=none&ma=0&maval=9&uf=0&lf=1&lf2=0&lf3=0&type=2&style=320&size=2&timeFrameToggle=false&compareToToggle=false&indicatorsToggle=false&chartStyleToggle=false&state=8) Back then it was only a “correction.” When that pattern finally played out to the downside, we knew otherwise. Now, we’ve been conditioned for the next shoe to drop. But, that next shoe may be the equity markets where we’ve been conditioned to buy the dips-just the opposite of the miners. Thanks for spotting that Alex! P.S Not sure that link worked out.
Got the HUI on that link.
As for these mkts, I have really tried to be patient before shorting this toppy looking consolidation. I am not usually as good at timing shorting for some reason, it seems to be a longer process and can drag on until it finally gives away. so I need to take it slow & build position, but I really feel that these mkts want to test that OCT high volume reversal area.
And those charts of PG, MSFT, RDWR, etc etc are just looking like important signs at this point.
Sorry! Here’s the link. http://bigcharts.marketwatch.com/advchart/frames/frames.asp?show=&insttype=Fund&symb=gdx&x=48&y=16&time=100&startdate=11%2F4%2F2008&enddate=10%2F29%2F2012&freq=2&compidx=aaaaa%3A0&comptemptext=&comp=none&ma=0&maval=9&uf=0&lf=1&lf2=0&lf3=0&type=2&style=320&size=2&timeFrameToggle=false&compareToToggle=false&indicatorsToggle=false&chartStyleToggle=false&state=8
Got the GDX on that one. Are you showing me the H&S
Just saw this: yes. H (65) is Sept 2011. L shoulder (52) is July or so 2010. R shoulder(52) is September 2012. Both shoulder formed from the 40 area which then formed the neck. Price objective was 15ish 65 (head)-40 (neck)=25. 40 (neck)-25=15. That’s how I did it anyway.
Good Morning Alex,
I beleive I have a Head & Shoulder Neckline break on SPX & DJIA.
SPX 1st shoulder at 2079. Head at 2093. 2nd shoulder at 2064.
This may bring the SPX down to the 1870 level.
THX KEN
I’ll check it out .
This is sure looking like a quick drop to a cycle low. If so it should complete by tomorrow and then one more strong push up. Gold down 20$ now silver 80 cents.
Yes, Quick slam like you often see into a DCL. See the silver chart below
I’m waiting for a reversal that holds though. I dont want to buy alone, I want to see REAL BUYERS step in first , reverse things, and I want it to hold into the close.
GDX holding up better than GDXJ ( GDXJ is already at its 50sma…so I want to see if GDXJ breaks that).
$GOLD can go to $1240 & still look good, and its 50sma is closer to $1220
right on….. i luv this service CF. tx
THX HEIDI –
Tricky moves in this tricky mkt : ) trying to keep alert to possibilities without jeopardizing fund or my sanity : )
Now after I’m a hour I see UGAZ is down 17% ALEX.
Difficult question: Do you think it will a bit go higher from here, or do I have to take my lose here (1000 dollar) Could it be a shake out, and then go higher, I don’t know.
If it were you Alex, what should you do?
Hope you answer soon.
I stopped out of UNG. That was my plan when I (re)bought on the 21st and I’m sticking to it. I’ve learned that not having or following a plan has usually cost me pain.
JT
Thats exactly right. No one will ever get every trade correctly , and if you enter a trade and it isnt doing what you expected it to when you entered the trade? ….it may just do the exact opposite. Best to just stop out & re-enter if opportunity arises or grab a better set up elsewhere.
Nice job
In my opinion, You must sell. Or let me say…I would be stopped out. It broke support.
It looks to be breaking down with volume too. EVEN iF it was a shake out and pops back above support…you should sell and ONLY re-buy if it was a shake out. If you wait and it keeps breaking down….you could be down 17% tomorrow too.
this chart is UNG, but they’re similar
I can’t believe how hideously bad Nat gas has been with huge snowstorms all around. But today’s storage report missed pretty bad, that is why sell off. Nat gas may just need to be hands off for awhile
Also realized on UNG chart there is a double gap (left it up and down) just above 15. Lots of cold in future for East, NE. May try to fill that if it gets going but might be a quick trade only. Would look for some upward momentum first.
ALEX….. I DID…., from the bottom off my heart I thank-you very much for your fantastic work and fast service. Again THANKS.
GDX during this recent runup everytime we have had a sell off, its gone down close to a double bottom. We are there now. Could run up from here. See attached 2hr chart GDX from the mid December lows. Thoughts?
Where the chart at?:)
Cant you see it above? GDX 2 hr chart.
See it now. Just appeared. Thanks
I’m sorry. I don’t. In your comments? Maybe it’s on my end, Bill. No worries.
I couldnt see it either, until you refresh the entire page. Sometimes the comments come up , but charts wont unless you refresh.
Yes, that’s what I did. I recall you had a similar issue, Alex. Just a matter of “refreshing” I think it was.
I don’t like the lower high?
Lower high and lower low. Its a tough call, but risky without any follow thru to the upside.
GDX 15min Chart above the 10sma, MACD crossing up? BOTTOM?
Hi Bill,
When I look at a 15 minute chart like this, it is oversold on 15 minute time frame, but it can run up to the top of the bollinger band and go sideways then become over bought, so I also look at a 1 hr and 4 hr etc.
So I can say it looks like at least a double bottom on a 15 minute time frame, but cant say double bottom and only higher from here. Still needs a little babysitting – hope that helps?
I bought in on one account. Gold hit my initial target and the stocks haven’t gotten clobbered (yet). Bought some NUGT but have stop in at breakeven. Might need another day or two to see how it resolves but so far looks ok.
That was a BIG move off the lows! Should at least keep shorts honest here. Is it time for next buy??
Alex, It helps, thanks. Looks like we above 20sma on the 15min chart now. Picking up steam. Bought earlier and got stopped out, frustrating because I locked in the losses that would now be big gains.
I hear ya.
Looking at GDX it hit the 20sma and turned up. Looking at GDXJ it tagged the 50sma and turned up.
F.W.I.W. – TZA hit the 50sma and turned down, now red. QQQ reversed up at recent lows, possibly going back to the 50sma (A-g-a-i-n) .
I will be watching how QQQ bounces tomorrow and may add to my TZA if it bounces on light volume to the 50sma .
LOOK AT QCOM , YHOO , BABA , DSKY, FTNT, SGI
What is propping this NASDAQup? Bio tech stokcs?
GDX and GLD touched the 20dma, GDXJ at the 50ma…..I’m thinking we are close to a DCL….Looking at the 60 min. and 10 min time frames, and they look to be turning up, but on low volume. What do you need to see to start buying miners again? When you do start buying could you let us know….thanks
I just wrote something similar lower.
I look for these things and also I want to see individual miners resist selling while GOLD is down $30 ( P.s. see GFI, BTG, IAG, NG) they are no longer selling off while Gold is down $28
LOOKING at GFI, SA , BTG , NG – these stocks are not selling off with GOLD down $30 . THIS could be a sign of buyers accumulating.
I’m guessing we want to see the miners (GDX) bust through the 10sma at least, a more positive sign would be a bust above the 20sma? Alex chime in? I bought NUGT here, maybe a mistake. I’m going to hold overnight, which I normally don’t do.
You may get some more downside, but I think things look pretty close. Some individual Miners starting to see Buying
I Just bought a couple of small positions too off of that bounce & pullback. It flagged on a 5 minute chart. we still MIGHT test the lows or go lower tomorrow, so I’m just getting a little skin in the game. .
Harry, thanks for posting, that is exactly what I was going to say! Gold came close to 20 but not all the way there – is in initial support zone. Bears are already growling again. Certianly bears watching. I didn’t buy anything yet but would love to catch the next move if we get one.
EXK looks to have great symmetry. It stuck the 50 creating that R shoulder which looks to be the mirror image of its L shoulder. That may be a clue as to what happens next.
Check out GFI …It went Green with GOLD down $30