Quick Friday Update
I dont always see the need to post Friday , because Thursdays report covers my expectations and Friday usually doesnt leave me with much to say until the big weekend report. Today I just felt the need for a quick update because 2 questions arise…
1. Has anything changed?
2. Do you want to hold over the weekend? QUICK commentary
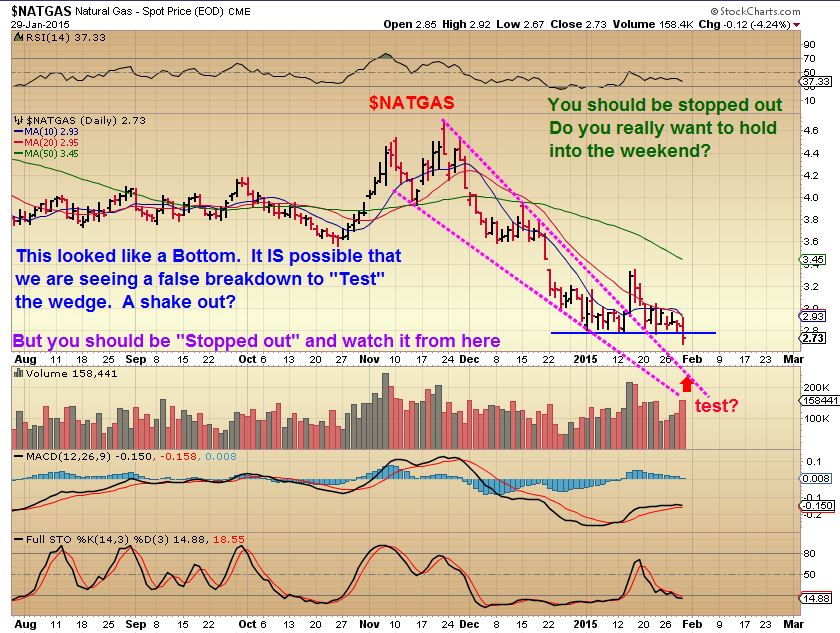
$NATGAS – The “Floor” broke down. May just be a ‘test’, but you should be out
SPX/QQQ/DJIA …
Sorry, No Audio
The Futures are down as I write . Up 1 day , Down the next…Whats new there, right? We are in a big consolidation and it looks bearish when you look at YHOO, MSFT, BABA, GOOG, QCOM, etc etc . Look those charts up…. I dont know whats holding things up right now. OVERALL I am still expecting a positive year for 2015 in the general markets, but right now I would expect a test of the OCT high volume lows and go from there. I own a small position in TZA and will likely stop out with a close above the 50sma.
GOLD/SILVER/MINERS
The “Comments” section lit up yesterday as GOLD/SILVER , & MINERS sold off , but there began to appear signs of resistance in Miners. Miners cycle count is ahead of GOLDS, so is it possible that Miners are looking to turn higher already? It is possible, but 2 questions might be ….
1. It’s Friday – “Do I really want to hold over the weekend?”
2. “What confirms that a daily cycle low is in?” ( Why? Because that is the difference between a “SAFE” entry and a more risky one).
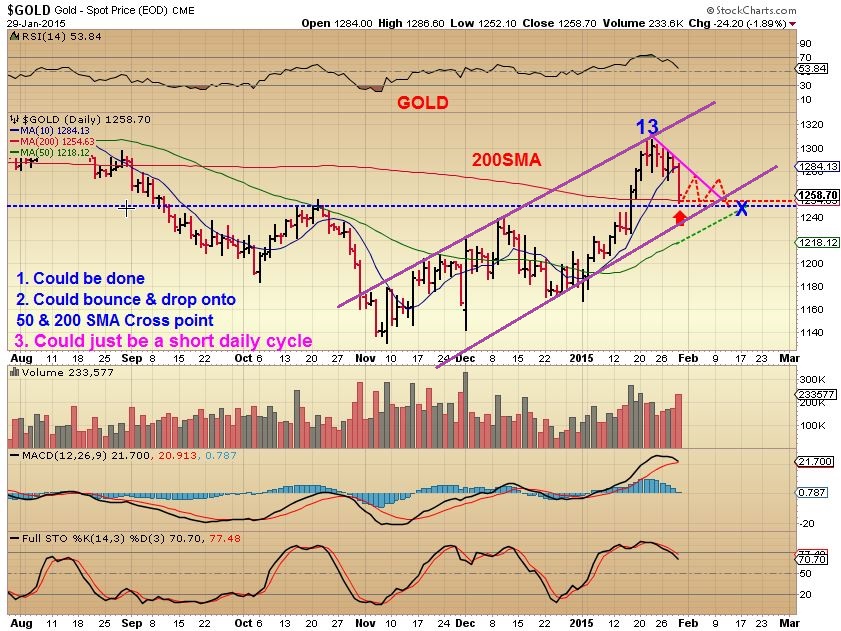
GOLD
I posted this as a 1st target $1240-$1260 / support level possibility –
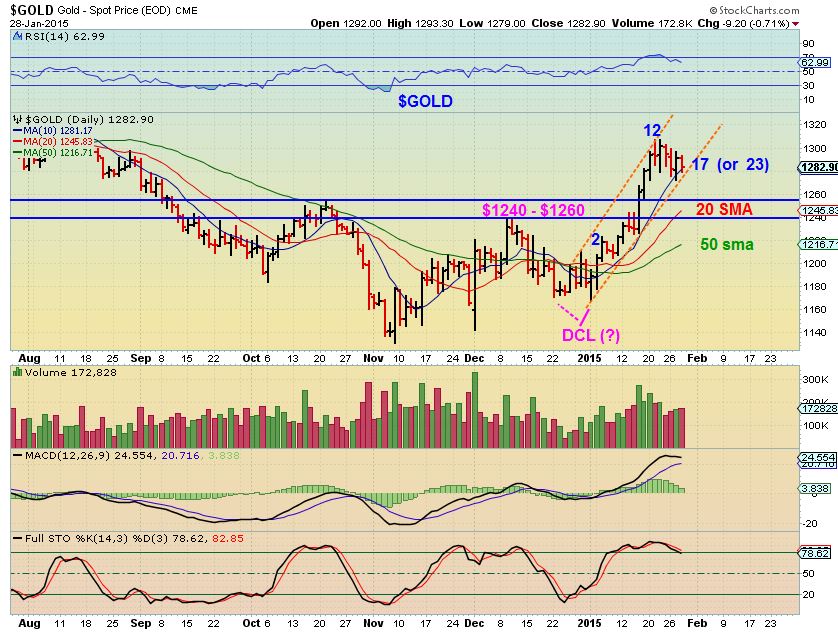
That was Fast. $1254 is also where the 200sma is.
My thinking is that the count is close for a DCL ( A trade-able low) , however to be realistic
1. We may bounce & see another leg down to the 50sma
2. Could go sideways next week until the 50sma catches up (Shown below)
3. There could be a large upward channel that forms. ( Purple channel trend line is solid).
SO watch the PINK trend line . When that is broken convincingly, the DCL could be in
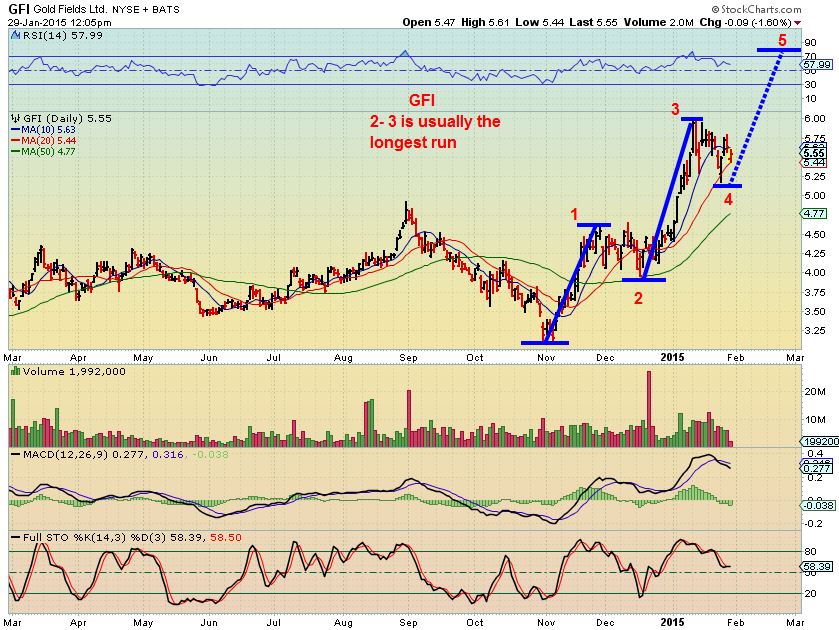
Miners – Many were buzzing when Miners started to bounce as Gold was still selling off. Yes, thats a good sign, and when you see 3 or 4 Miners resisting the sell off in Gold. Gold was down $30 and GFI turned& closed Green. NG , HMY , IAG , EGO and a few more also Turned green for a while . THATS a good sign, but doesnt mean by itself that the Miners lows are in.
IMPORTANT questions for you. DO I want to buy on Friday and hold over the weekend, knowing that GOLD could open $30 down From Sunday night to Monday? Also – AM I a high risk trader or do I want to take a position that I dont have to babysit all day, because I work full-time ? DO I realize that this is going to be the 3rd daily Cycle…usually very weak in a bear mkt rally ( Could ‘peak’ & roll over quite quickly) , and with that in mind , do I just want to save my money and wait for the next ICL? That would be a lower risk , higher profitable Trade.
I know I have all types of traders / investors here, so after you answer those questions for yourself I will say that as for me…. ” I am an active Trader. “ I am likely different from many of you, I could be trading…buying & selling on a daily basis , so when I hear “Tell us when you are buying” – It should be said that I am a trader. I am often buying & selling SOMETHING each day. It doesnt mean that I think everyone should be , because circumstances vary. At Chartfreak, my goal is to tell you when a trade is a bit safer. If you are an active “Trader” too , then you likely know from my reports when I feel we are in a lower risk time period, or late in a daily cycle , or at a more bullish time with likely less chance of downside, etc, etc and you can trade with that in mind. Lets look at Miners .
GDX – reminder that I posted this JAN 20 . The $20 area support.
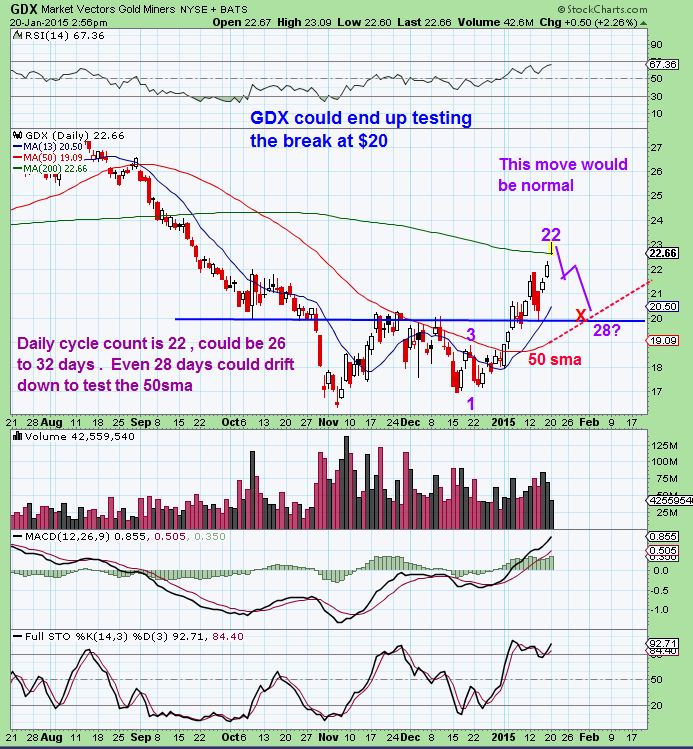
Wednesdays chart – $20 still support & 50sma possible.
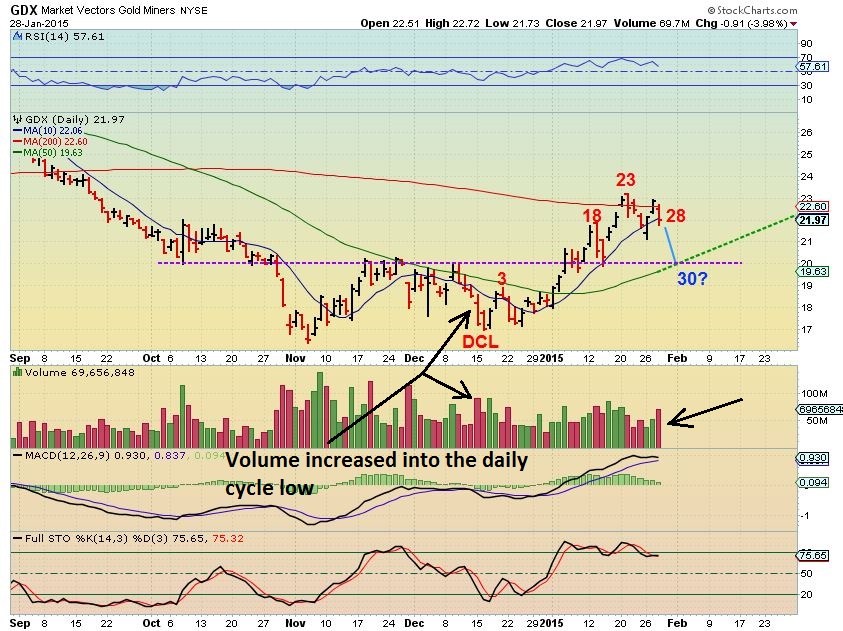
Yesterday after the close. GDX hit the 20sma and held / reversed a bit. GDXJ hit the 50sma ( Broke it and recovered). Questions on the comments board were “IS THAT IT?”
These is no way to know that intraday. The SAFER buy is if …
1. You get a reversal candle ( yesterday could be a doji reversal).
2. Then you get above that candles high the next day & close there. Some will buy this with a stop below yesterday
3. Safer buy is a break of the over head trend line (Blue dotted on the above chart)
BY THE TIME WE BREAK THE OVERHEAD TREND LINE , however, we could be on day 3 or 4 in the 3rd daily cycle and it isnt as low risk if this is just another bear market rally. If we are now in a Bullish run, we could go much higher quickly . Problem is that we wont know if this is a bear mkt rally like 2012 or lows like 2008 until this plays out further.
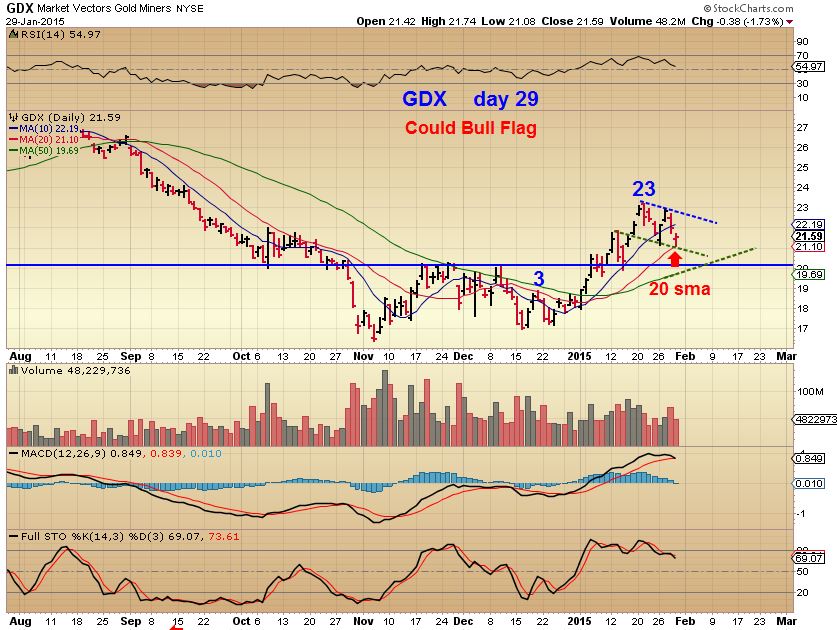
CONCLUSION: This is the tricky part…entering a 3rd daily cycle. GDX is on day 29 and that could have been the low, many Miners began to resist the $30 sell off in $gold. Its not a proven reversal yet though, and we COULD sell off further next week also. Higher risk traders could begin to buy their favorite Miners if they individually show signs of strength and dont mind buying on a Friday. I bought some yesterday, but may sell today? Hold over the weekend? My risk level is different than yours. Look at the above chart. We also could form a channel down to the 50sma as drawn with bounces along the way next week. We just bounced for 2 days and then dropped for 2 days, we could do that again here. THAT could be a day 33 or 34 Daily cycle low next week, while GOLD goes to day 23 or so. SO Higher risk traders can buy here, but then you’ll have to hold over the weekend and possibly face drawdown. Those waiting for a DAILY CYCLE LOW need to see the overhead trend line broken, but being a 3rd daily cycle, its not completely a lower risk trade. It Could top quickly & Roll over. Some are fine with that, others are not and may need to wait until we see if the bear mkt rallies are done and this is a legit start of a bull run with plenty of opportunity along the way. Those investors will want to wait until the next ICL…which could come this spring in another month or two.
Trade idea for traders, Things that I look for, but remember it is Friday . Some Miners look pretty strong, and This was GFI in GOLDS $30 sell off yesterday.
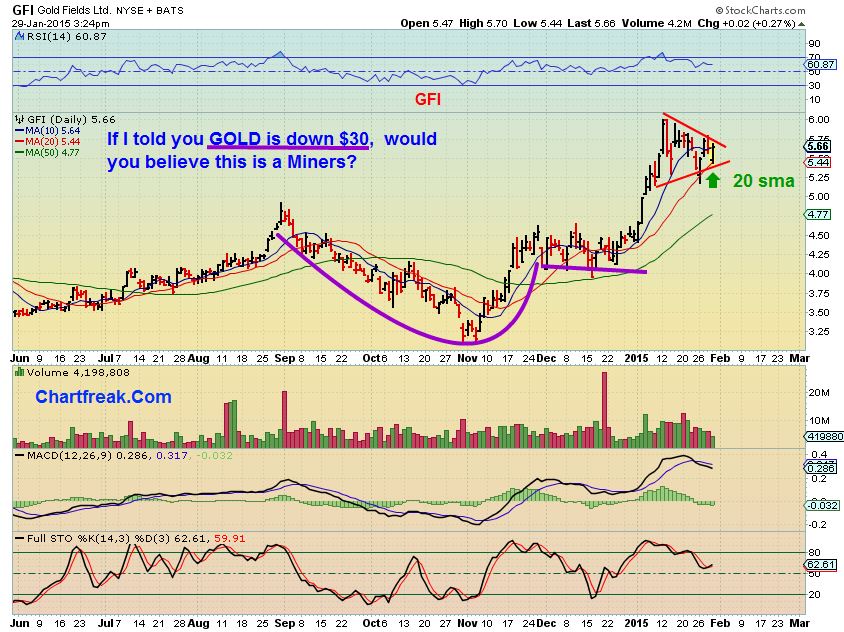
GFI held the 20sma and reversed higher. I drew this at Noon before it went Green. GFI and HMY are acting strong, so If we aren’t in just a bear mkt rally, and if GFI is a new uptrend, it could be bought here with a stop at the 20sma.
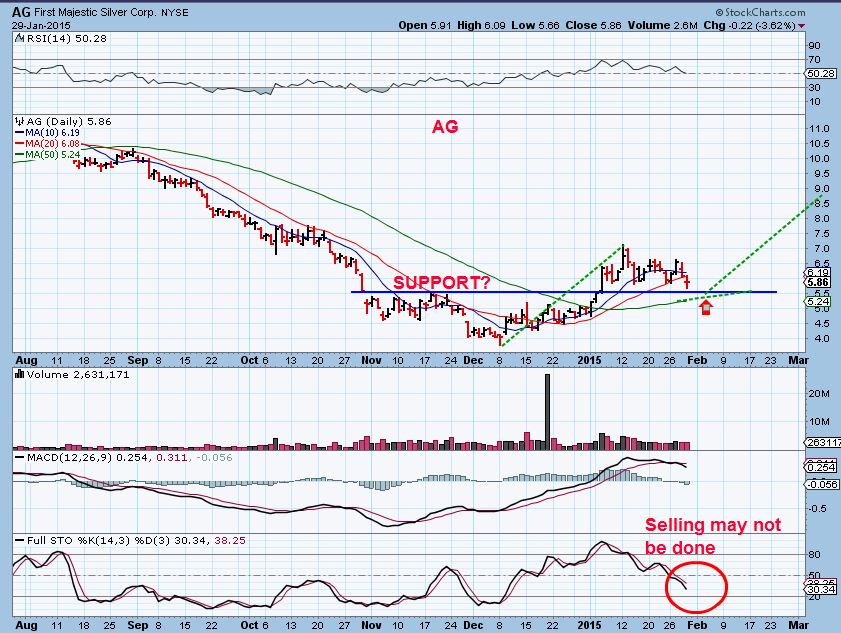
Silver stock “AG” (I own it) has dropped from $7+ to $5+ , but looks fairly stable
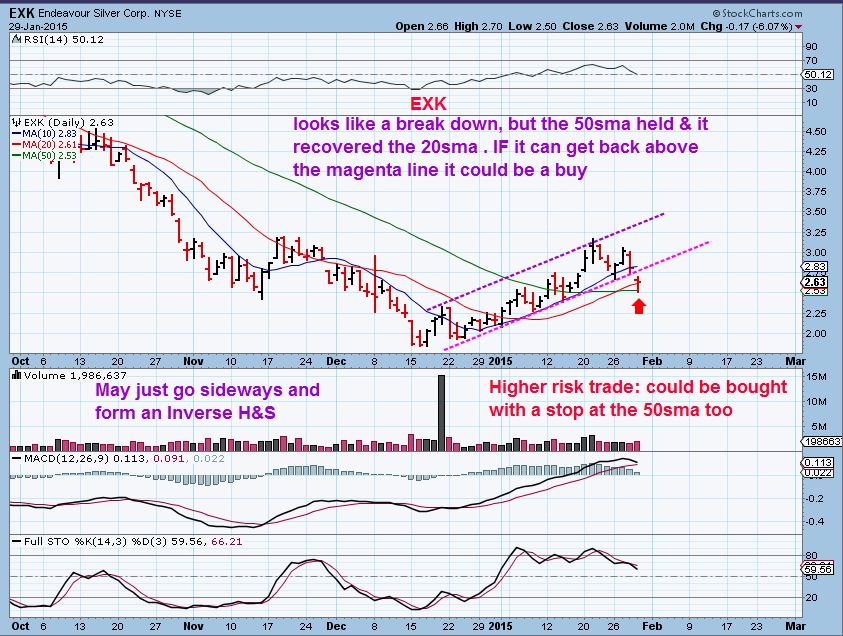
EXK – 50sma held, but is it breaking down? Traders could buy with a stop at the 50sma . Or wait for a recovery back inside the channel

EXXI -10% then 0.0% on the day. Quite a comeback…
Yes I know. Nice. EXXI, REXX, KEG, HK, AXAS even XLE dropped and reversed to green. The Miners did that little shake out move in Nov to DEC lows too. Possibly the lows really may be in on the energy …I’m keeping my eye on them
Thanks Alex, I have’t had much time to comment but wanted to say good job with your analysis. Great value here!
Hey Simonsays
My old friend- thanks a lot and hope all is well with you!
ALEX….. well said, and I like your honestly.
Wish you a healthy and blessed weekend with your family.
Thx Geurt – you too!
The miners appear to be gaining ground. The 5 minute chart (see chart below) looks like a bull flag with a projection to $17.85. I know its not GDX but it should be similar. I kep my NUGT over night, but will probably sell today and buy back next week. Alex, you are right about the risk of holding over the weekend.
GDX at a crucial trend line here. Lets hope we bust through! See 1hr chart below..
Hey Bill,
I’m watching the same types of things : )
Bill: really nice charts. Thanks for drawing them. They serve as a good guidance.
Could another Bull flag be forming? 3 drive to a top?
Alex, I sold my AG, but I am still holding BAS, EXXI, and GDP. They came back some, but are looking a little weak this morning. With NATGAS selling down, do you think I can expect similar results from these stocks?
Looks like I should have kept AG, doing well. EXXI and BAS the charts look alright, GDP has broken the low and looks awful. The question is will they all start getting weaker like GDP or will GDP turnaround like the other two? Comments, thoughts? Anyone?
Bill: no thoughts on energy although I do own some NOG. I mentioned this yesterday as an observation. Alex may have a different opinion so i’d defer to him. By way of two examples, look at the L and R shoulders of EXK. Mirror images. Almost exact same structure and duration. Same with AG in terms of its own structure and duration. Coincidence? That symmetry suggests to me how we came down is how we are going back up. At least to the 200 and above on this move is my thought. To confirm we need some volume. Probably still in “not sure this is the bottom” thinking. So we’ll see how this shapes up EOD.
Mark, this what you’re thinking (see chart) daily? I like it.
I had one of those in my report today : ) EXK and mentioned possible inverse H&S could form too . Looks like We’re all on the same page : )
( Also trying to Keep in mind that this could be a bounce today and drop next week to the real DCL)
YES! EXACTLY. Love that symmetry there. To me just reinforces the RH&S pattern. This is a late bloomer as compared to AG or CDE which have had an arguably better run. Alex raises a good point about a move into the DCL next week. In general, it’s the managing of the expectations that’s most important with these setups. It may not do exactly what we would like when we want it to. Market can teach so many valuable;e lessons in life if we’re listening. GFI-now and steady in that base. I would have missed that South African (I think it is) miner.
GFI-“slow” and steady…
They seem to kind of be doing their own thing, some better than others.
Look at PQ and HERO…Then look at EXXI and KEG. I think they may need time
PQ looks awful, HERO looks like its forming a base. EXXI and KEG look alright. Thanks for checking in
I think that a few look “o.K.” , maybe still look to be bottoming, but I really want them to prove themselves.
I do NOT like GDP today. Actually – I dont own any anymore and wont until they get back above the moving averages and show strength.
Neckline on GDXJ which broke yesterday is reversing up now and has been all morning. Needs to get back above the neck at 28 and if it can will probably produce a nice short covering rally. Also, GFI I believe has a R H&S projection around 6.05 on this move should that pattern play out. It would be nice if it could continue its R shoulder formation through the day and into early next week even better. Just a thought: IF we are truly experiencing a change of character in these markets, I would expect surprises to be on the upside such that bearish formations on the metals (such as the most recent small H&S top on GDXJ formed over the month of January which broke the neckline yesterday) should NOT play out to fruition.
Mark, we would have to get to around $24 to reach a symmetric H&S pattern and a good move up? Correct? Can you see the chart?
Can see it. Thanks. It could go that low and still be very symmetrical. It’s not an indispensable quality of a stock or ETF for it to be “valid” for it to run up as you know. I was simply looking at AG and EXK and noting their ALREADY symmetrical patterns which in my minds eye hold promise.Thanks for drawing that BTW. Is that where you were going?:) Mind you: I’ve never seen Alex speak of this before to my memory so this is my own added nuisance from my own observations.
Alex, thanks for taking time to send out update this morning. Quick reports always appreciated, especially as so much has happened this week. GDX probed lows early and then moved above yesterday’s high with conviction so I jumped back in there and with SSRI (silver drubbing yest seemed a bit overdone for one move).
Also agree General markets seem sickly and cannot gain traction. Check 150 SMA on S&P, been propping it up recently and may serve as next bounce area next week, currently about 1985 or so. I went short for potential rollover, may get out and re-assess if bounces before trying to flush to OCT lows
Man! I saw it flash back to breakeven and went to double down as market rolled over late, but used a limit that didn’t fill (by a few cents), shouldn’t have gone ‘market’. Or otherwise I’d be eating steak tonight instead of chicken!
Quite the spike in oil
Anyone here own GURE? : )
Alex, what do you think, is this possible? What was once support is now resistance, and we are headed lower on GDX (1 hr chart below)? Sold all my NUGT btw. Good day, even BAS is cooperating.
Bill , when you say ‘what was support is now resistance’. Yes that can happen, but your chart shows that it didnt act as resistance by resisting price, right?. It recovered it if I am seeing that right.
I drew this an hr ago for someone else. Its a 4 hr GDX, ( but price is higher now than when I drew it) . GDX is regained the 10sma – then lost it again and GDXJ looks like it might re-gain the 20sma. The close will be the final on that,
but also … look at charts of GFI , HMY, ,CDE. Pretty Strong, almost at highs .
We can wait until Monday to see how Gold trades Sunday night, but it looks more bullish than bearish at this point. I am still in my positions and TZA and may just hold thru the wkend.
Alex, my blue line isn’t perfectly drawn. Yes, GDX did get over it but just barely. I was just thinking its the first time GDX has been below it in a while. You know, sometimes prices go either side of the trend line to fool investors. I’m thinking we might see some downside next week. Still have the lower highs and lows. I’m not liking that. Should have kept my AG, good day for that as well. I do a lot of short term trading. When I make some $$$ I don’t like to give it back so I tend to get out. Especially with DUST and NUGT
Pocket it while you can : )
In a dcl, trend lines are usually broken and then recovered. You can wait for the recovery or other indications that the selling is over.
I was getting close to buying some miners yesterday before the close, It looked like miners had put in there DCL, but I’ve gotten burnt by miners so many times in the last year, I didn’t pull the trigger….If I buy now I’m afraid I’ll just get shook out. I guess I’ll just wait for equities to bottom.
I held my positions , including TZA.
Weekend report will cover MKTS and Metals & that large OIL spike
Harry, I definitely understand. I watched test support then reverse higher this morning but was really slow to jump in b/c was afraid I’d get burned. Again. But I Just trusted there was decent enough chance DCL was in to justify a small position. When it held support and went over yesterday’s high, that was the buy for me (after staring at the screen for another 30 min just to make sure!). GL
Alex- thoughts on today’s action in Gdx.. Seems like we had the dcl.. So could be 5-7 days before a top?
Miners looked really good, and some exceptionally strong! 5-8 days IF we are still in a bear mkt rally. If we are entering a bull phase ( like 2008 bottom or 2000 bottom) even the 3rd daily cycle can run nicely . We just have to remain cautious , so I will keep saying 5-8 days raise stops .
RM, I went in today based on Alex’s note above about #1) dojo and #2) 2nd day closes above previous day high. So I think it’s in. We’ll know next week for sure!