Weeks ago I mentioned that sometimes when the markets are breaking to new highs on weakness, it can cause volatility and lack of direction. Do you feel that we are seeing that now? This chart from DEC 23 showed what I was referring to as we broke to new highs with weakness. I was afraid that we might be heading there again.
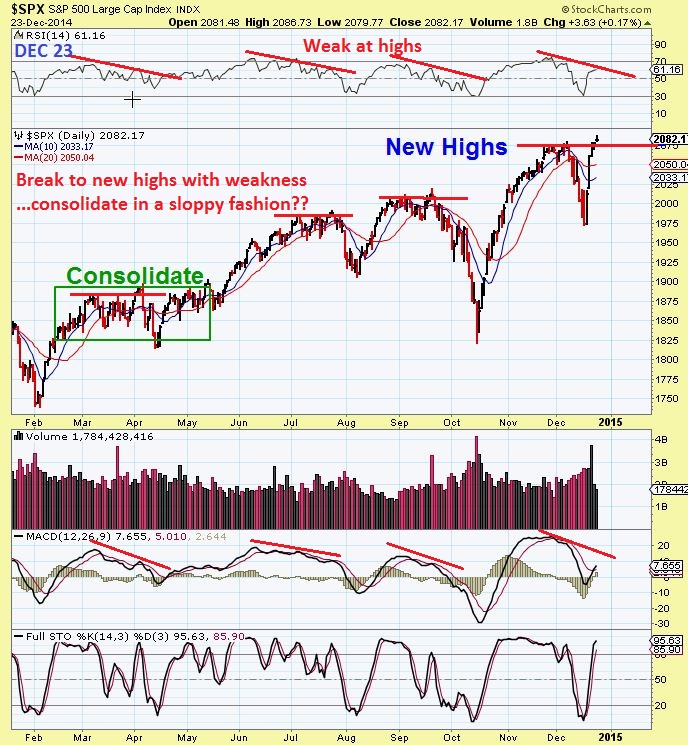
Its can be hard to make good Money when the volatility has markets ( say the Dow for example ) moving up & down 100’s of points daily. Down 300 , up 200, down 300, up 320, down 250, etc etc etc . Yesterday the Markets re-gained the 50sma and today they are giving it up again. Volume is a tad heavyish so far today and I am again watching the close to see if we get an idea what to expect going forward…
I will say this, the weekly candles on SPY , QQQ, DIA will be important after today and so far it indicates further weakness I.M.O.
I posted some thoughts and some set ups in yesterday afternoons update , since the Mkts had a nice looking recovery. I wasnt going to post today, I was just going to do a weekend report to cover the outlook after today and maybe some buy opportunities. So last night I went through several charts and decided that I just wanted to post a few today as a possible watch list. In yesterdays afternoon report , the markets had re-gained the 50 sma and some socks looked like they may be setting up for a run higher. Todays drop will either set up another possible buy opportunity or further selling next week. So the following list are just something for you to review and maybe keep track of if you wish.
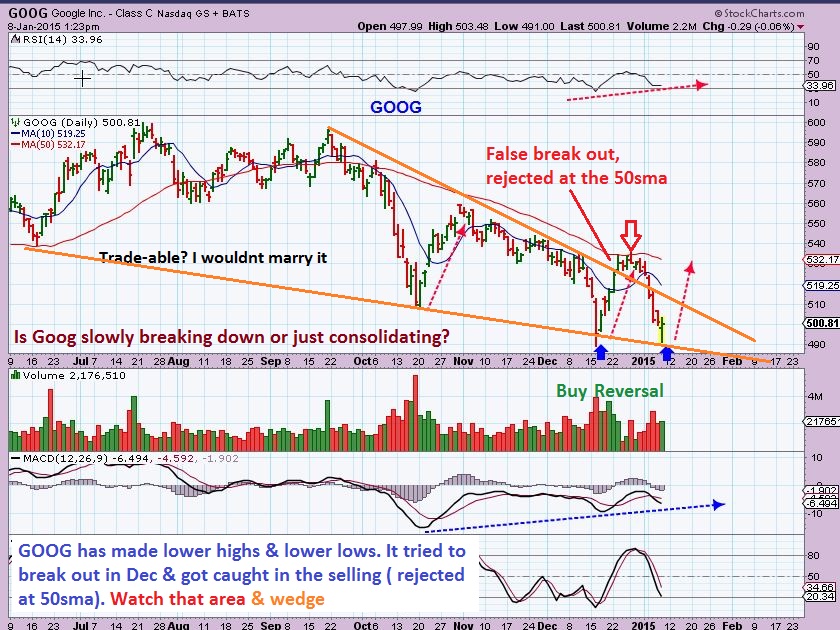
So yesterday I mentioned that some reversals looked good and pointed out this chart of GOOG & it’s reversal , for example .
Today it is selling down to the orange line again. Low risk entry next week, or break down? I will say this, last night the weekly candle could have been a reversal, right now, its kind of ugly .
Well after scanning a few chart, I started again thinking about my recent theory on the markets & how we may make some nice trades going into and through 2015. In past reports I have mentioned that IWC / IWM / RUT have consolidated for a yr, and MAY be the ones that make the next run up . Microcaps and Small Caps . I posted this chart
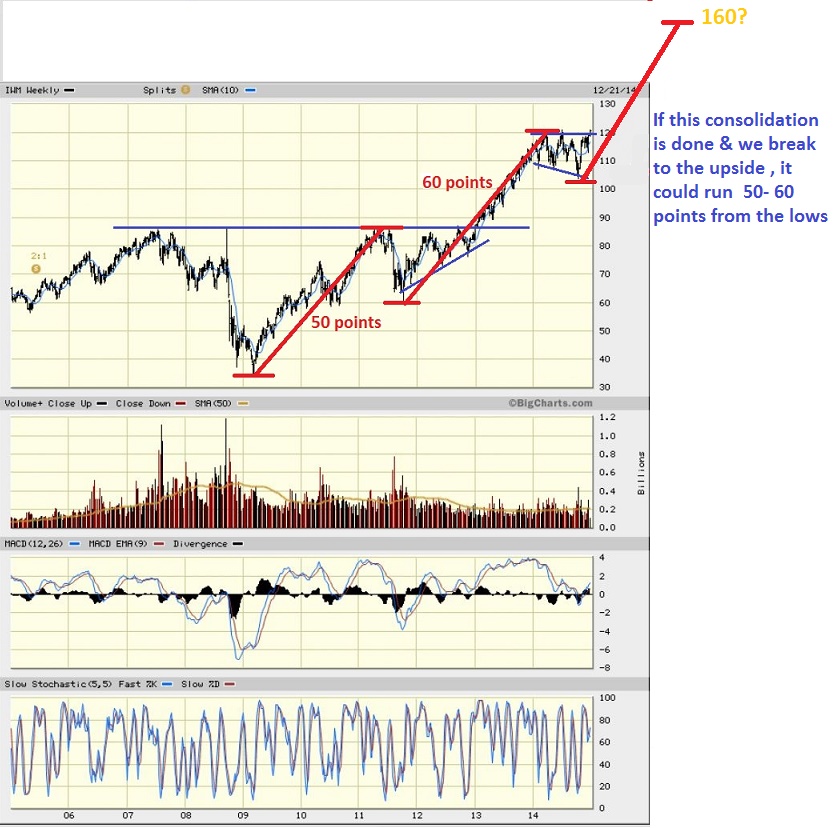
And Early Dec showed this.
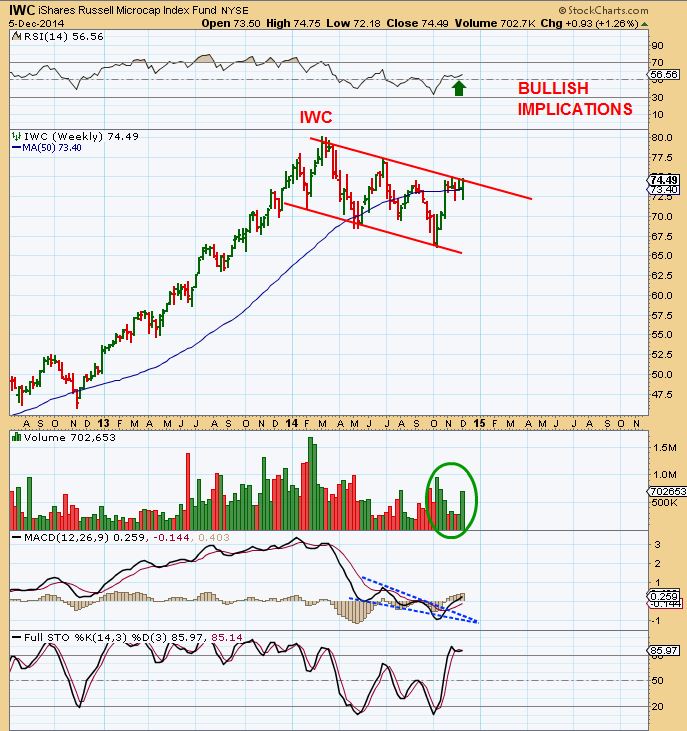
Well right now the IWC / IWM / RUT still look better than the SPX, NAZ, & DOW – so I will share a few more set up s as mentioned above, HOWEVER I am mainly focused on Miners right now as you know. I still believe that more gains can be made there , good ones %-Wise, like already seen in IAG, CDE, HL, NG, ETC
I’m not necessarily saying … “QUICK , RUN OUT AND BUY THESE” ( you could if you are a trader looking for some possible quick trades). My theory on the markets has been that we may see some great opportunities in Small Caps and Micro Caps this year. What my intent here is, is to show these types of set ups and you can monitor them going forward. They dont ALL play out fantastically, but if we get used to watching the set ups , see how they may break out, even start running up, we can gain confidence in future set ups that I point out. We can also then enter on pullbacks if they start trending higher.
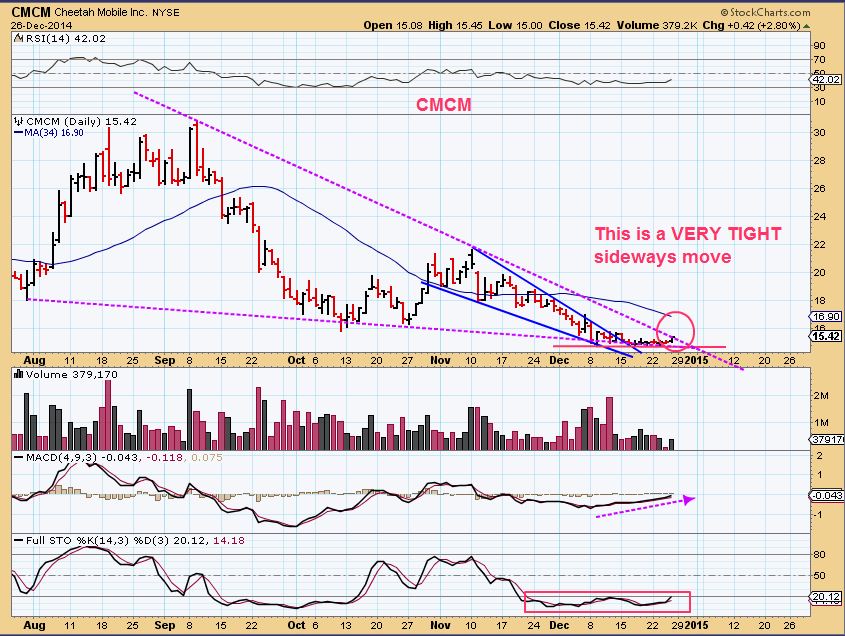
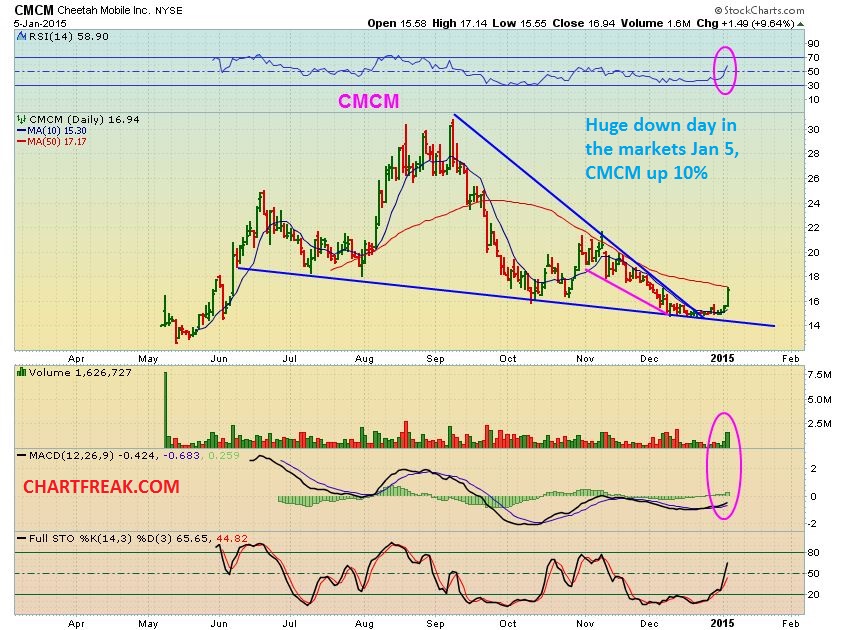
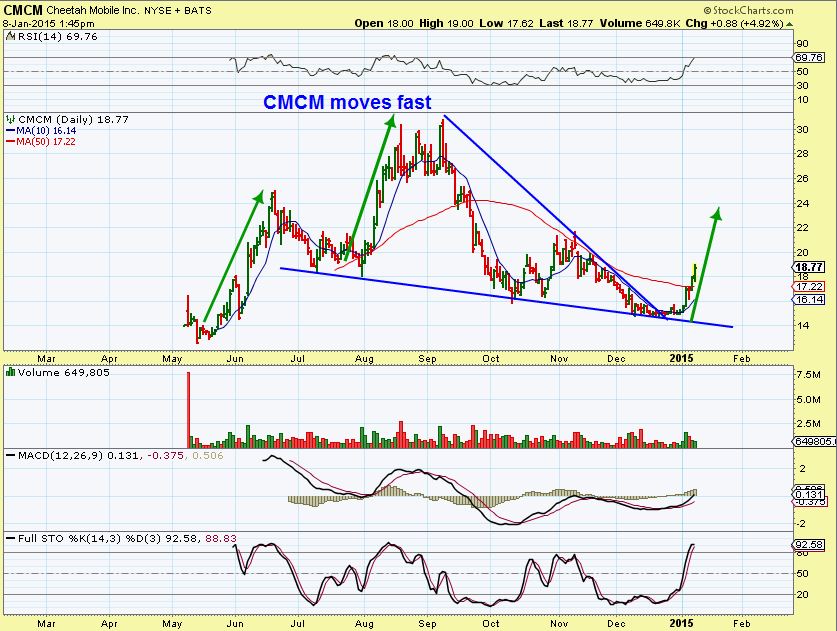
For ex: Like we did with CMCM – notice the tight set up & then the progression. I think it’ll hit $20 pretty quickly
SO lets look at charts!
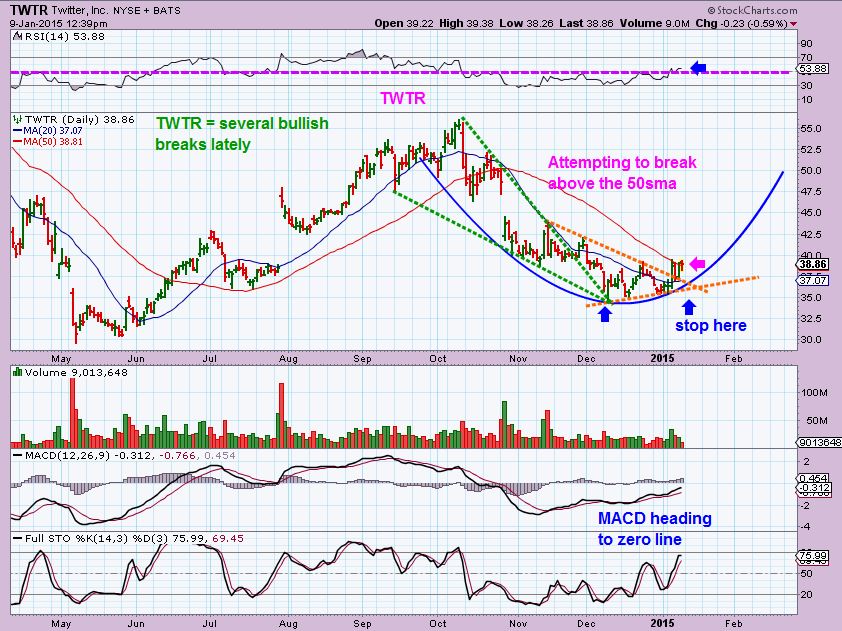
TWTR is a buy soon if it gets above the 50sma, maybe a stop below the 20sma . (A better buy is if it fell back to the Orange Lines, but it may just start going higher above the 50sma. Your stop could also be right below that triangle)
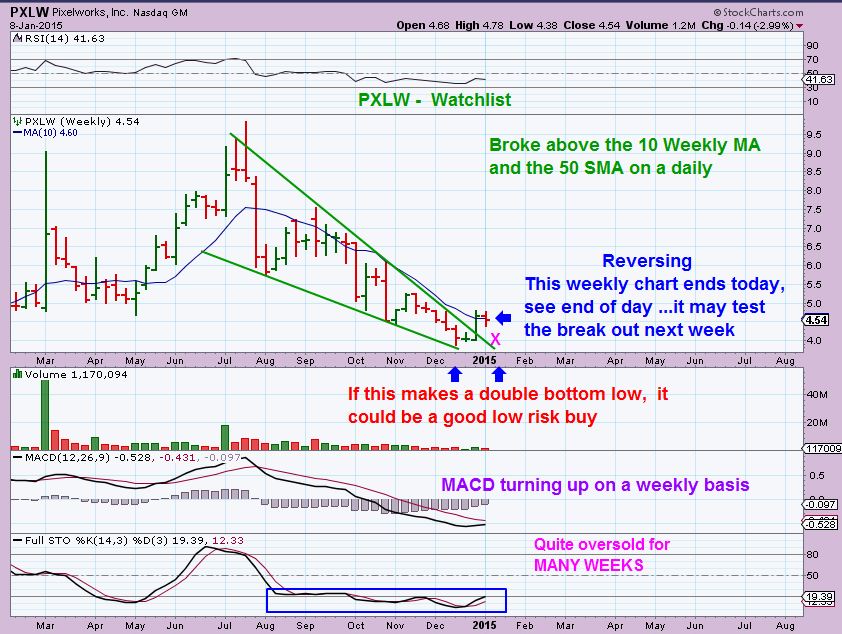
PXLW WKLY for the watch list. (On a daily it is actually bull flagging & may break higher) I have been watching this daily for some time. It seems to be bottoming, and breaking upward. As I’ve shown, they can “test” those break outs , so I am also watching in ase it dips to X.
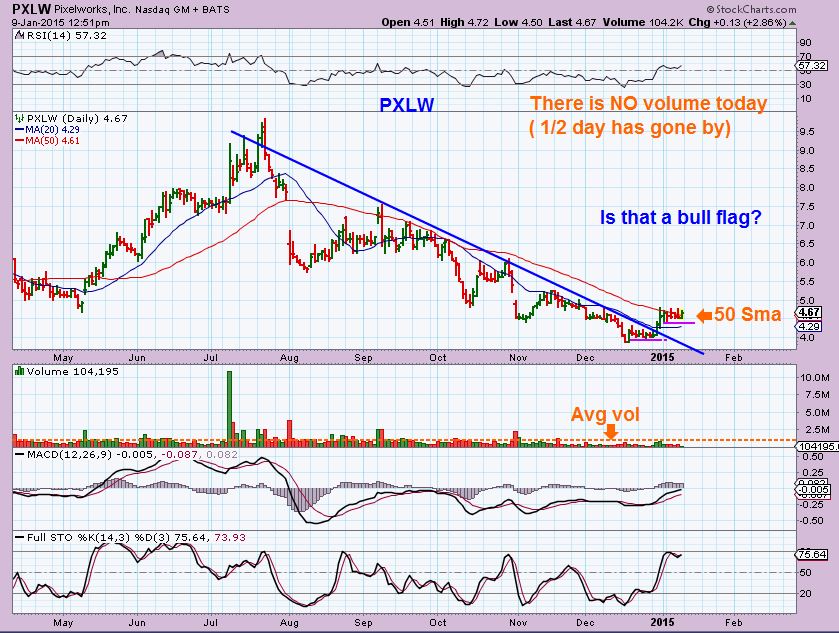
PXLW daily ( Extremely light vol today, need more buyers)
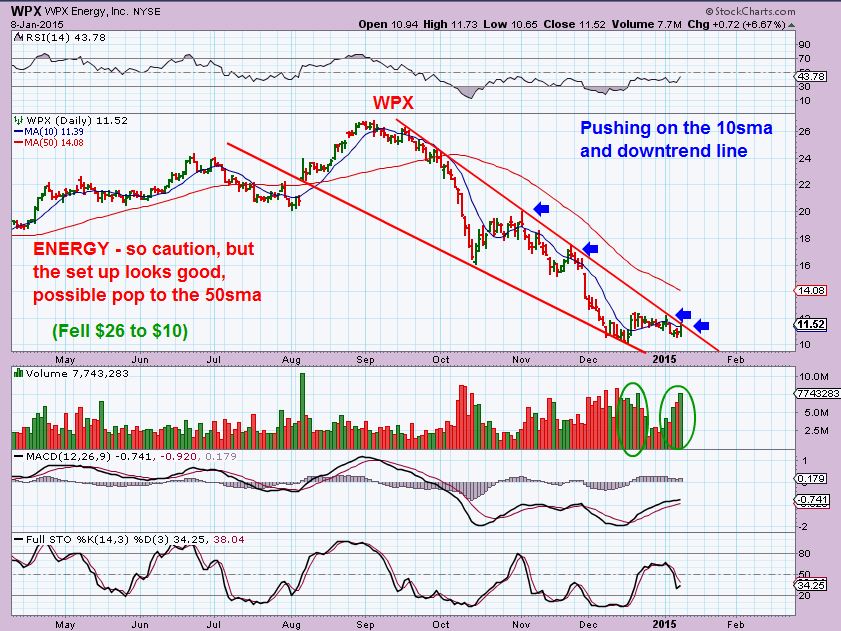
WPX- ( Watchlist) ENERGY SO CAUTION!! Dropping today on light vol. It does look to be possibly bottoming and a buy on a break out here is possible, but it’s Energy, so consider it High Risk for now. If ENERGY rebounds, this is a nice set up if these lows hold.
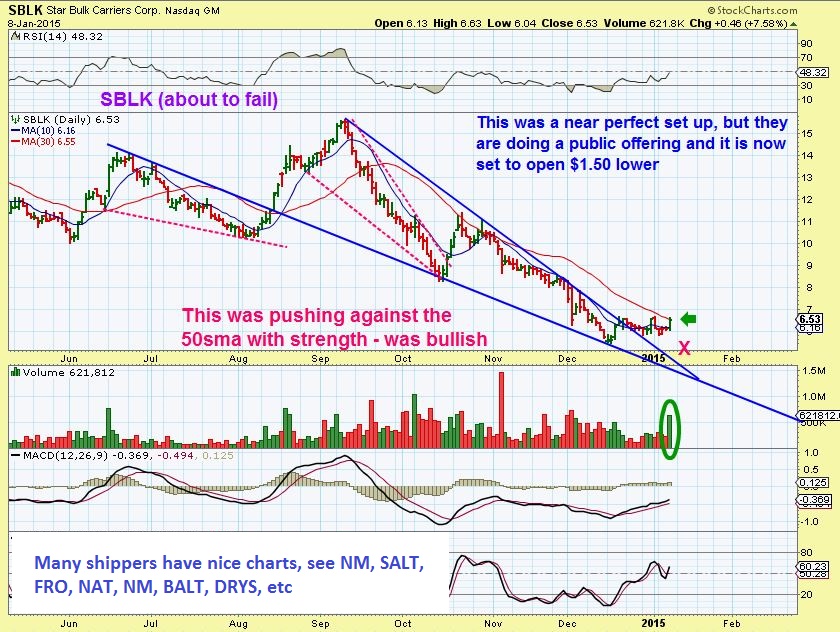
SBLK – THIS IS IMPORTANT!
LOOK UP NAT and FRO – I looked at many Shippers and some are running nicely, others seem to be bottoming. Good charts .
THIS ONE was a near perfect set up , then they did the dreaded public offering at a low price and the stock drops to that price overnight : (
I drew this chart Pre-Mkt…it is currently at new lows $5.06 (X)
Important lesson about going too heavy on 1 stock. ETF or a basket lowers risk. This “break out” looks to be heading for its “test” .
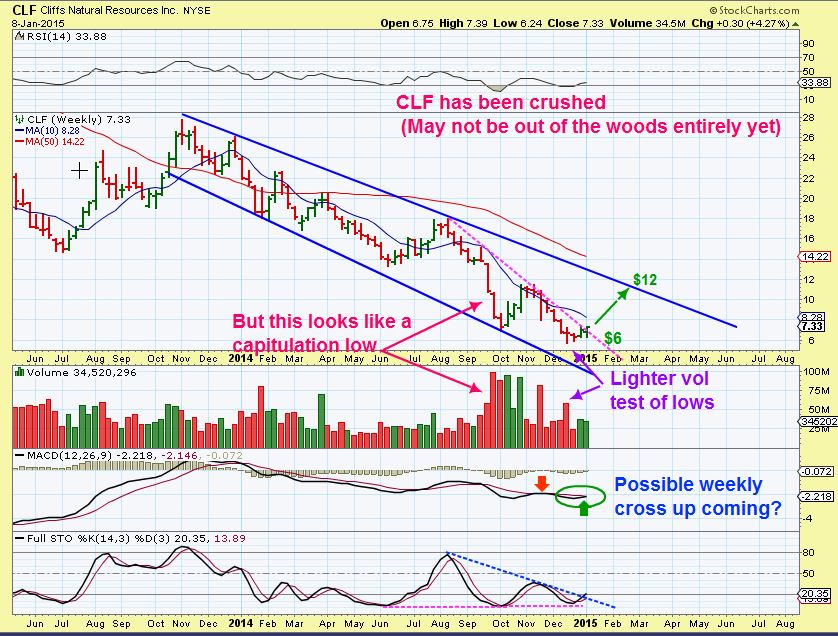
CLF WKLY- another possible risky stock , because it has been clobbered lately, but it does have the signs of a capitulation bottom and then a double bottom test. See the MAGENTA line, and its breaking above it. Its a wedge. Those are pretty good set ups and the weekly looks like it may get a MACD cross. Could run (bounce) from $6 to $12.
May also pause & find resistance at the 10WMA.
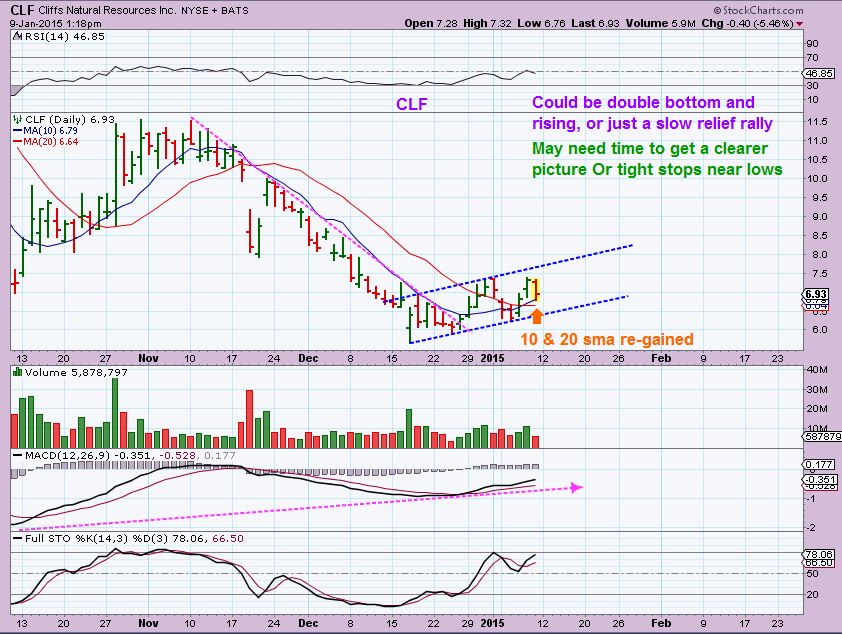
CLF DAILY – pulling back & may drop to the blue line & 20sma near $6.50
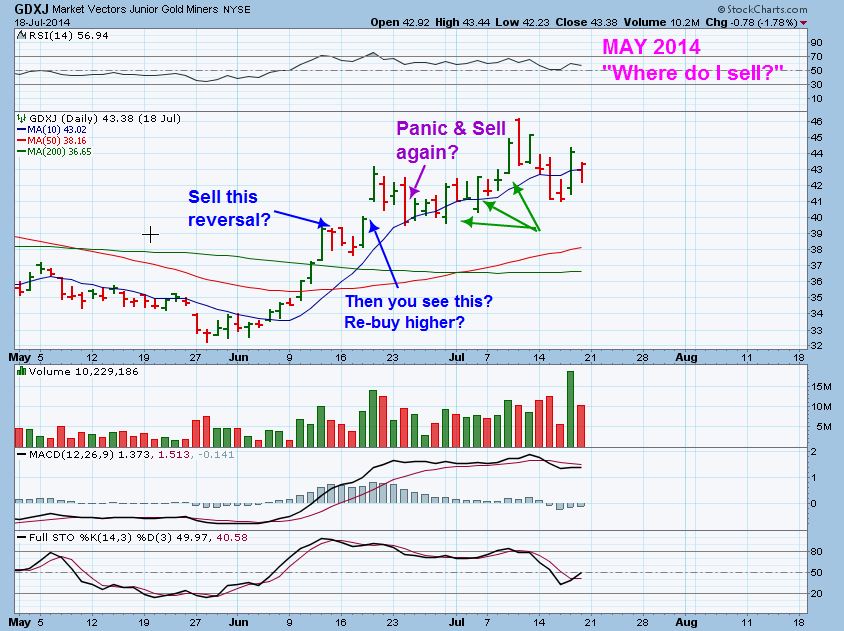
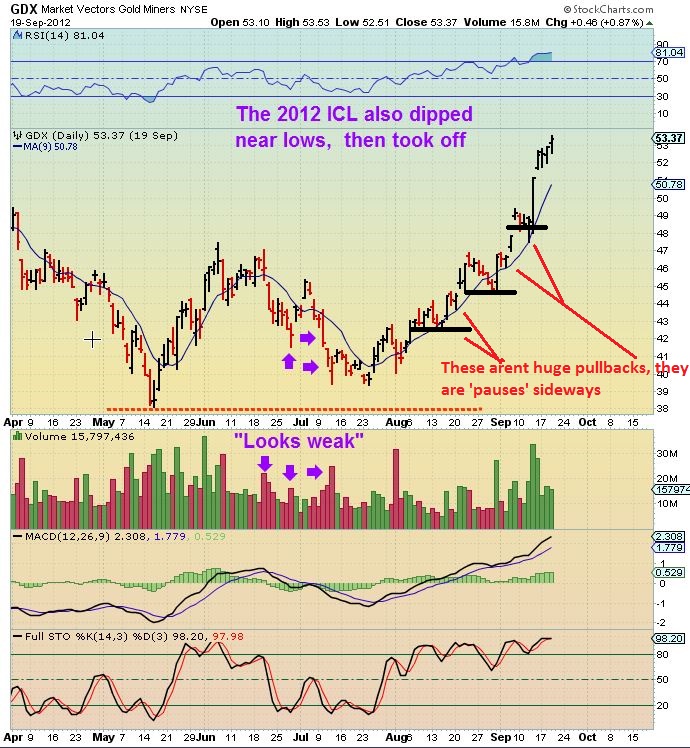
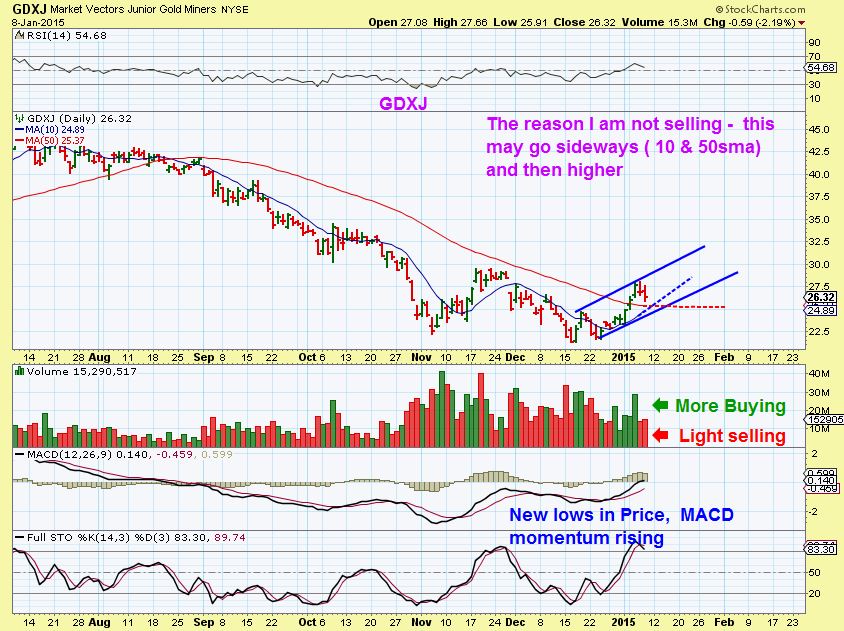
LASTLY – I may be a trader and I may sell some positions/ take profit when I think they are extended. Maybe I sell some when they hit their 50sma or if they get extended over the 10sma and 50 sma and I expect a possible pullback, so I can buy back hopefully lower later. However, this is why I am not selling all positions in the Miners . I have seen STRONG moves in the past and in some, the Miners have just pulled back 1 day , up the next, down the next , up the next – basically a sideways move to those moving averages as they catch up. I have shown this in these 2 charts .
This is GDXJ now ( as of Jan 8) It can just move sideways and bull flag. We dont know, but I dont want to lose my positions at this points, unless I get stopped out.
So those are just a few ideas that I wanted to share, they may become more actionable after we see how this day and week ends. Have a great weekend!
~ALEX
JAN 8 Follow up / Quick Turns 
 Week ending Jan 9 Review
Scroll to top
$USD is ending with a Bearish engulfing candlestick.
Yes, and the $XEU FXE has a nice reversal of its own. : )
With the ECB meeting on the 22 and the Greek vote on the 25th I doubt the stock market does much other than churn up and down for most of this month as traders balance what will likely be decent earnings with the unknown of those two events.
Yes, So far the traders can trade the volatility , but longer term its one consolidation after another with buy & hold making slower but steady gains .
If the Bull is still in charge, This one could form a bull flag over time, but we’ll have to wait and see
thanks for gdxj Alex, and SLW…. and some of those energy plays.
Ur welcome, I really like the way many of the Miners are and have been acting : )
Reuters, US Dollar net longs at highest in more than two years CFTC
http://www.reuters.com/article/2014/08/22/markets-forex-cftc-idUSL2N0QS1UD20140822
opportunity coming in. Alex is leading the way.
Great charts Alex
Thanks Marinho
I’ve had my eye on FEYE, COUP, CMCM, ARWR, TASR and TWTR ( and more) for a while, but so involved with metals..that I had to let it go . Some are really shaping up tho / might be a good year for traders!
Alex- great calls on miners.. They are sure making it tough with some volatility to hold esp as some of the big cap niners like abx don’t look as great. I assume you expect abx to catch up? I am debating adding to my position w abx.
I do think it could catch up & I like a few things about the chart at this point, but its definitely taking its time.
Sitting on the 10 & 20sma, shouldnt drop much more , but still needs to pop over the 50sma overhead.
Then I think you may get some good action. lot of times when price gets into a tight squeeze like this, you get an explosive type move.
Looking forward to this weekend’s GDX. Nice friday evening finish, although not quite as steady as POG. Curious what you noticed as ‘extended’ today that you have previously suggested as set ups?
Well, IAG for example , was getting a little extended, so now it needed a rest. It has dropped to the 10sma already & . That may be all we get, or a drop to the 20 sma and support might be in the cards. Still would look good.
CDE did the same thing last week, and SAND is also dong it now. Just a couple of examples for ya to look at. Use the 10sma : )
These are perfect examples. So in addressing SANd in which I’ve been in and out this last18 months, I’m still in with gains recently from your suggestion, complimenting my interest from awhile ago. I tend to hold miners for the ICHighs, but may ought to be trading as I have the 3x’s?
Of course I might regret not initiating my broker’s IAG reco coinciding with yours, but I Don’t like their CEO, as I’m also prejudice with Newmont and Barrick 🙂
So my curiosity is how many trades have you made on rises of IAG and SAND?
And do you Believe POG decided to Just Kiss that trendline sunday nite?!