EXPECT PULLBACKS
Markets dont go straight up or down
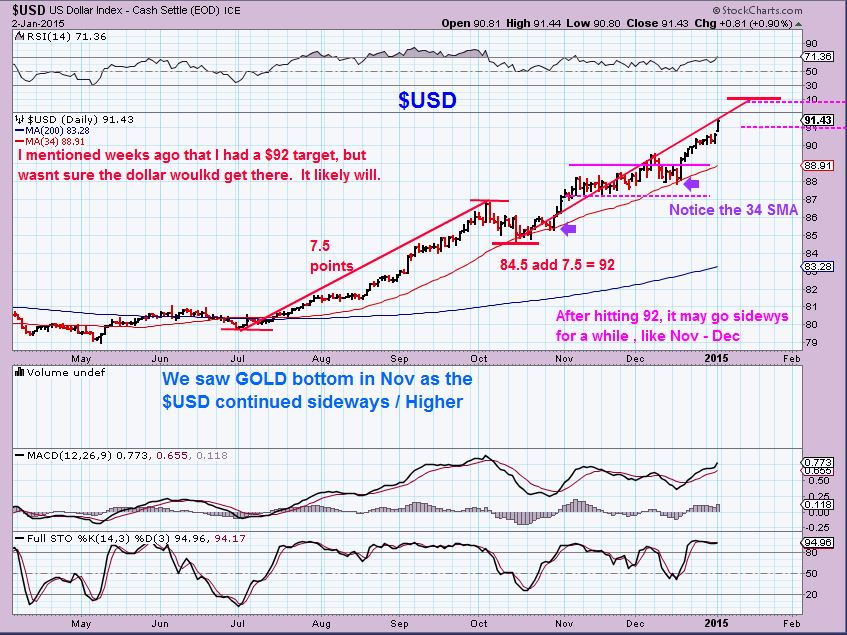
( yes I’ve seen the $USD and Oil Lately  ) Well actually, they haven’t been 100% straight up or down either. We expect Pullbacks , consolidations, dips, etc . Even the straight up dollar move wasn’t straight up , as you can see here in my Jan 2 chart, there were dips …
Pullbacks happen all the time, and the key is to examine them separately and look for opportunity. Lets discuss pullbacks …
I will discuss SPX QQQ etc Bounce expected at the end of this report (if you want to scroll there first)
As I began researching for this report, I realized that THIS is by far the hardest report to write about. WHY? I wrote a report a while ago called “All Bottoms Look Different”. So when there is a sell off or even a slight dip, they may act a little different each time . I usually offer a BUY POINT and a STOP…A Low Risk Entry on positions and the BUYER can then determine from my reports bullishness or Bearish tones. Raise stops? Sell at a price projection? buy & Hold even with the expected dips? THAT IS THE HARD PART. LET me explain…
Right now the current mentality for the QQQ, SPX, DOW , etc is fear. Fear of MISSING THE MOVE. Fear of Missing Gains. The mantra is ” Hey the markets are selling off, I’m BUYING THAT DIP!, or “I’m Holding on to my positions, Dips always bounce back!”
When it comes to Miners , everyone has been conditioned with Fear too. Fear of losing gains, fear of a slam down. A 1 day dip and I see panic. Many peoples mantra is , ” A RED CANDLE…I’M OUT!” or ” Why didnt you tell us to sell?”
There in lies my problem. I EXPECT PULLBACKS in Gold / Silver / Miners– along the way to higher prices , but must every red day be sold? No. I am expecting weeks of gains, but with pullbacks along the way . In the past – Yes, I have seen DEEP dips and yes , VERY SHALLOW dips too . What kind of a run will this be??? I am not THAT Good. It does look VERY BULLISH in many ways , and as I studied the markets last night and this morning , I realized that there looks to be some character change here . Time will tell, and some cycle guys claim that an 8 yr low is ahead of us. We’ll see, I am seeing interesting things that I will have to look into further as time goes on.
For now – I am going to show you various bottoms at meaningful lows (ICL’s) again and
-I want you to look at every RED CANDLE and tell me , if you sold then, WHERE WOULD YOU HAVE GOTTEN BACK IN?
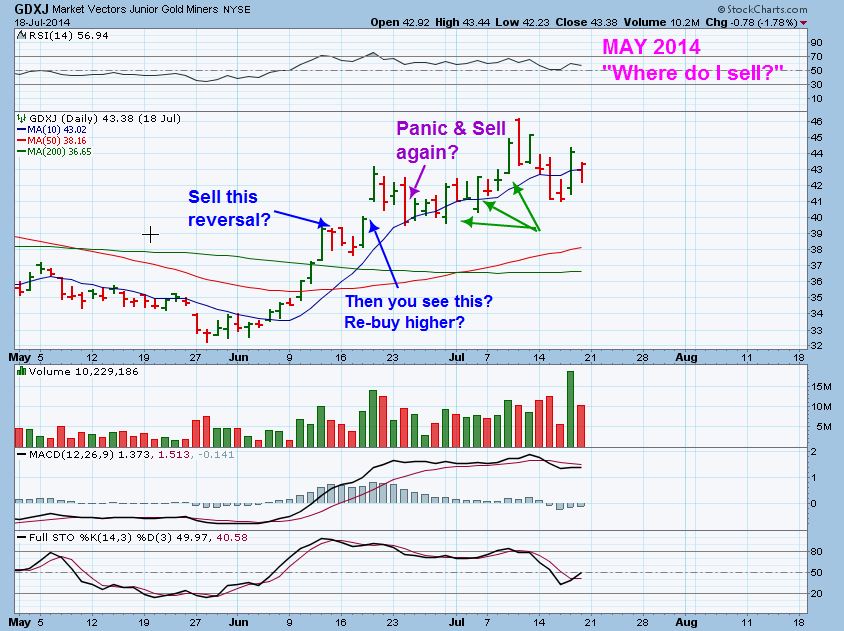
LAST MAY 2014…If you sell at each red candle- Honestly – where do you get back in? (Answer is likely higher)
Last DEC thru MARCH run. Where do I tell you to sell in advance? Where would you get back in? (Since the next day was usually GREEN, many would jump back in – higher).
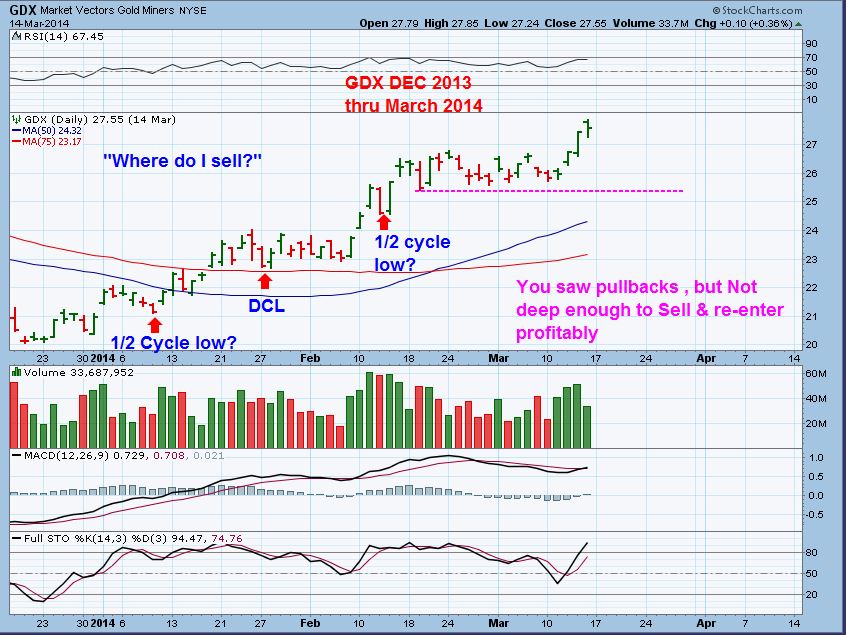
Those above charts were the last 2 ICL’s. They Seem a little stronger on their runs higher than some other bottoms . Hardly had a pullback . Yes, if you owned it (especially leveraged or in JNUG/NUGT ) each red candle hurt your emotions, right? Panic . All I can say is sell if you want to lock in profit, sell if red candles are intimidating, No harm in that. But you can see from the 2 above charts, buying & holding Miners (not leveraged) for weeks despite dips paid off. I pointed out yesterday that most lows had 8 weeks ( 2 months) of upside.
I posted this – We are at $20 and I’m being asked where to sell.
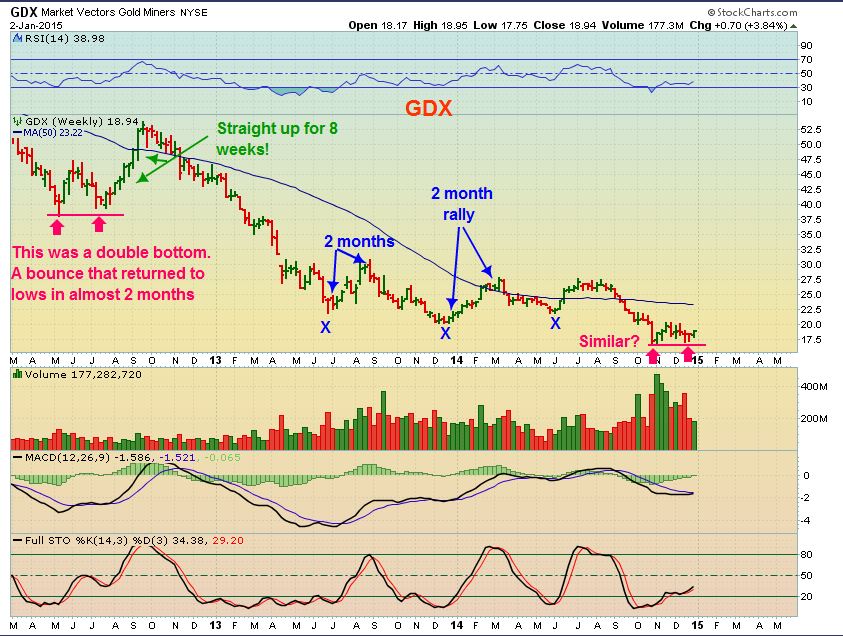
A few other Bottoms show that they had bigger dips. I’m showing you this because IF YOU ARE LEVERAGED , They hurt more. Again, they ran for weeks , so even with deeper dips, where do I tell you to sell and then get back in on all the individual stocks? They run differently , I have even seen some sell off intra-day and recover each day (sideways move) . So these lows were volatile, deeper dips, still made higher highs later.
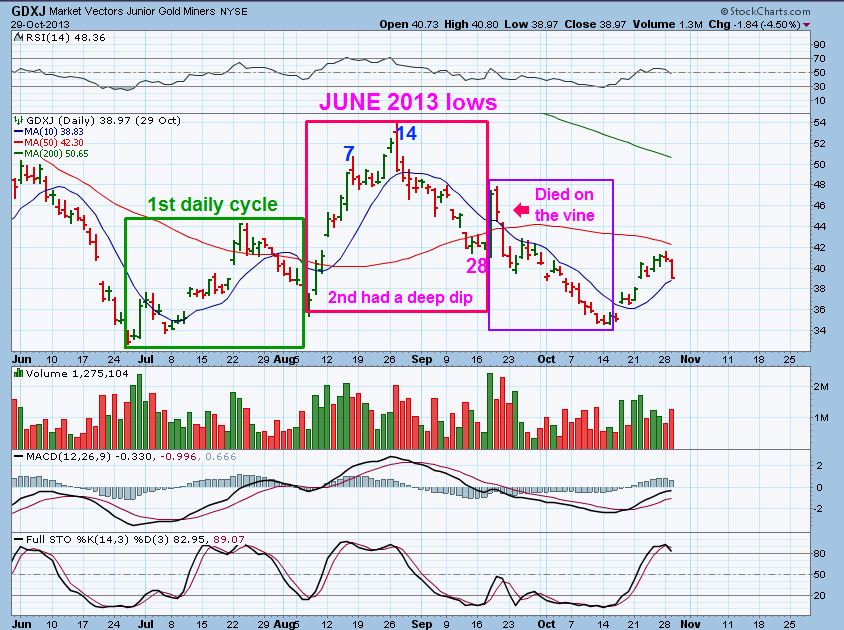
Look at JUNE 2013 lows / recovery. It dipped DEEP into August, then rocketed higher. Then day 14 was the high.
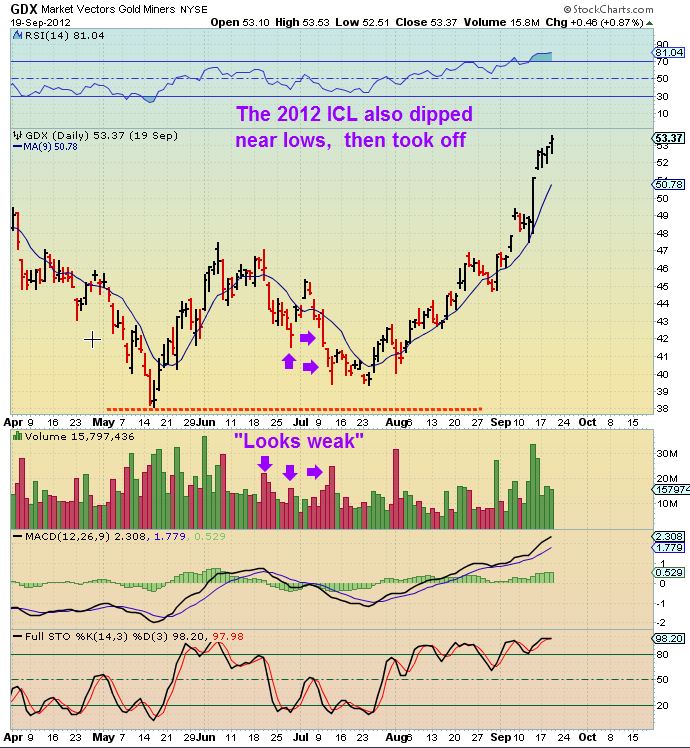
I have said that this low resembles the 2012 lows. A double bottom like now . look at that second run up, I expect something similar now. See RED candles? Where do you sell & where would you get back in? It basically rode the 10 sma (9 was shown) so It may be difficult to consider it Trade-able.
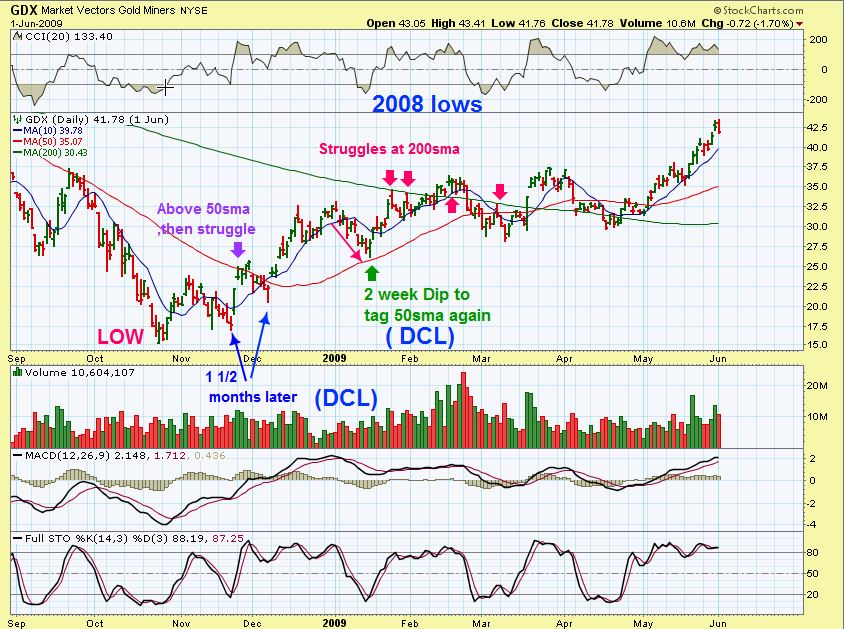
Lastly 2008 lows. These were volatile. Everyone talks about how Miners double & tripled quickly in 2008, but how many dared to ride it is the real question.
See it struggle at the 50sma in late Nov , then a run up in DEC & dip back to the 50sma in Jan. Then struggles & breaks the 200sma in Jan/Feb , then a dip. Where to sell? Where to re-enter? Tricky.
ALL OF THAT BEING SAID…I am going to show you how I trained myself to BUY & SELL MINERS . In this lesson you must sell and walk away. No regrets if it runs higher, you locked in gains and you Move On to another trade, perhaps another Miner setting up / pulling back.
LESSON:
This is a CDE BUY & SELL
1. Lets say you bought CDE near the lows recently. It runs up & pauses or dips –
2. You measure the length of the 1st run up after the ‘pause / dip’ lows to highs . Thats A-B .
3.Take that length and add it to the lows of the dip after the next leg up starts.
4. Set a “Sell” at that price projection. After the sell, WALK AWAY . No regrets if it goes higher, you locked in gains A-B-C-D.
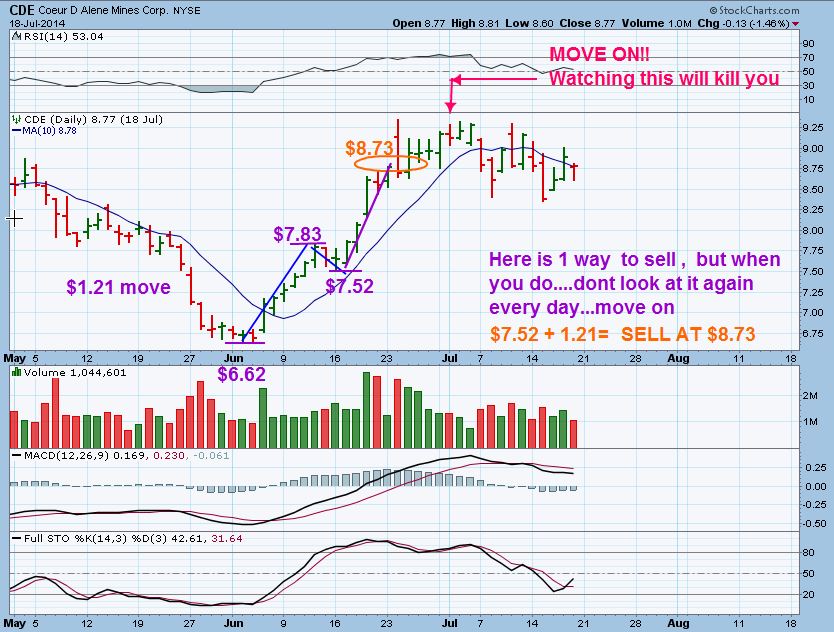
I have done this trade repeatedly over & over in my trading life.
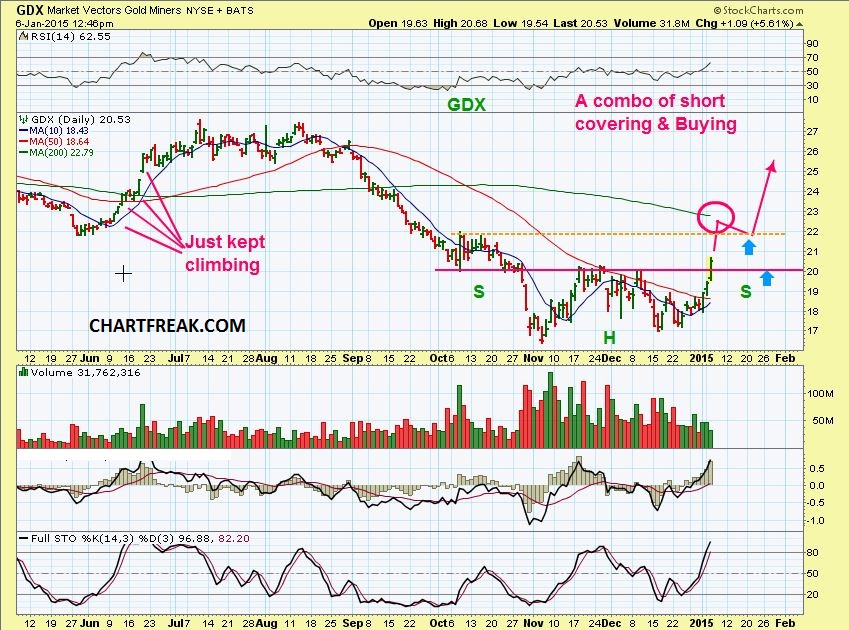
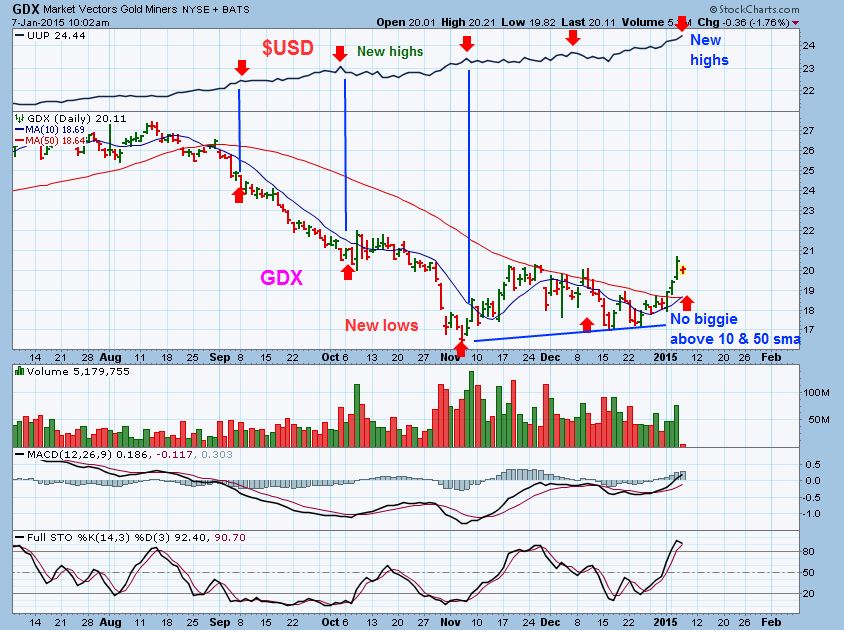
SO WHAT DO WE SEE IN GDX? We just broke resistance and have a nice base- BULLISH. We could FLY or go sideways and even tag the 50sma next. Right now I think we just go to the 200sma soon & then pause, because we have a strong base . I WILL NOT SELL THE DIPS, I recommend BUY THE DIPS at this point.
When I say ‘Buy Dips if you own nothing currently’ I mean that when MINERS dip to the 50sma they broke above , or maybe the 10 sma, they could be bought.
If we are getting a dip today, I will put that in tomorrows charts. Possible “Set ups”
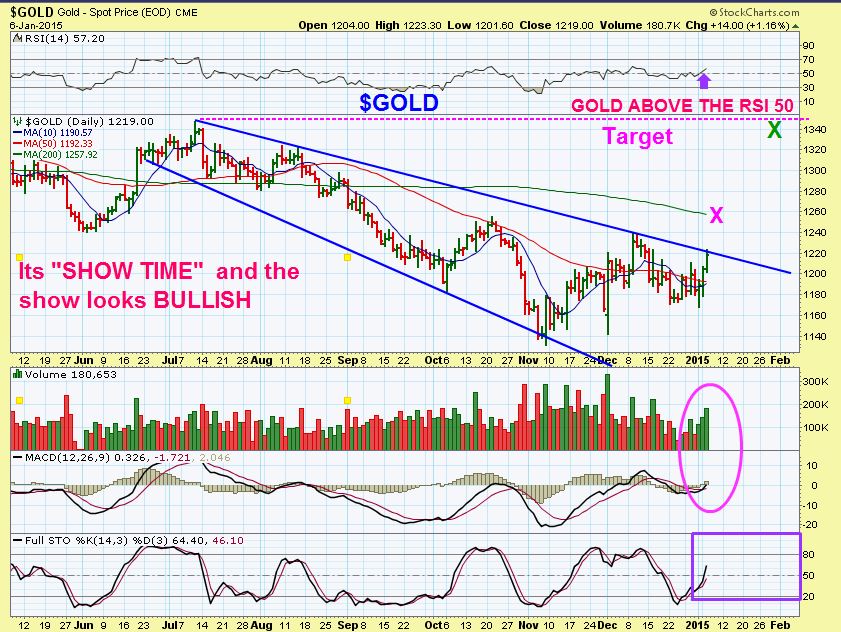
GOLD LOOKS BULLISH ( at resistance, could pause)
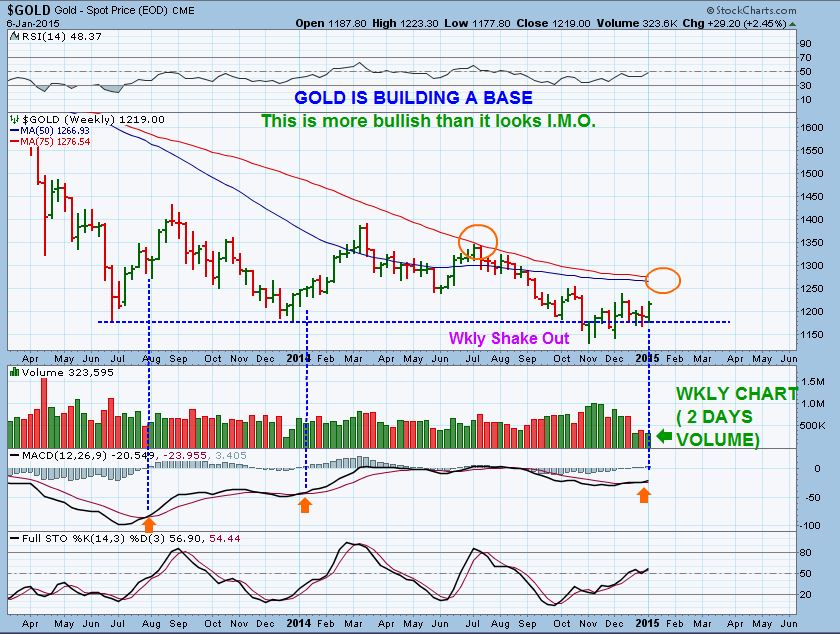
WEEKLY GOLD ONLY AS OF TUESDAY – What I see is far more BULLISH than it looks.
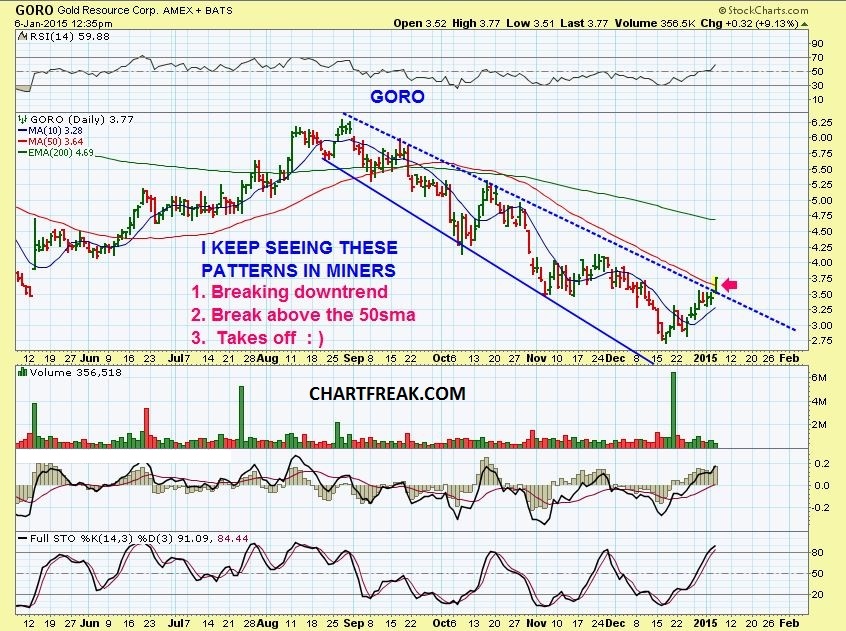
I bought GORO yesterday, because it broke out (Looking at Gold, we may have a pullback today, I’ll have to see if this tags the break out or goes back inside. I will hold it anyways above the 10sma )
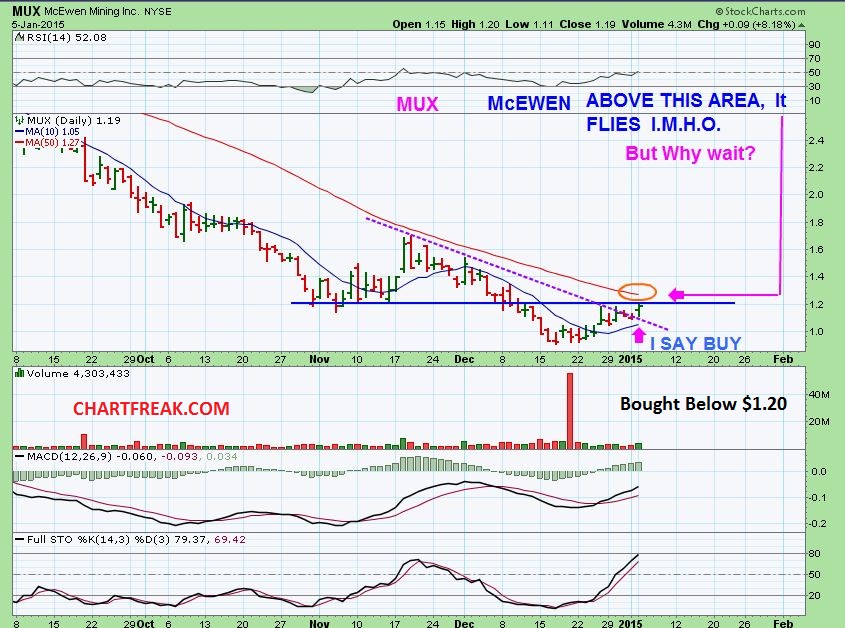
I like lagging MUX
THE MARKETS
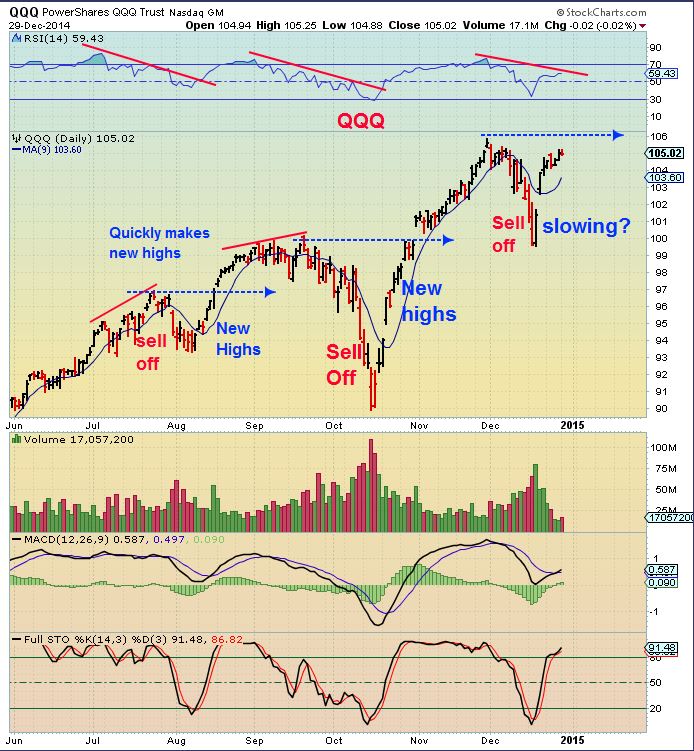
Lets talk about the MKTS. I had seen weakness weeks ago & called that a break to new highs might be a sell, and QQQ might not even make new highs. As I watched how They sold off yesterday and volume increased, I am seeing a difference in how these markets are acting. A warning sign until further notice. What I am seeing is MKTS are due for an oversold bounce, BUT I WANT TO WATCH IT. It might not be the typical BUY THE DIPS (Except for a nimble trader). It might not last. I now see negative things and this may be a “short the bounce”. IT takes time for these internals to show up , so I will post further as we go along.
This is an update / Review
Saw weakness in QQQ, reported it DEC 30
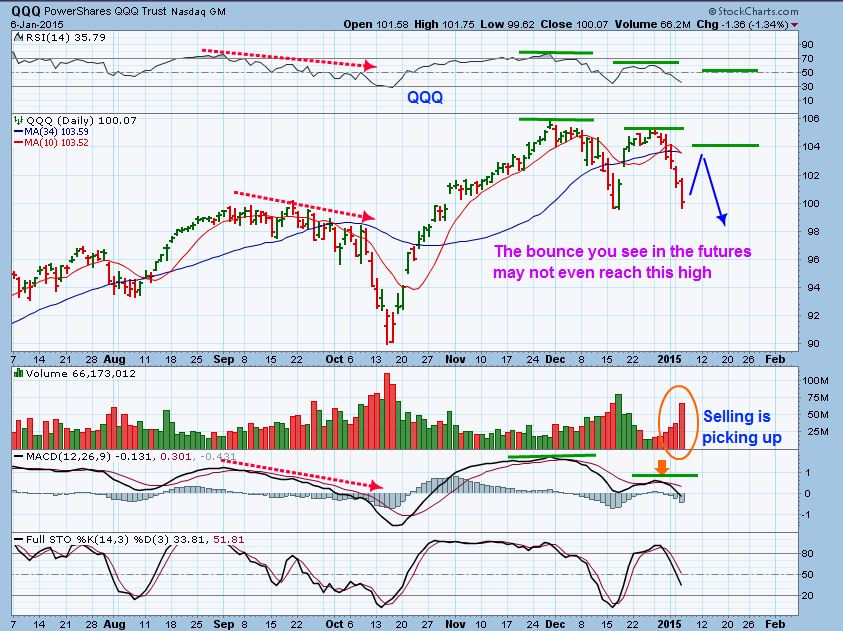
We dropped – We are due for a bounce now / Might be short-able instead of buy the dips. ( TZA?) ( Day traders can buy dips ). Watch how we approach the 50 sma (not shown) or 10sma. I am focused on Miners
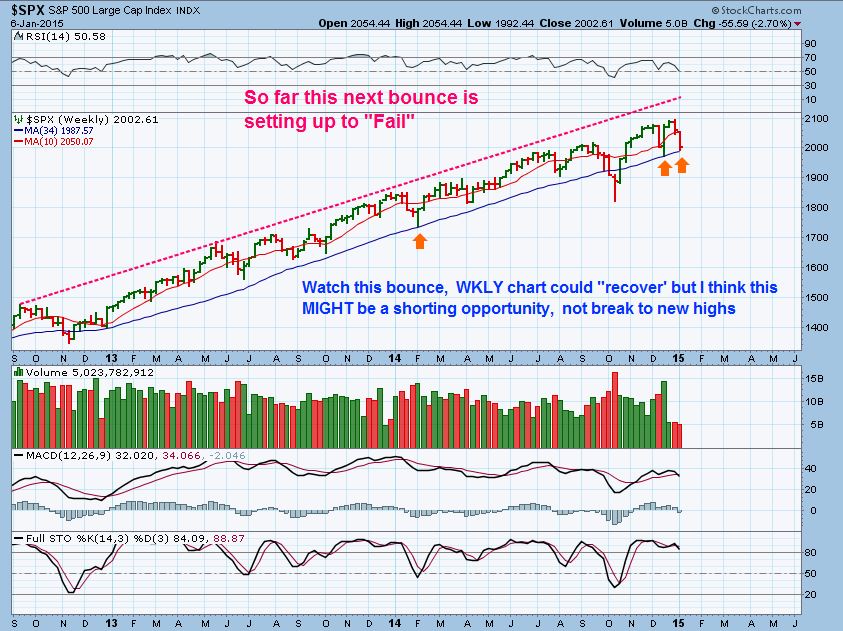
SPX WEEKLY ( could recover since its only Tuesday on this chart. Watch the bounce)
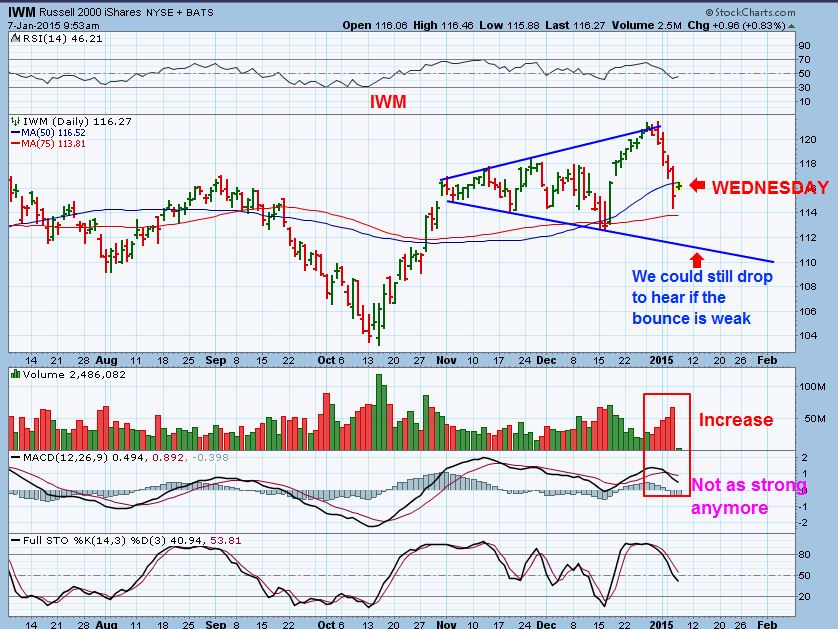
IWM – Not as strong as it was , but still not really ugly
SO for now , I am not worried about red candles and dips in Metals and miners. I watch them to see if they are going to get bought up. The other day we sold off intraday at lunch and some got worried, but these charts above should show that PULLBACKS are to be expected. As for the equity markets, I need to look at individual stocks and see how they are acting. When I look at PCLN, IBM, GOOG , etc – I see weakness in those former leaders. it COULD just be a healthy corrction and then onward and upward, but for now I am seeing thing internally that indicate that this sell off could escalate and GOLD/SILVER and MINERS could rally. Remember that when MINERS & METALS start to dip, the bears jump in and short them and say ” I TOLD YA THIS RALLY WAS A TRAP!” Then when the big money steps in to buy at cheaper prices, the bears must cover and the rally powers higher. That is what I expect for now as I see things.
In the markets , everything is subject to change , so we stay frosty / Alert. One of the biggest changes that I see now , however, is that the DOLLAR again is making new highs, the Metals and Miners are strong. Thanks for being here , dont fear the dips and …
TAKE NOTE OF THIS:


Thanks ALEX…. this is a very good teaching and make is more stable regards our nerves!
See you later.
Your welcome Geurt.
I saw the futures down when I woke up and GDX was down 50 cents – I was afraid that many would sell the dip, so I just wanted to show how many red candles lasted 1 day in the past. Some just intraday . Timing these type markets is tricky. There will be pullbacks , but so far …
The set up remains bullish , even BUY the dip may be the new phase of Miners , as more ‘shorts’ will start to cover.
Hi Alex,
Bought WIFI with your buy setup yesterday…noticed it fell through the consolation band…but bounced from the intraday lows with high volume… where would would you stand…… hold or sell it as it approaches previous support?
Hi Curtis
This is a tough one because it is oversold (But can remain there with a few bounces), it lost both support & the 50sma.
That was where I would have had my stop, and I would be out . You could hold , but need to watch it as it approaches that area overjead.
IF IT WERE ME & I were still in it … I would likely sell as it gets to support ( take a small loss) and watch it if it tags the 50sma . Does it break back above with conviction? Or tag & drop. I am just a little more bearish in the mkts now, as i watch this bounce . WIFI “Could” recover or “Could” be starting a down trend?
FED MINUTES is coming out at 2
Oeps Alex…. the same question I had yesterday, I’m also still in it.
Question: What about begin Aug and Nov. when it crossed the 50 SMA?
After some weeks it slams through it. Thanks I will keep an eye on this one, and let you know how I’m doing with this one!
With respect.
A lot to digest here. Thanks a bunch. Standing in the balance of fear and greed 🙂
Just curious… How is POG ‘far more bullish than it looks’?
Hi Beek,
Because it only looks like its at lows & should bounce to the glance.
so It only looks mildly bullish, but when I look at it as a wkly shake out, a 1.5 yr base with a shake out, when I see that volume on day 2 of the week, when I see Miners leading the rally up, when I feel that the EURO / YEN are going to go higher soon and thus the USD pullback, etc and many othe things, I think its a lot more bullish that it appears to the eye.
Fed Minutes today – gotta expect anything with that , including a couple days dipping down, then a rally again next week. OR a rally now and pullback later.
Alex- there a small gap on GDX and the HUI on the 15 min charts created yesterday. 19.50 on GDX.
Hi Mark,
The upside surprises seem to be in force. Buy the dips in miners if you can believe it.
that gap “MIGHT” get filled if we drop to test the 50sma on the next DCL, but it may be early for that right now.
Thank you for that, Alex. From what I’ve been reading many are all but certain this rally comes to end within a week or two if not now. A brief consolidation to work off the over bought conditions wouldn’t be so bad:) Thanks for staying on it!
Thats what I would like to see, a sideways consolidation like the MAY 2014 rally , or a move like 2012 Aug into Sept on the charts in the report. Sometimes you get the dip though….It’ll be in tomorrows report briefly
Alex,
Thank you for the great reports! In your “Lesson” section, do you look for possible ABCD patterns as part of the cup and handle?
Tiger 5 ! Nice to see you again, been a while.
In a cup & handle – I would say yes.
I do use the height of the cup as the price projection for the extension of the move off of the handle, so you would look at the cup right side as A-B and the pullback (handle) is the move to ‘C’, then C-D can be measured from the A-B length.
[ One thing I have noticed in the past couple of yrs is that many CUP/HANDLE patterns break out and trun back & test that handle sooner than they used to. I often wonder if it is intentionally done to shake out those that are trained to “buy the break out’ on cup & handle. ] – some things in tech analysis are slowly changing.
Thanks Alex! That’s what I was thinking. Nice to have you confirm. Interesting observation on your last paragraph.
That’s why we got you Alex! You always have your finger on the pulse. Every day I learn something from you. Many thanks.
Thx – appreciate that
Thanks Alex… it appears that many traditional stock breaks with TA saying for instance breaking thru 9 with a buy, target at 10 with break out, quickly get sold back down to take out a stop set below the entry, almost like everyone watching the same TA to trigger the failed attempt, not all the time but seems like happening more in this chop…then more frustrating once the stop is taken out it can resume back on the way up or if I don’t have a tight stop it continues down….makes me wonder sometimes about TA….
Yes, I have my theory on it, but its just a theory : )
Alex, took your advice and added today in dips. Bought additional GDX and started position in SAND. Feel pretty confident based on your analysis and as you know that is not the norm with these! NFP on Friday but otherwise rest of week and next could be pretty positive. Dollar is now at 92! If we could get $22 GDX in next 2 weeks that would be the bomb.
Dove back into SPY on morning dip, short term, may take 50% off tomorrow and let rest run with trailing stop. Appreciate General market and currency comments. Maybe oil gets traction here? That’s the one falling knife I just have wanted to try to catch.
Crummy close. I really thought I had something there about 3 PM…