The Big Picture . Its important to your investing to know what you’re looking at, each piece big and Small together. Why? Sometimes it can help us to be patient and wait for the best trade set ups, other times it gives us confidence that our trade ideas will have positive follow through or minimal downside risk. Both are important as we watch the movement in the markets unfold. Well, Today is Friday and not a whole lot has changed from the report yesterday, so I want to do a quick review and after today we can do a weekend report that may shed even more light on things.
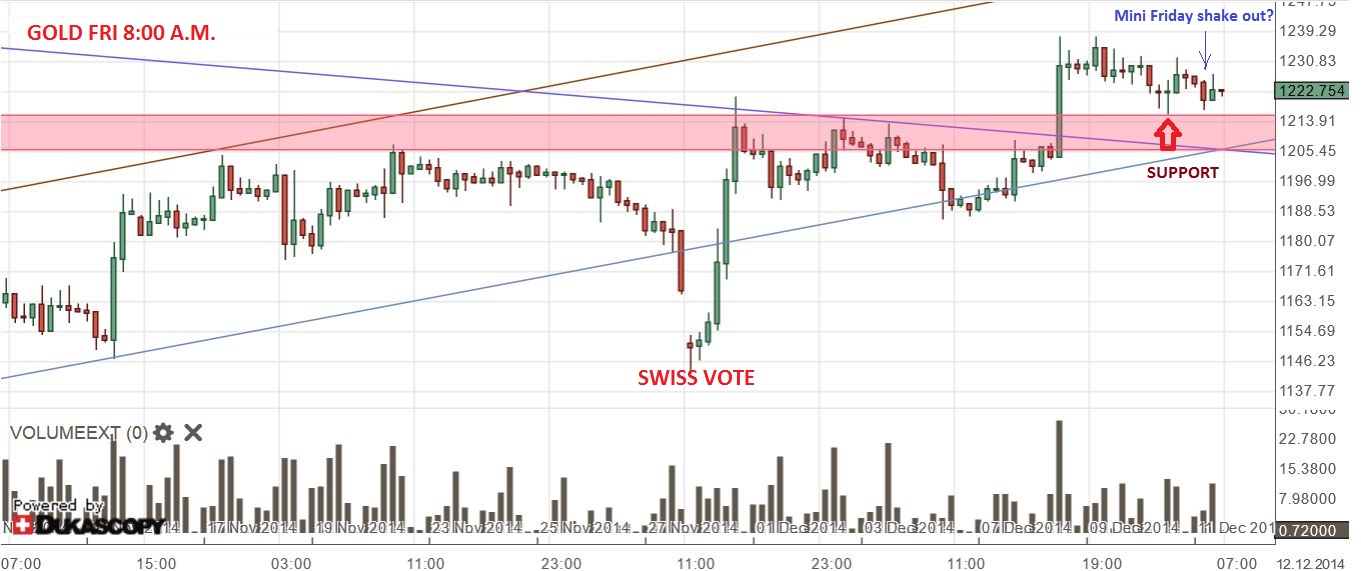
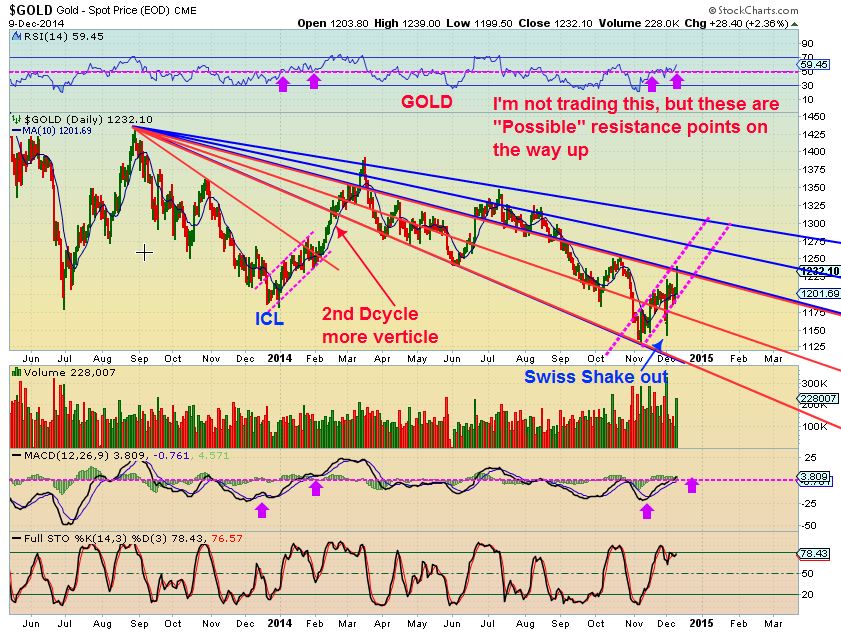
For starters: Its Friday, and I fully expected a little slam down last night in GOLD (Our shake out Friday events), but we had just a small blip. Either the Gold market has gotten stronger or they’re saving it for later. I think we have seen evidence that Gold has gotten stronger legs under it lately.
This was Gold recently attempting to break above resistance
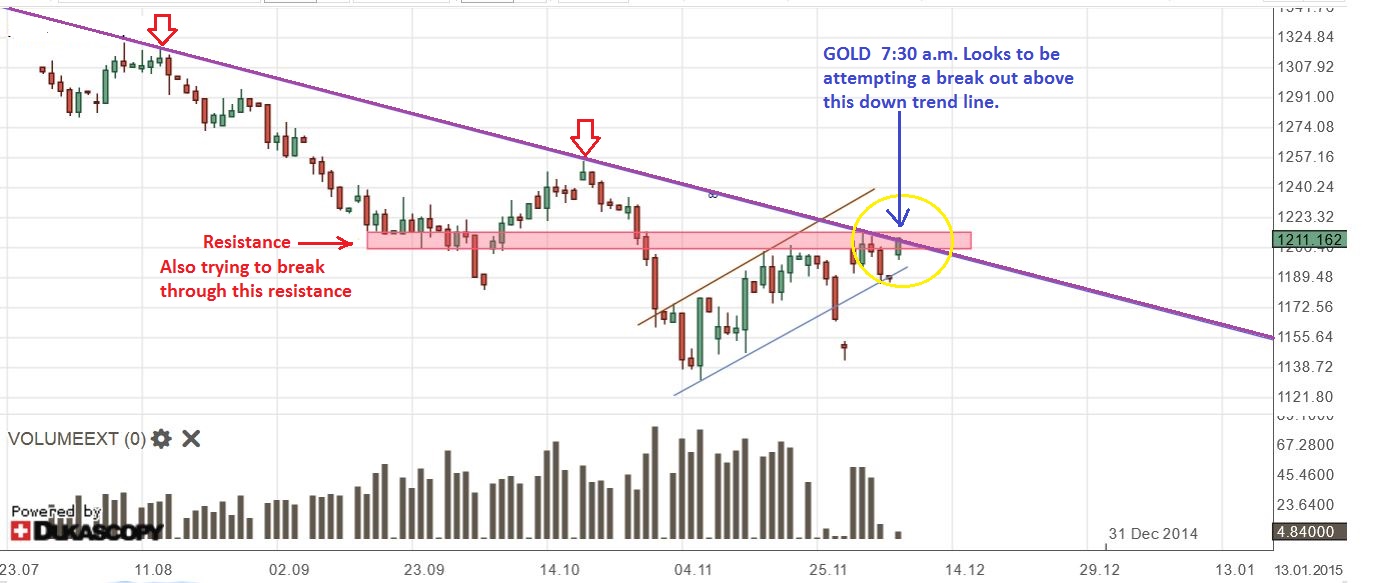
And GOLD Currently now using it as support. Bullish
This is how I was looking at gold A couple of days ag. It was unclear if we already started a new daily cycle or would we dip further.
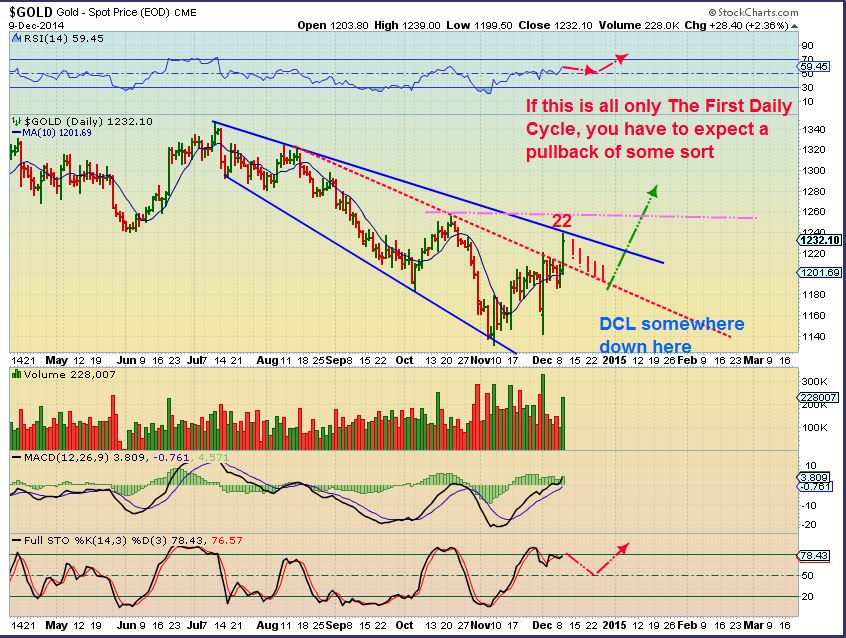
We could still pullback more , this is how I am still viewing Gold. Right on track really.
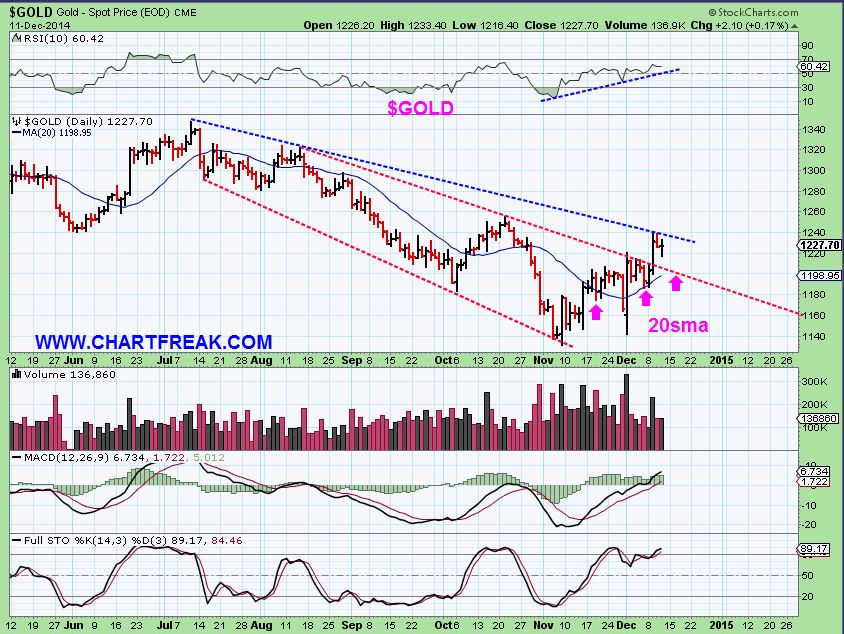
I dont always post all of my chart (I’d have 20 charts per report and thats just too much). This is a Fib chart that I have been following .
I last updated it DEC 9, but the past 2 days drift down fits inside the magenta channel . All still looks good.
Silver Dec 8 – We looked ready to POP.
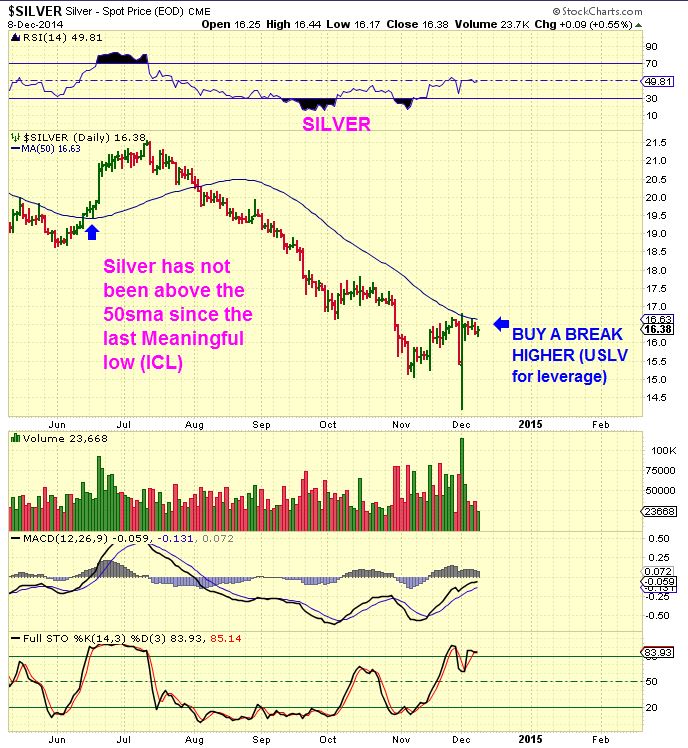
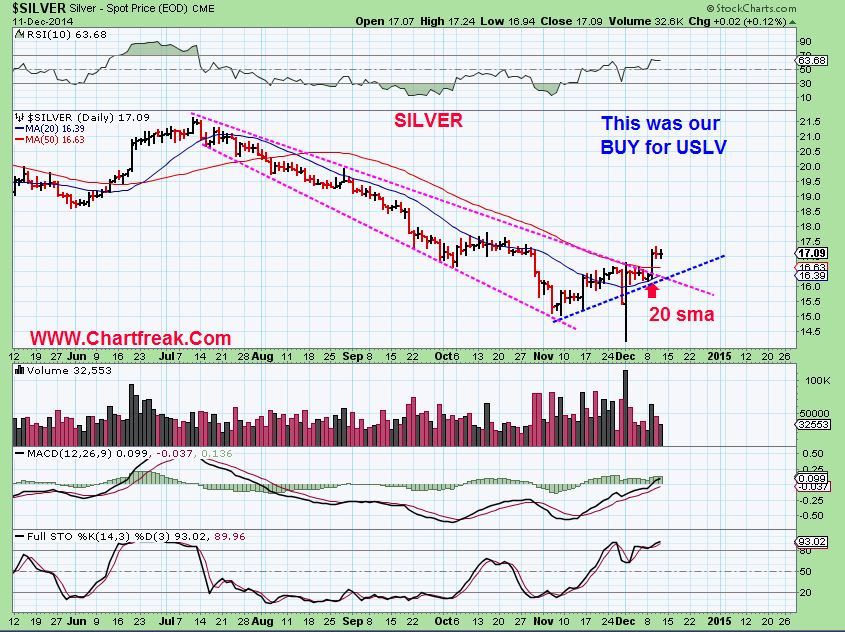
SILVER now – We did Break out 20sma is acting as support, as well as the blue trend line
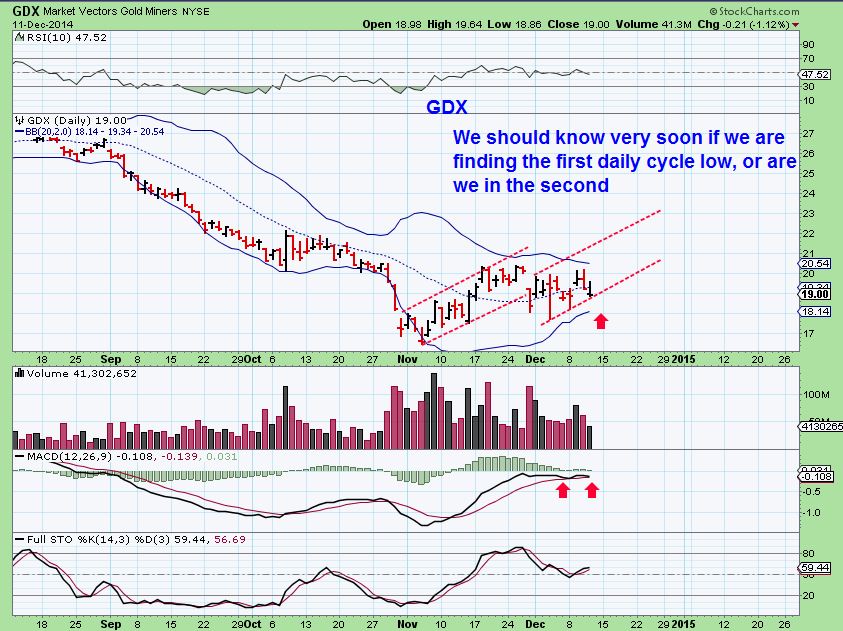
Miners have concerned some as looking weak. They do not POP with every rise in Gold lately, so thats understandable, but the chart shows a sign of strength in NOV, and a consolidation currently taking place.
Usually Miners are ROCKET SHIPS, so I understand the observation, but I think that the 2nd daily cycle will surprise many with upside vigor. IF NOT, I will be concerned then too.
Try to remember, I posted this from DEC 5. This is GDXJ & I expected a possible sideways consolidation to the Bollinger Band. This is exactly what we have down.
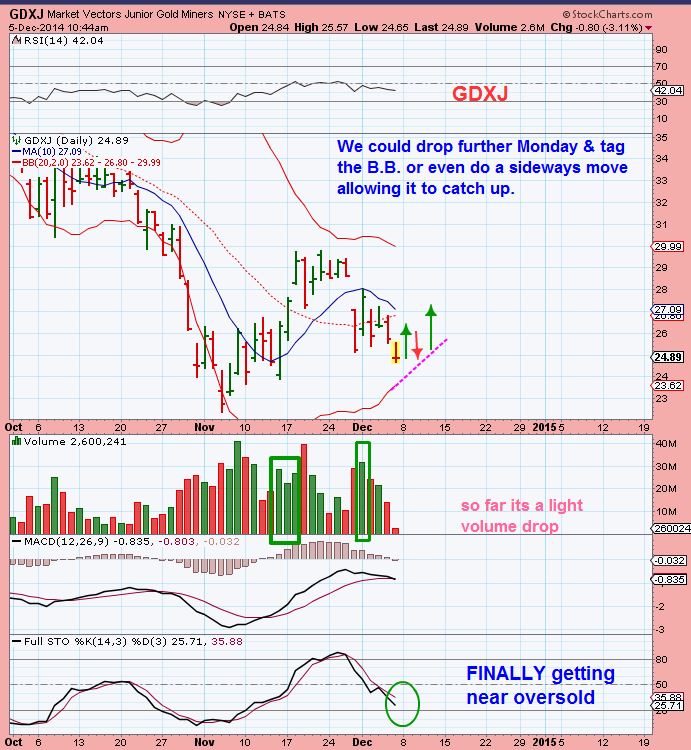
GDX This chart does NOT look bad. FEAR of a drop keeps many from seeing this as a possible bullish set up. Consolidations can take time & watching them day by day gets tedious , but often I will show a chart a year later and everyone seems to think they would have “easily” bought and held those lows. Its not that easy.
As a side note: OIL is below $59 right now! Still selling off in A capitulation type sell off. Seems like it was just breaking below $80 and into the $70’s. Amazing!
I’m going to throw two charts up from yesterday, I still see them as very valid.
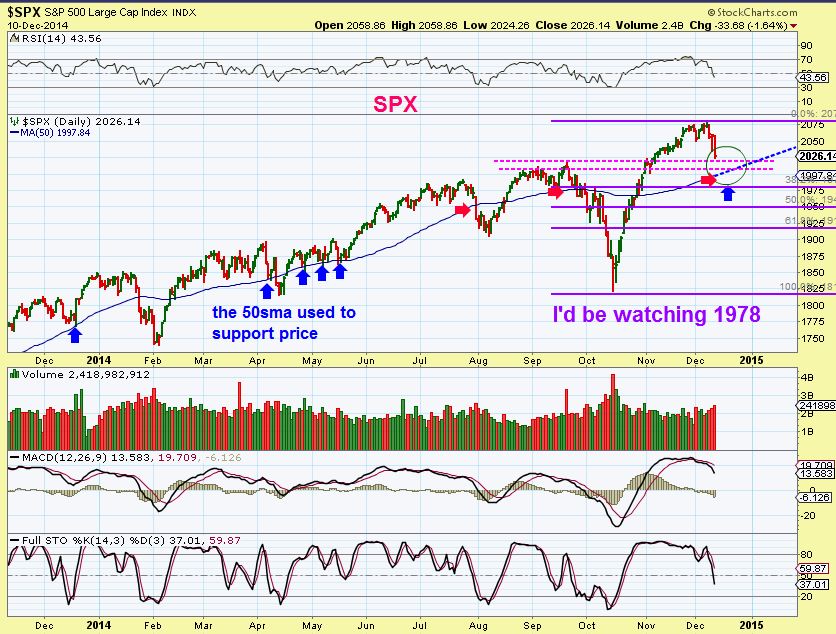
The markets rallied back again yesterday and almost gave it all up at the end of the day. BUY THE DIP is being unloaded too.
I also said that I would discuss my ideas on the 8 year cycle , which does seem valid and does imply lows in the Gold Cycle would be “ROUGHLY” 2000, 2008 , 2016
I will put that in the weekend report. It fits better there and isnt time sensitive at this moment. It is good to discuss it, because it implies that after we go higher, we could then dip to that $1000.
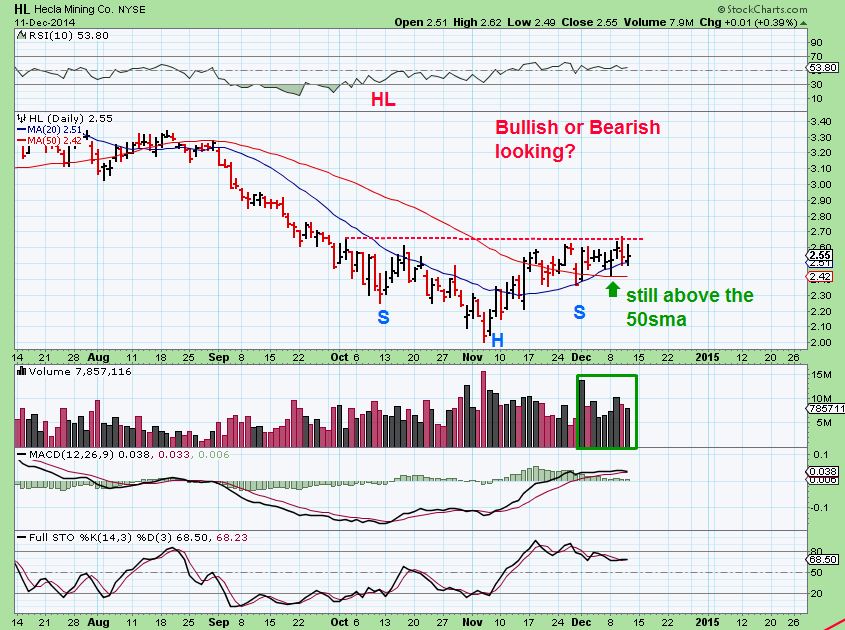
So for now , thats a review for the last trading day of the week, not much has changed . The Market sell off is on time as expected, Gold is holding up & Miners are boring us to death. AGAIN< SOME of the mining stocks still look like good set ups and can be bought on the dips. I had mentioned SSRI, IAG, HL, etc and they POPPED right when I posted the charts and have since rested back down. IF you felt you missed the POP, maybe add on the dip? I’d Buy a BASKET too, to avoid individual Company risk. build your own ETF?
HL for Example. I will include more in the weekend report, but here is what I look for. Low risk reward, because Its above the 50 sma. It could drop to the 50sma today . If you get stopped out below that next week, so be it…But it looks like a good entry, especially if it dips to the 50sma. This could easily run up 30% in a second Daily Cycle in my opinion.
So not much has changed, it just takes patience and time , and that can be rewarding – far more than emotional trading the daily wiggles.
Thanks you for being here as always, and we’ll see you at the weekend report. (I may post a small public report later. To be fair to my subscription readers, I will be vague and while posting a couple of charts , I try to show how it can go UP or DOWN from here. I’ll leave my directional ideas out . This way I dont let them see if we are STILL bullish or bearish. I may imply that we expected & pointed out the lows in NOV, but what next will be left out. Also – I may show a chart of the SPX. I can show that we expected a pullback , but what about the next bounce – how high? New highs? A crash after the bounce? A Santa rally? This would all be left out. The public report will be written with the subs in mind too. )
Again,thanks for being here, you are appreciated.
~ALEX
We’ll Take Another look 
 The Forest or The Trees?
Scroll to top

Alex, any thoughts on GDP? Thanks
Hi CS
GDP had capitulation selling and now bounced. It MIGHT just be short covering , so it might also then sell off again and likely put in a lighter volume test of the lows.
Its tough to say right now, but it feels like a ‘bottoming area’, but cant say whether its THE LOWS, or just another pause and then deeper lows. ( May just be temporary if OIL keeps selling off after OIL bounces) .
Thanks Alex. Was hoping for a move the other way on GDP…but thems the breaks. Sadly, it opened way below my stop and haven’t been able to pull the trigger since…relatively small position. Have noticed that the short position is 50% of the float! Either I’m incredibly dumb going long (very possible!) or this may be a great contrarian position. We’ll find out Soon which one. 🙂
Oh Deshy,
GDP looks like it may be bottoming, but I thought CS (is that you too?) was looking to enter…so I aired on the side of caution.
When I look at GDP right now, I think it’ll at least get a good bounce or short cover rally, because OIL & XLE are hitting new lows, GDP is NOT- its bouncing here.
Nope…CS is not me. And I’m not planning to stake any more in GDP unless it proves itself no matter how much I think it ‘owes’ me. As you mentioned, expecting to make it all back in one shot is a good way to lose more…been there, done that.
BTW: Some great charts and thanks for covering a wider bread than just PMs.
I started buying a small basket of miners last week, and also early this week…..half of that basket has been stopped out already. For example, I put the stops for PAAS, and SSRI just below the 50ma…9.75 and 5.35.
How do you manage your stops for your miners you bought last week? Have you been stopped out also?
Hi Harry,
Because I feel we are at the lows (ICL) and do not believe that we going to completely break down, I keep a loose mental stop . I try to avoid cutting positions personally- Knowing that we are nearing the LOWS before another run up.
The reason I encourage others here to choose their own stops (And honor them) is because when something starts to sell off, even a little, I can tell that many dont trust what I am seeing yet. Thats understandable , but I often get emails with many concerns. People have been burned a LOT and I understand the nervousness, but I cant really answer 10 – 20 emails in a timely manner trying to explain all the reasons that I am not worried, so I just say “Set your stop below the 50sma …to protect your funds and re-enter when you feel the selling is light or we re-gain the 50sma.”
I hope that helps, but really I PERSONALLY only lighten up closer to tops and buy sell offs.
hi Alex.
I was gonna wait till 50sma for a buy, but when GDXJ fell to around $24 again, i decided to start some light buying with 200 shares. Get some skin in the game as you recommend.
Not too damaging if we go lower, and i hold on.
Price seems to be coiling for some directional break.
Not sure i like that descending triangle much though!
Not sure which triangle you mean. I see a long term broadening wedge, bullish if it breaks from that.
I will have more in the weekend report…FED WED again…I think we may trigger then.
Think the triangle was from over-reading my trendlines 🙂
At least i didn’t see a puking camel.
Oh, Ok. If that trend line down is broken…we’ll all be a bit happier. : )
Alex- again it’s very concerning metals can’t take off in this tape w usd down and market also. we have seen this setup so many times it seems.
I like what I see… Using cycles timing it looks VERY NORMAL. I have shown many charts of the 2008 lows and 2013 lows. They look the same. What can I say? : )
Thanks, Alex. Appreciate the bigger picture report.
Thank Michael,
As for Metals/ miners – I know that this bottoming is grueling for many just trying to watch it & be patient (And wondering if its going to break lows), but I really believe that the next leg up (2nd Daily cycle) will be rewarding.
More in the weekend report.
Alex,
I have been looking at a lot of charts even 2008. I am trying to find a time where miners lagged Gold by this much… GDXJ is virtually at its cycle low while gold is 90 dollars higher. I can’t see another time period similar to this. If you can please point it out as it would try and help me understand what is going on here. Someone pointed out this rally in time and price is the same as june july rally in 2014. Miners were screaming higher and jnug went 3x from its low. The same rally now jnug is hitting lower lows and gdxj is near it lows.. I can only equate this to tax loss selling and then miners get going. Otherwise I am at a loss for words.
I think this is more like 2008 lows for miners, its in my upcoming wkend report.
Alex- if we are indeed in 2nd daily cycle the lack of a move would be chewing up valuable days to upside. I move above 20.38 on a weekly close would confirm the 2nd cycle right?
thats the way I see it too