
GOLD DID NOT ‘FAIL’
Gold started to dip down, rather fast yesterday, but please dont misunderstand. GOLD did not ‘fail’ in our expectations. It is getting a little whip-saw action pre-Fed, but it hasnt done an epic fail like out friend above. Let me explain.
( I will write everything I say on audio for any unable to listen in)
AUDIO – Click link, click ‘download’ , click open & return here when you hear the audio http://www.screencast.com/t/20w6iL1mCO
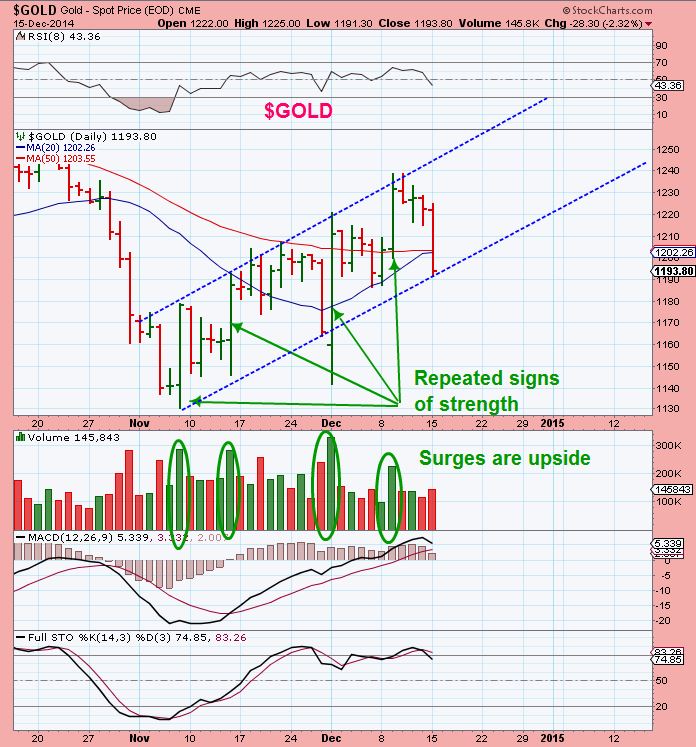
I got stopped out of a my Miners yesterday, due to honoring stops. Its unfortunate because GOLDS DAILY CYCLE is not even close to a fail. In fact, GDXJ COULD HAVE JUST DONE A STOP RUN. Thats important to recognize at this point. As I have mentioned before , We expect GOLD to dip into a daily cycle low roughly every 24 – 28 days…sometimes a longer cycle can takes 30 days, sometimes they are shorter. We are on day 27 I believe. What doesnt seem to change is that the price DOES drop unexpectedly and dips down into a daily cycle low. If the CYCLE is acting correctly and is right translated ( Peaks more than half way through the cycle) It then surges higher attempting to leave behind those that fear the dip.
GOLD CURRENTLY – 7 a.m.
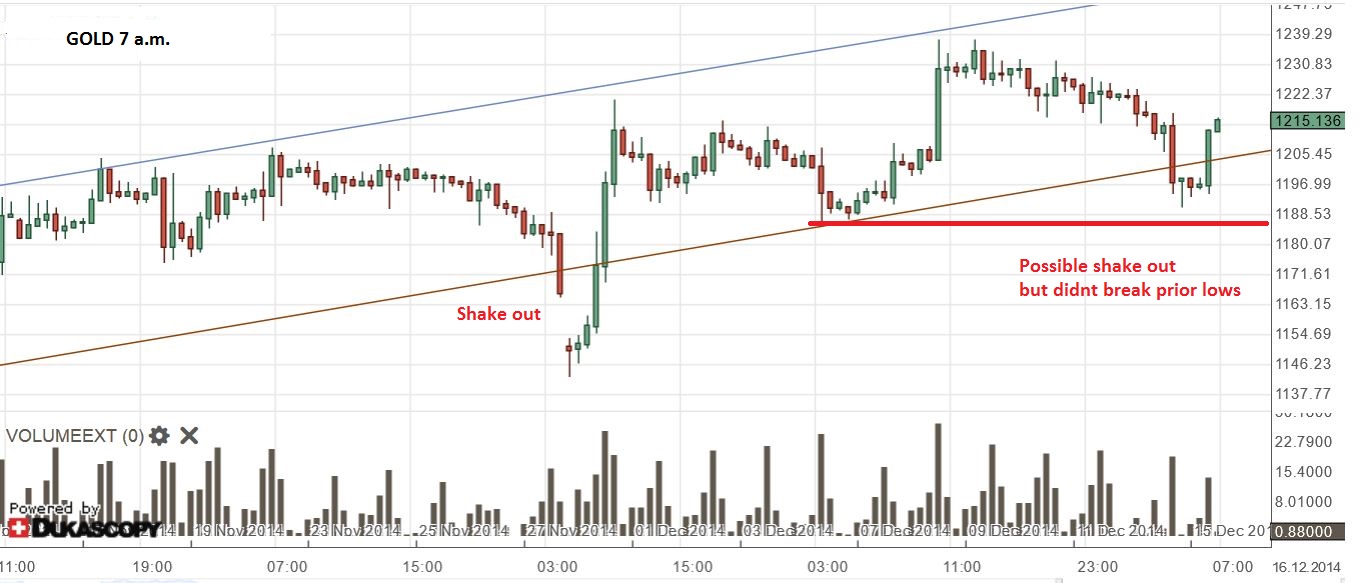
Worse than that , if the cycle remains in tact, those that decided to go short often get hurt in after hours trading. A small dip in Gold like we saw doesnt , when right translated and showing repeated signs of strength does NOT offer a good shorting opportunity.
If GOLD has recovered, then I think you know what this was ? A possible “STOP RUN”. A brief dip that triggers stops (How many times have I mentioned this and yet I had to allow my stops to trigger yesterday. On this trade I rode it up from the Nov lows…followed it closely and sold only a small portion near highs. I then re-entered last week with that money, so I had to allow my stops to work to save any gains. A gap down this morning and I would have given all my gains back. It was a small gain for all that hard work, and seeing Gold this morning….it is a little frustrating.
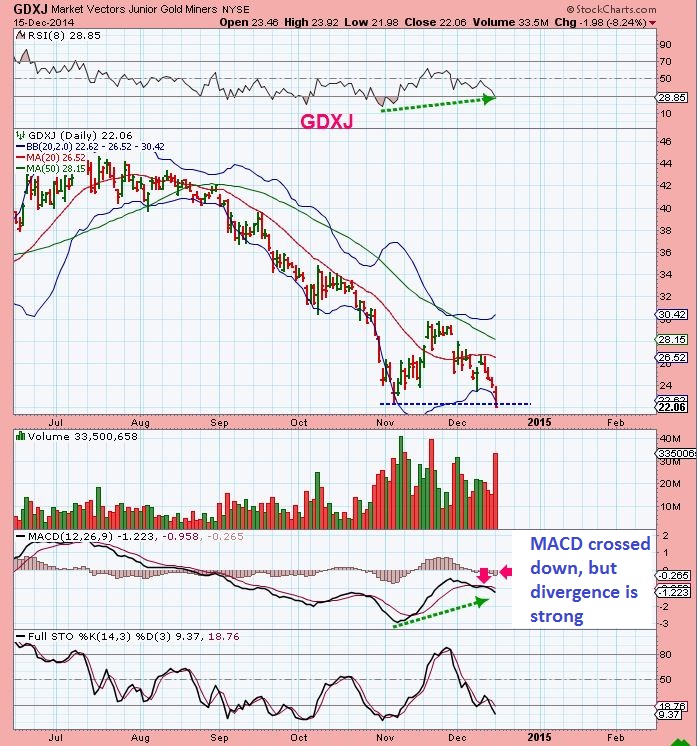
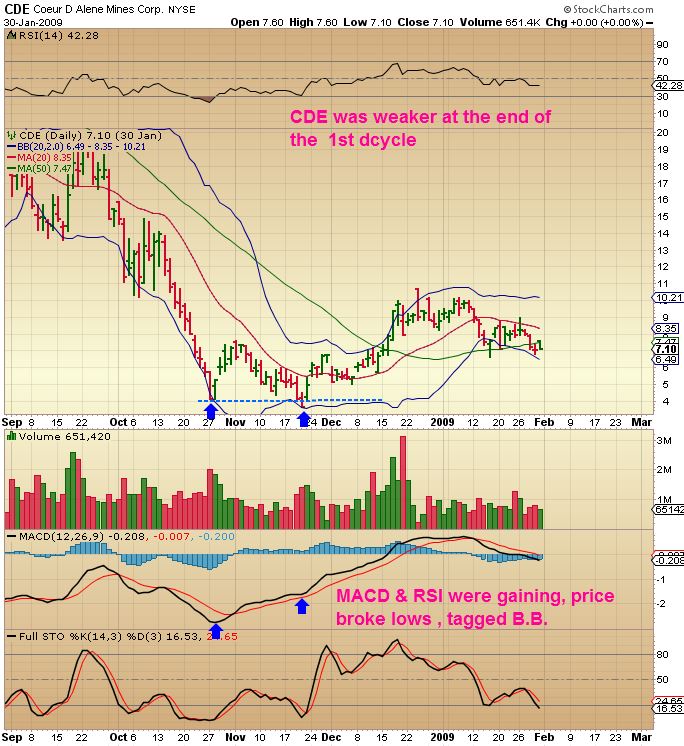
I had pointed out yesterday that some JUNIORS broke to new lows (Stop Run) in 2008 too, so I was prepared mentally for a stop run, but again, I had to allow my positions to sell to avoid a possible gap down today and loss of any profit.
I showed these chart yesterday, a “STOP RUN” to new lows…then joined a rally In GOLD / GDX after the daily cycle lows.
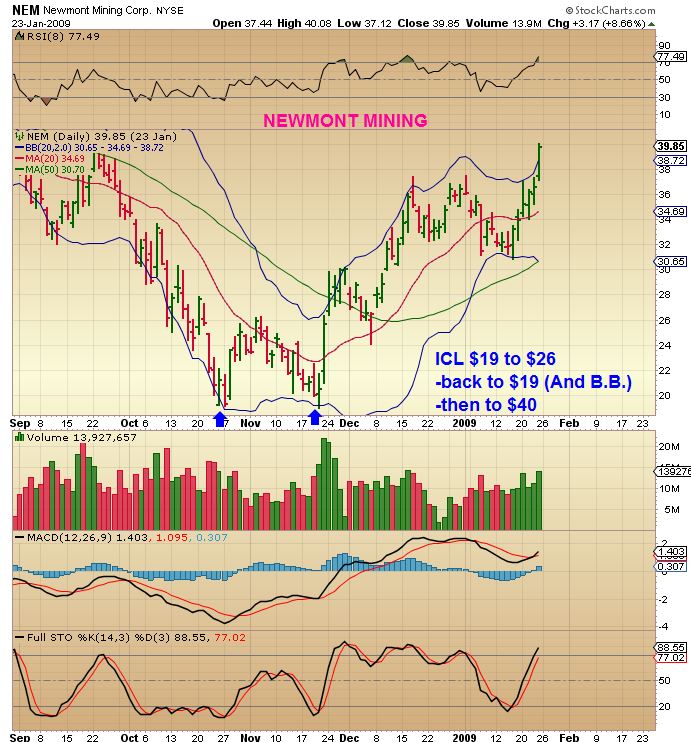
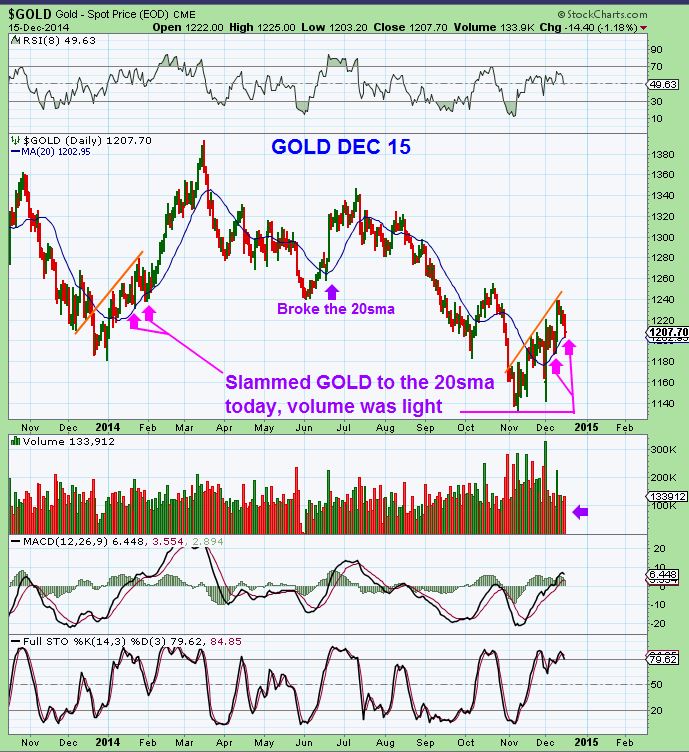
Yesterday I drew this…it shows that again, GOLD DID NOT FAIL. I got some emails asking about going short now that Gold failed, my reply was simply GOLD didnt fail, and I emailed this chart. Gold looks so similar to last Decembers first daily cycle.
What about GDX? IT SLAMMED DOWN, Right? Broken uptrend? Is that acceptable?
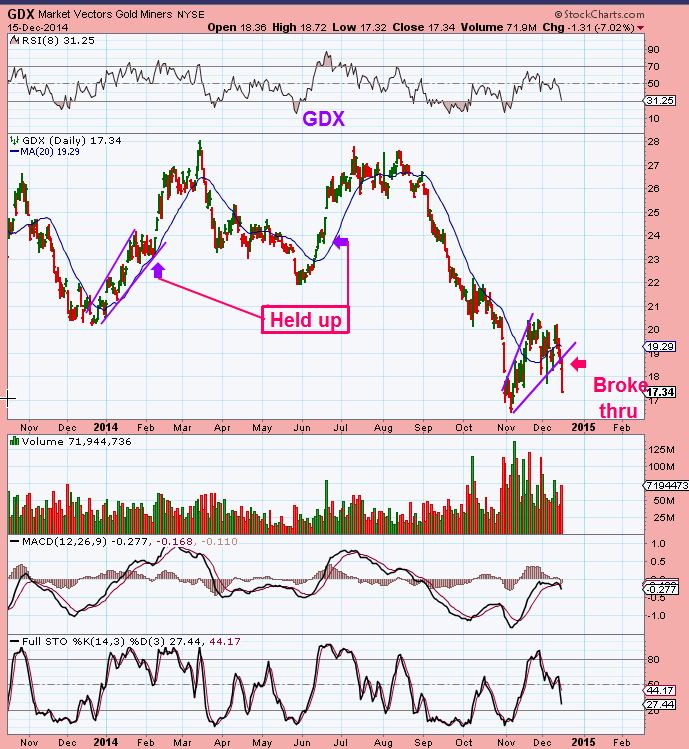
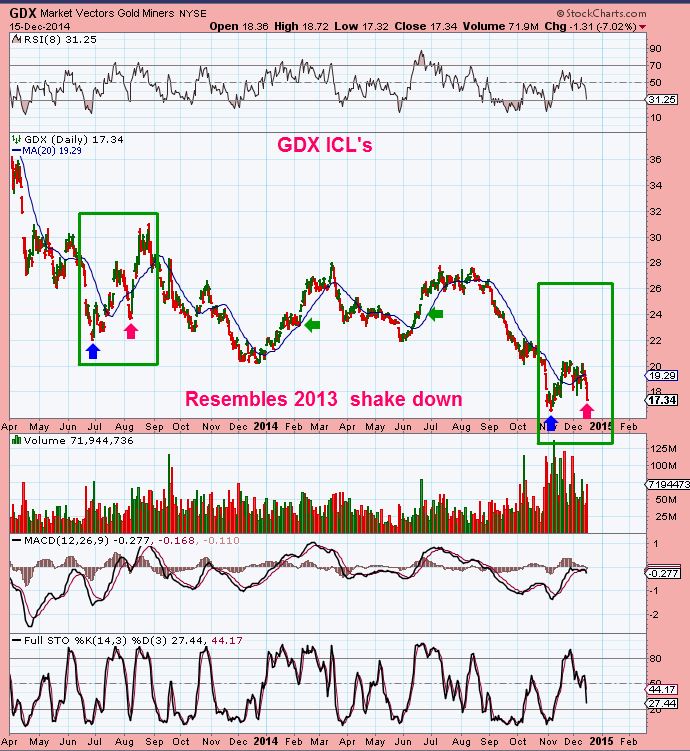
We use charts here, and see that it happens and its fine. GDX Did not FAIL. It looks like the shake out type dip from June 2013 lows
With all of this in mind, remember that the FED MTG is WEDNESDAY afternoon. Possibly more Rock N Roll! If you have a position still intact, I’d stay in ( Leverage is a different story and if you are choosing to use leverage / 3xETF’s , etc …I assume that you know what you are doing as a trader. You can decide to hold through the fed or not. leverage can be dangerous to the emotions). Gold can get whippy with the fed meeting, it can plunge and reverse again, or it can just rocket higher. Honestly there is no way for me to GUESS what the wiggles could be, but what I am saying is that GOLD HAS NOT FAILED, GDX looks just like June 2013 as shown above, and GDXJ may have done a stop run just like lows of 2008. With that said, we should still go higher in a run up of a 2nd daily cycle (but the Fed MTG may cause large swings). So you may want to enter LONG only after the 50sma is gained on the 2nd daily cycle, or find some Miners that are holding up well.
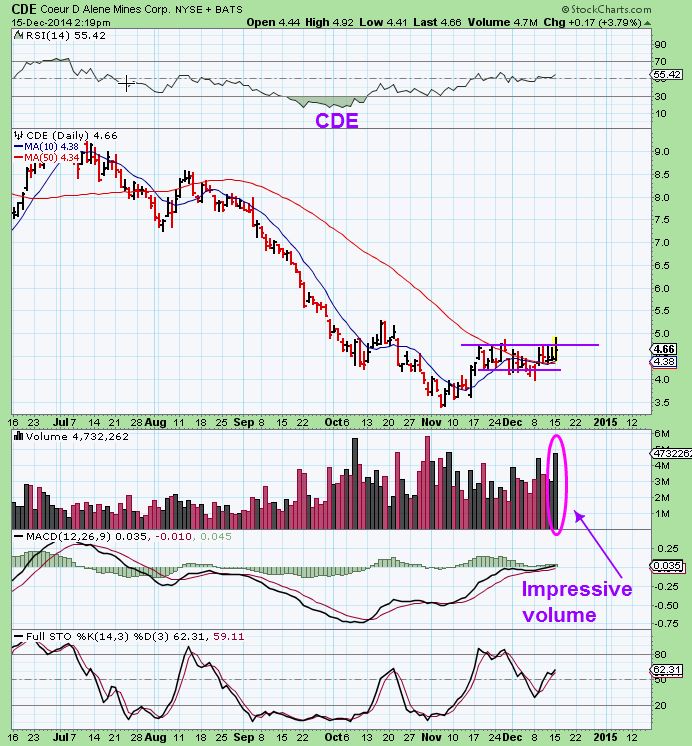
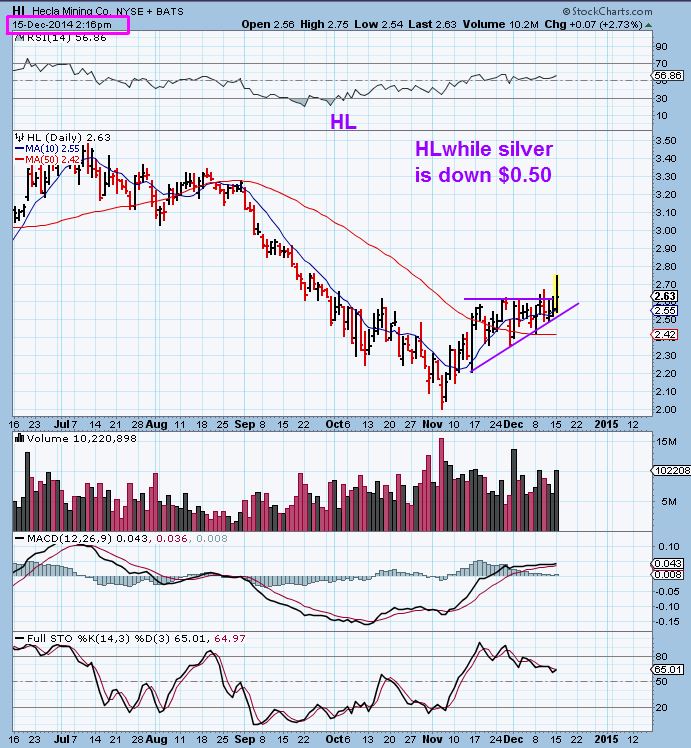
I mentioned that yesterday many SILVER STOCKS were up quite a bit on high volume until 2: 30 p.m. While Silver was down $0.60 – I think that was a sign that some miners were still being accumulated. These are 2 examples at 2 to 2:30 p.m. yesterday – while silver sold off. There were more.
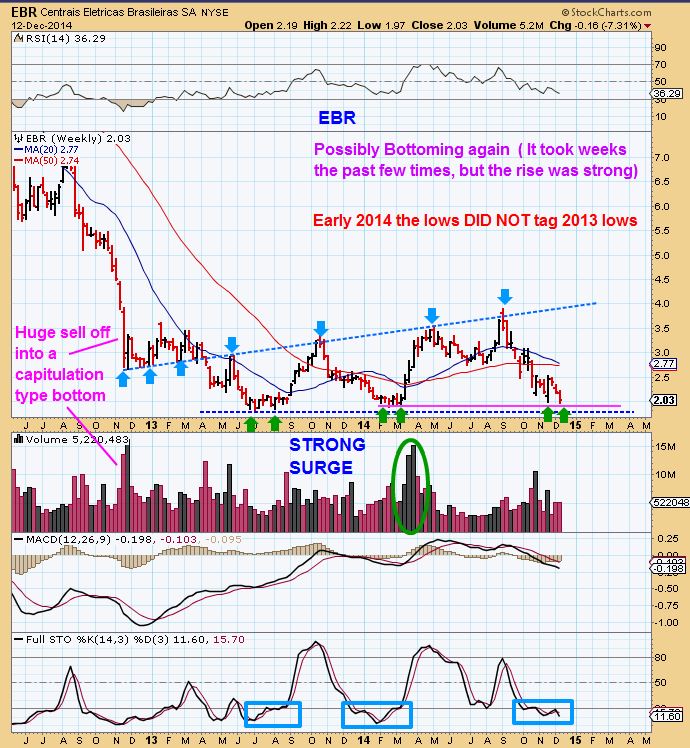
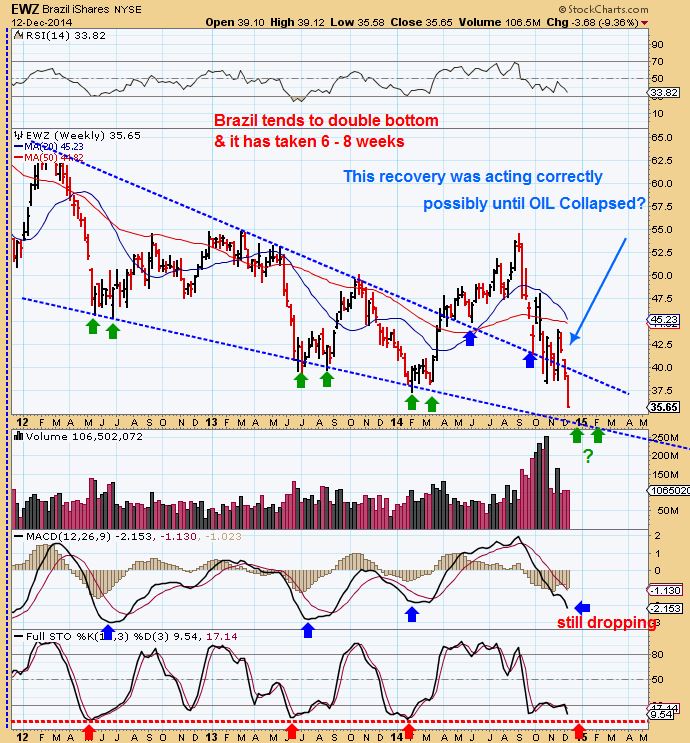
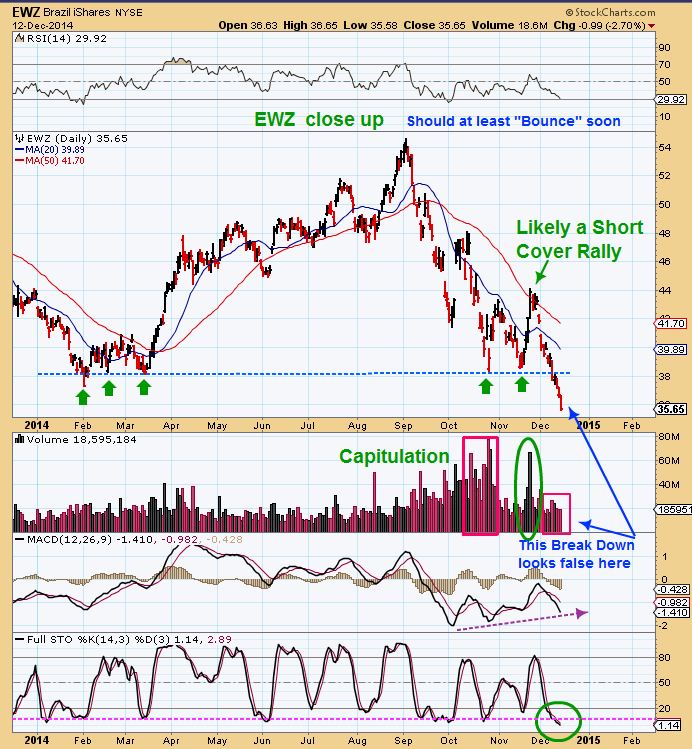
I promised a reader 3 charts on Brazil stocks EWZ & EBR. They do look to be possibly bottoming, and the run up from here is usually strong, but the bottoming process was also often weeks long. Here are the charts. (Read the writing on the charts)
My write ups on the general markets from yesterday has not changed. We gapped open BIG (Dow up over 100 points) and gave it all up. THAT is concerning. You may want to re-read the weekend report for $SPX QQQ etc and then WHEN we get a bounce, it may be a short opportunity instead of a long. Using cycles for the markets, you would expect a Hugher High, because it too was Right Translated (IT peaked at its high of the cycle more than 1/2 way through – this usually leads to another higher high). Time is needed to watch this, but I thought that the markets showed signs of real weakness lately.
LASTLY- I have mentioned that I would comment on 8 yr cycles. Some expect GOLDS 8 yr cycle to have put in a lows around the year 2000, 2008, and expect one for 2016.
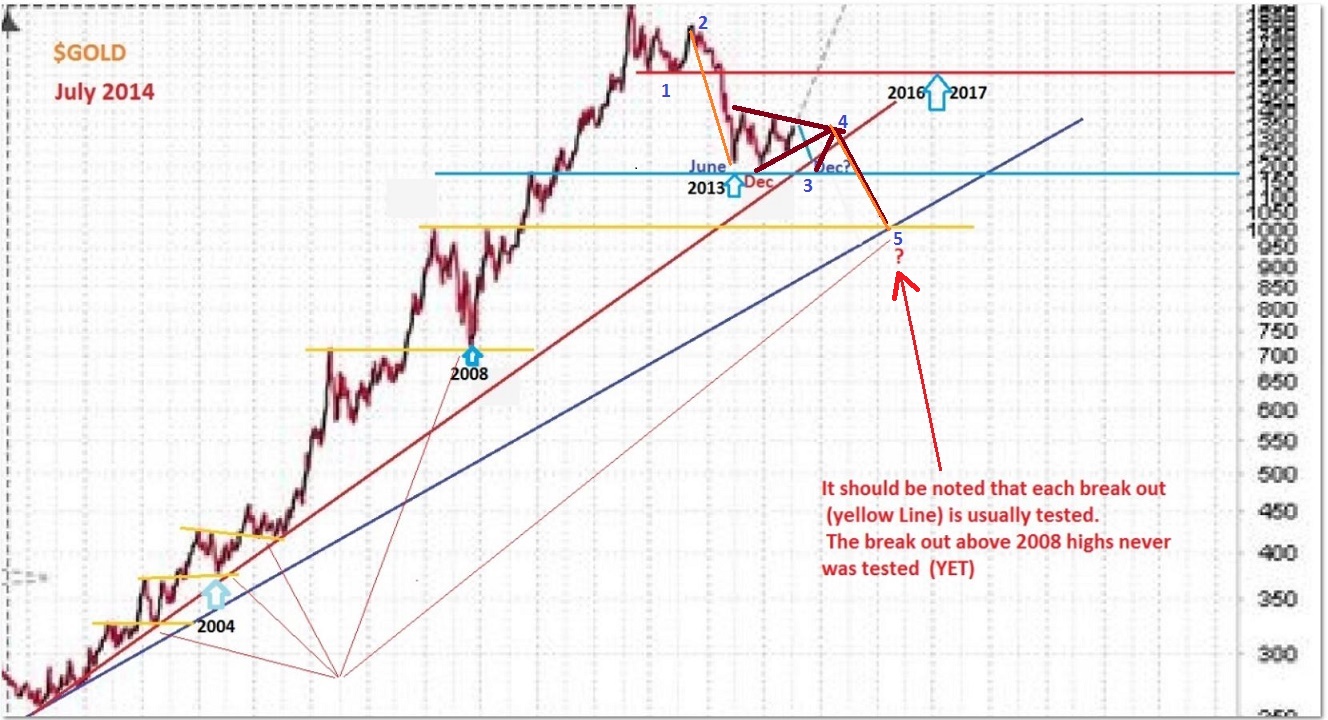
The lows for 2000 & 2008 do show up on the charts, so I wouldn’t argue against it. I also notice dips every 4 yrs. 2000, 20004, OCT 2008, June 2013 ( yes, thats 5 yrs, but really only about 4 1/2 yr beyond OCT 2008 lows). So let me show a chart that I had drawn up in JULY 2014. I have added notation to show that
1. I DO SEE that a low around $1000 could come at 2016. This is why. Each yellow line is a break out and back test. 2008 was never really back tested.
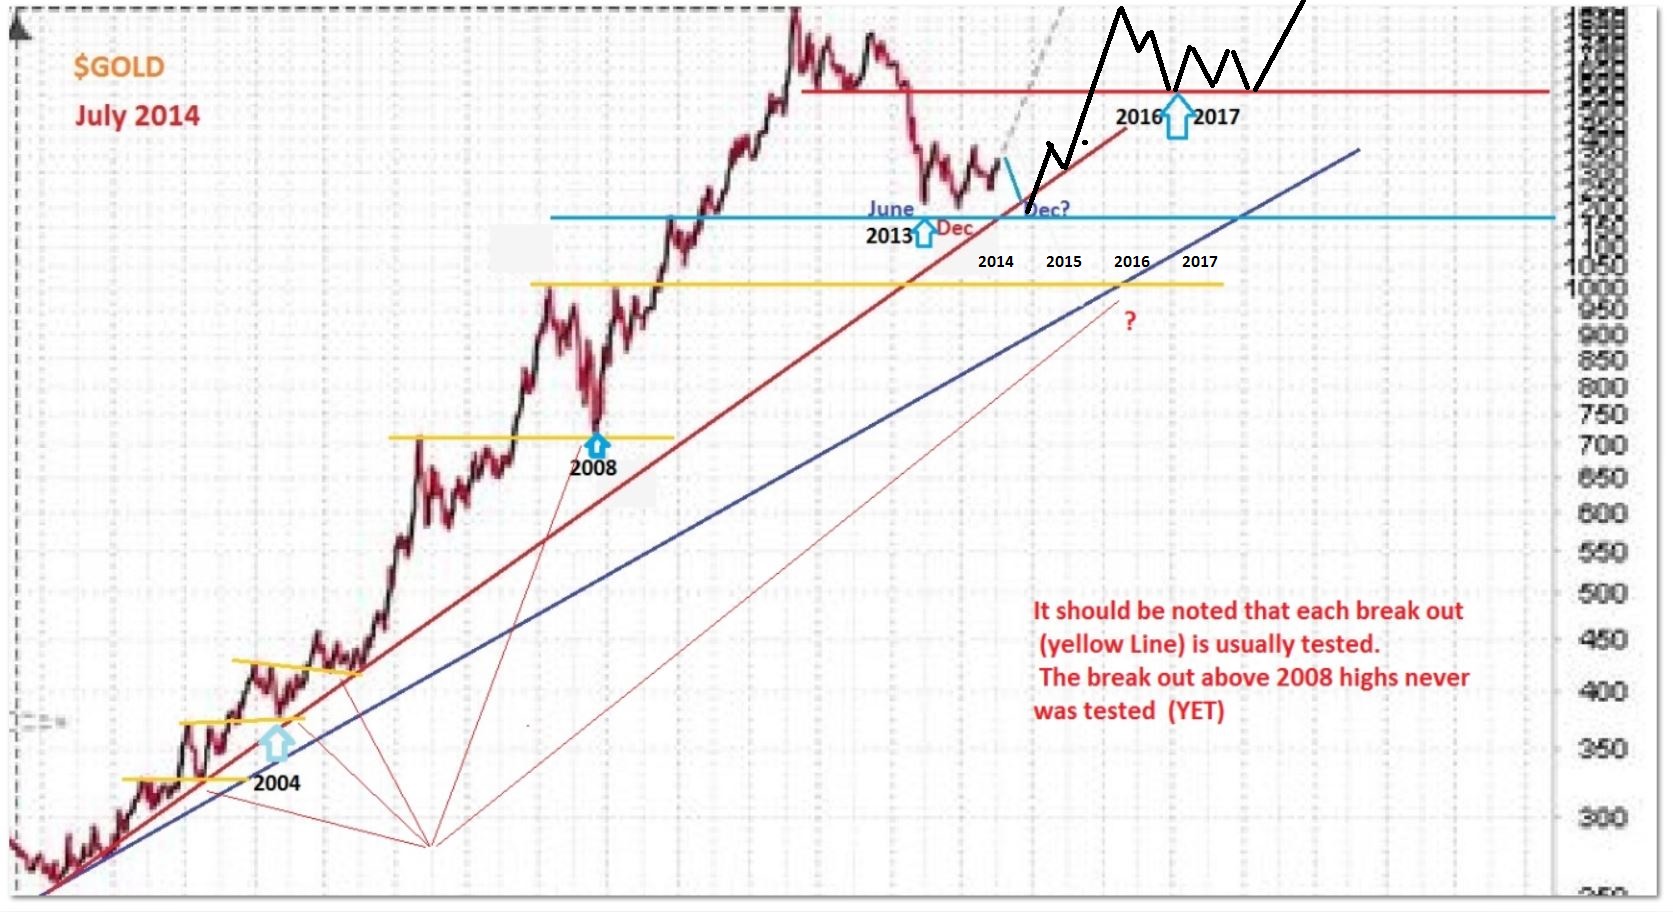
2. IF GOLD PROVES TO BE STRONG due to inflation and just runs away…I envision that a low (4 yr & 8 Yr) Can be higher. Why? Because the 2004 was higher than the 2000 low. The 2008 was higher then the 2004, the 2013 lows were higher than the 2008 lows, cant the 2016 lows be higher than the 2013? You only have to wrestle with 2 things that I am thinking of. Does that 2008 break out move need re-testing? And DOES the 8 yr cycle being extremely left translated mean we have to form a lower low, back down to $1000. The higher low chart might look like this… inverse H&S

Just thought I’d throw this out there. The stock market is very deep in it’s daily cycle with the McClellan oscillator severely oversold. Oil is very deep in the intermediate cycle and clearly in a final bloodbath phase. If some kind of fundamental change happens in the energy market, like say Putin caving on US demands and OPEC immediately makes a cut in production, oil is set to scream higher out of these extreme oversold conditions. That would likely launch the S&P into a monster rally out of the DCL.
Gold would have to find a way to rally with all that liquidity flooding back into the stock market and energy market. I wonder if it could do that?
Thx and I do agree that OIL & The stock markets are deep in their cycles and ” due” for a move higher. Almost everyone is bearish on OIL now (Thats good) , but still rather bullish on the markets I think. I still hear on CNBC that energy might be the best plays, so I wonder if OIL will just rally & bottom for a while like Gold has. Gold has rallied and bottomed at lows for 1.5 years, so money flooding back into Energy may be the same as money was supposed to flood into Miners? I guess anything is possible, so we just watch things moving forward. ( I cant see Putin caving in – He seems strongly resolved and that would seem like defeat. Maybe they come up with some agreement, stranger things have happened). Definitely have to see how things play out. Thanks for your thoughts – Gary
.
What are you looking for on your charts, that would indicate we have a DCL in stocks. I added a starter position in UPRO at 120. I’m looking to add more, but looking for more confirmation.
Thanks
Looks like you answered most of my questions in the latest post…..thanks
Hi Harry, sorry I missed that while I was writing another. I Like the set up in SPX & DJIA & QQQ in support areas , but at the same time the FED MTG can cause a little volatility so that its hard to have a good ‘stop”.
Look how far below the 50sma the DIA and SPY went before reversing. THAT likely stopped many out. The same could happen tomorrow, but cycle timing dos indicate that a reversal is due. Todays reversal is a start.
Alex…. are you still thinking the Nov 7 low was the ICL ???
Thank-you!
I am Guert. I am convinced that it was an ICL. We even broke the weekly downtrend line in GOLD . The RUN UP in GOLD from NOV lows did what it should have done for a 1st daily cycle I just cant say 100% that it wont “FAIL” and drop to new lows. (I see that Miners have been less explosive, so I have to pay heed to that for a little bit). IF GOLD DID break down now, this early in a New Cycle…. we would have so much downside that I would recommend flipping short, but I just dont see that happening yet.
We still have that Fed Mtg though, so I am watching things play out
I’m so drawn to this pattern which may repeat. Compare DUST from February-September 2012 and July to the December 2014. Note the H&S pattern which appears to be negated in July 2012 with the rise to 30 when it just went sideways and then collapsed as gold zoomed upwards and NUGT more than doubled. Now, that same H&S pattern appears be developing again. If the pattern repeats, we could go as high as 38-40 on DUST as it seemingly negates its H&S pattern giving the “all clear” sign to the shorts. If the pattern repeats I can envision gold falling but NOT failing its cycle while the shares get pummeled for a while more and then reverse hard for a month or two when the real shorting opportunity presents itself in the first quarter. Just something I suppose worth watching for entertainment purposes. We should know next week where we stand with this pattern. Best!
Thanks for the write-up. Gold still in the cycle as you described and certainly the strongest of the bunch. Today’s action was crazy with good getting Rus/market fear $ in and out rapidly. Rough two days for silver. I would still submit that GDXJ and GDX are still sitting on FAIL right now. Not saying that they can’t pull it out but as often leading indicators looks bleak. Fed could be game changer so reserving judgment until then. If we don’t pull out of tailspin soon it will be game over.