
Wednesday June 21
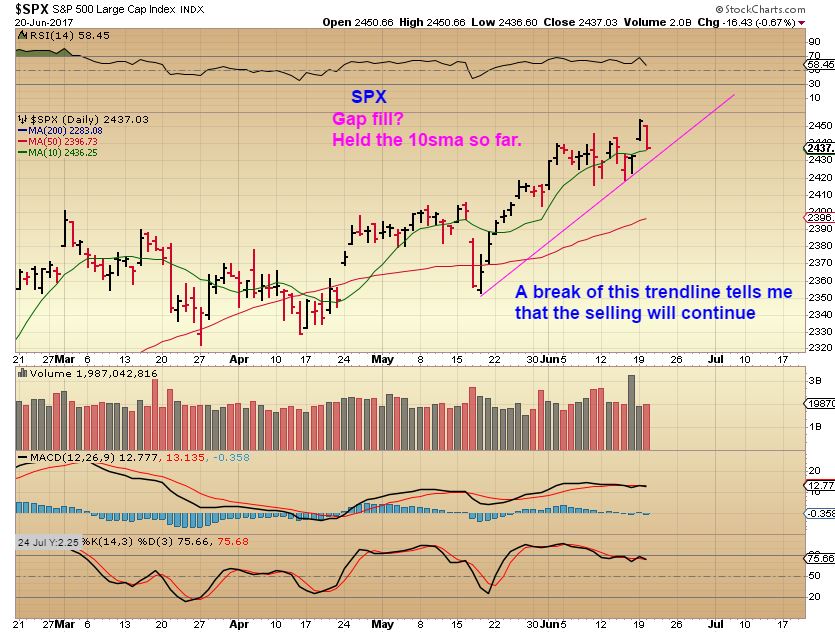
So far, The SPX has put in a swing high every 4 days or so, 🙂 and here we see another one. Since we are getting late in the intermediate cycle, and since we are on day 22 of the daily cycle, I am watching each swing high as a possible top. A break of the lower trendline could escalate the selling, so my stop would be below that.
The NASDAQ…
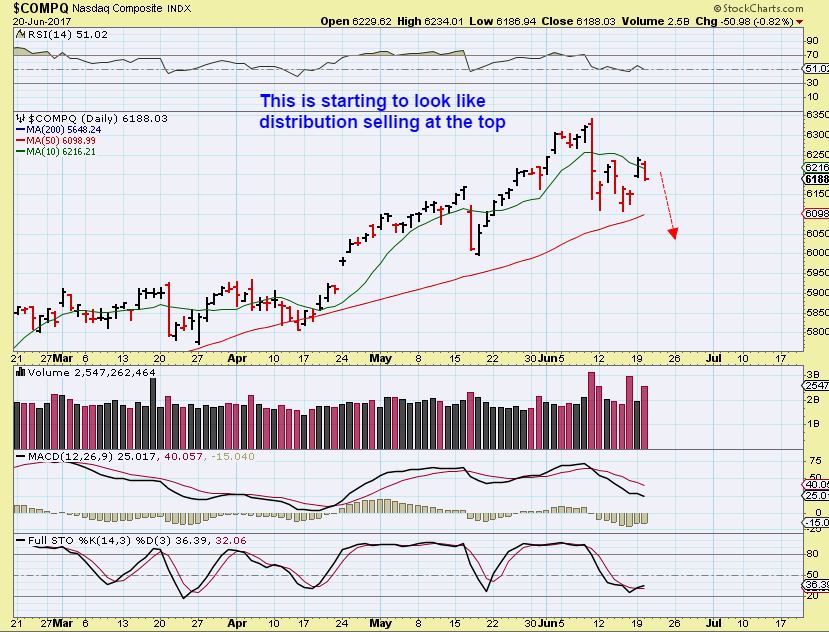
This is starting to look like distribution selling, so I would be alert to the NASDAQs action here. Did you notice that the SPX hit all time highs Monday, but the NASDAQ is floundering a bit? We are over due for an ICL.
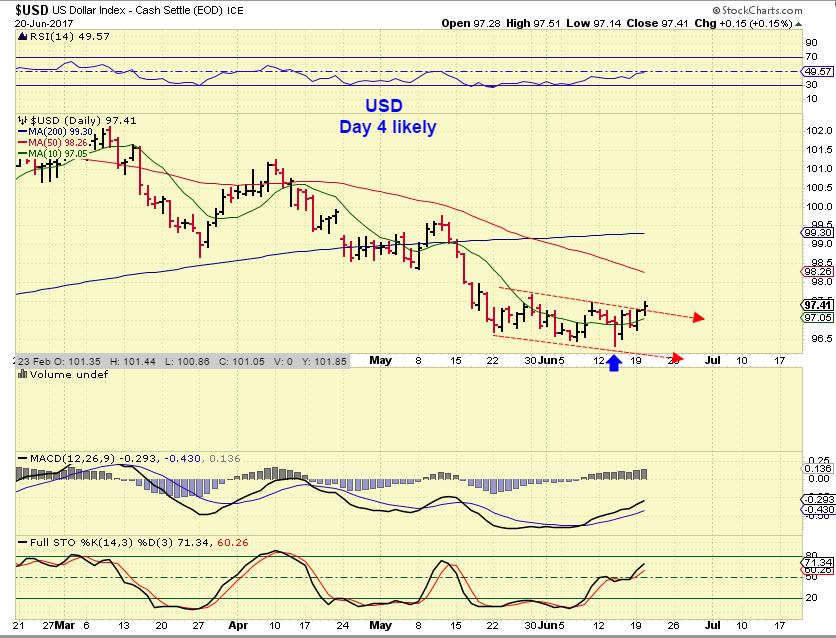
THE USD – Day 4
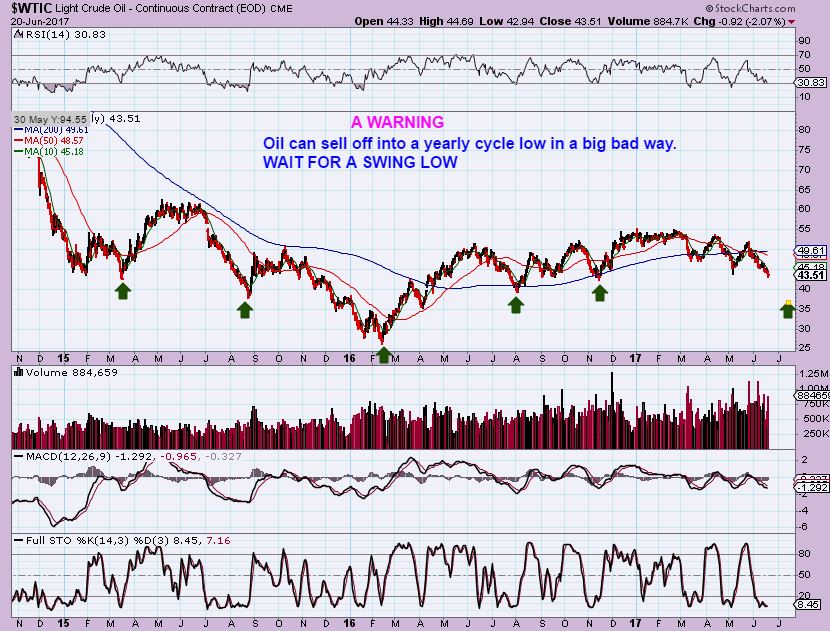
WTIC – As I have been saying, I am waiting for a swing low. I have Not been trying to jump into Oil only to get stopped out again and again. On Tuesday Oil broke to new lows, so this tells us that the ICL was NOT in place in May. Why am I being so patient?
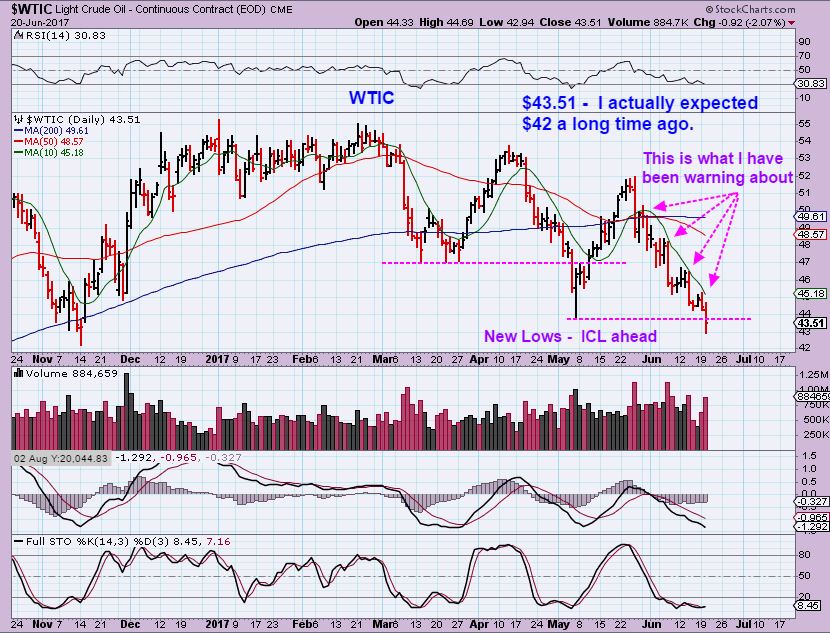
WTIC – Oil is due for a Yearly Cycle Low type of an ICL and Oil has been bouncing around a longer term support area. If this support breaks down, selling can escalate rapidly, so I am NOT jumping the gun or overly eager to try to catch a low here. A swing low will form and offer a safe entry.
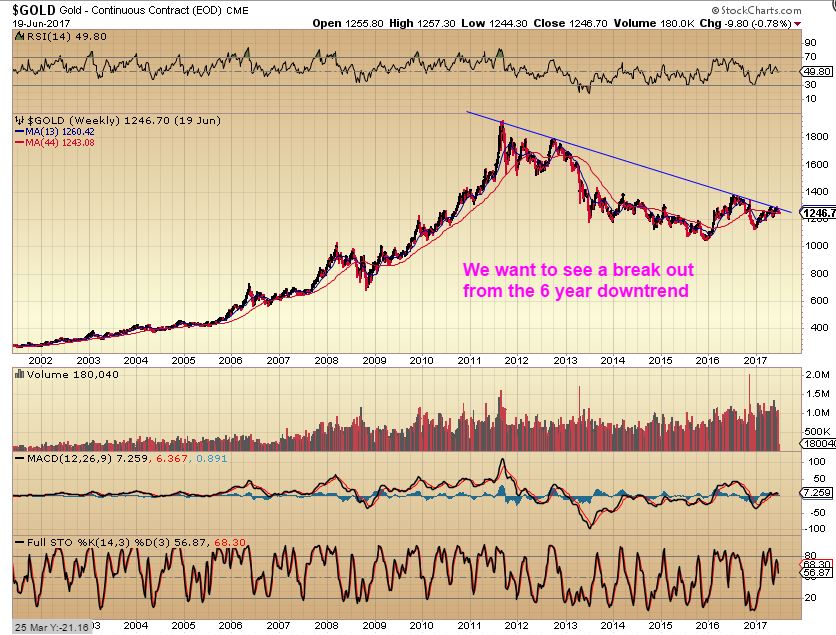
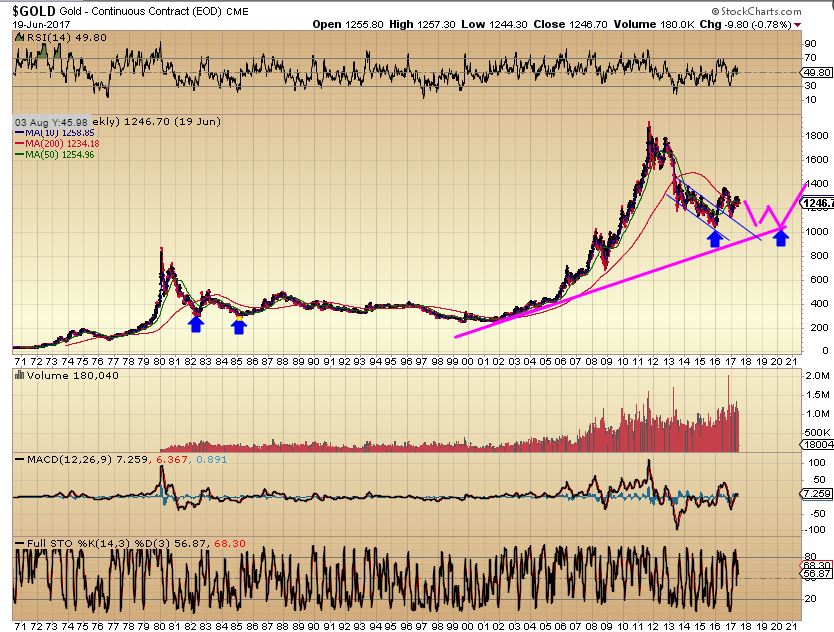
GOLD – Day 30 on Wednesday. Gold sits on the 200sma, will it put in a swing low here? The timing is right.
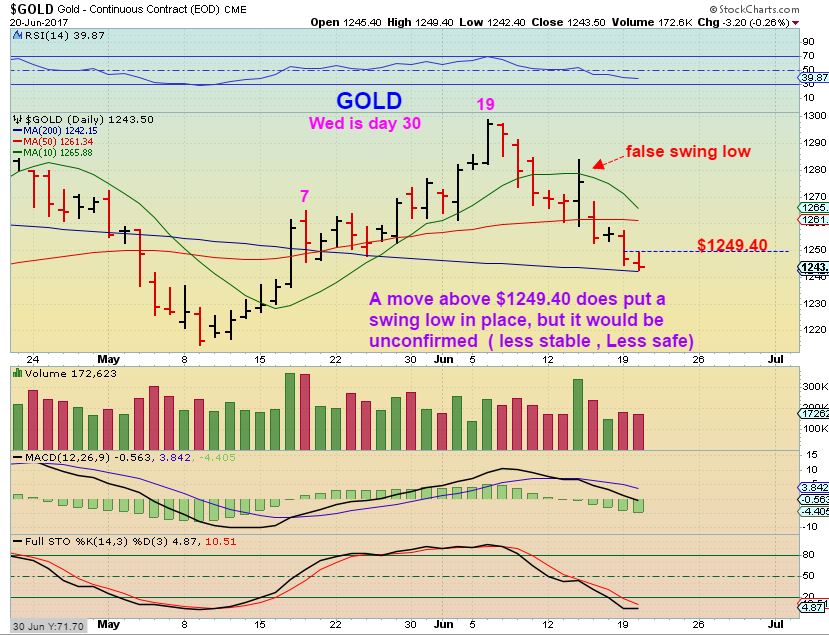
GOLD – In early June, Gold started to sell off into its DCL ( possibly ICL) and is sitting on the 200sma. We are due for a dcl timing-wise. One more time for the sake of clarity…
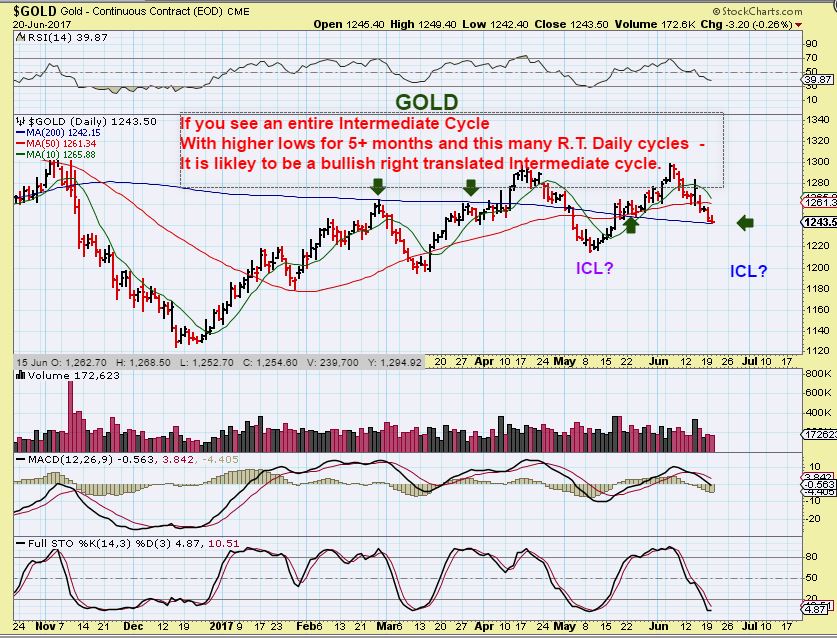
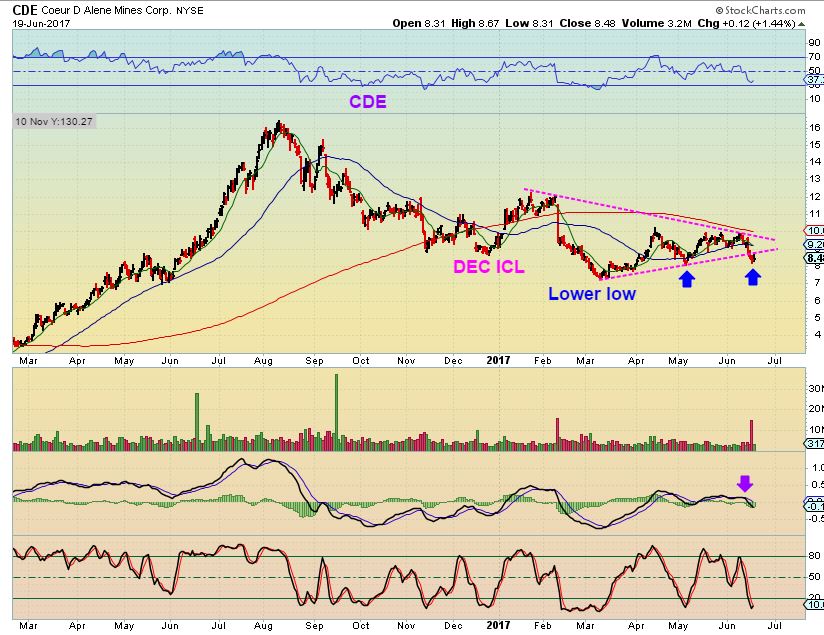
– GOLD DID NOT HAVE THE HALLMARK INDICATIONS THAT WE LOOK FOR WHEN SELLING OFF INTO AN ICL IN MAY, SO I COULD NOT LABLE THAT DROP AN ICL. IT IS NOT POSSIBLE TO TELL IF GOLD HAS PUT IN A STEALTH ICL IN MAY ALONG WITH SILVER & MINERS, OR DO WE JUST HAVE AN ICL STILL FORTHCOMING IN BOTH? Notice that Gold has made higher lows, higher highs, no failed daily cycles, All Right Translated, etc. etc, etc. We have to play it safe and allow this to play out to be safe. As pointed out in the report yesterday, Silver looked like an ICL occurred, but SILVER STOCKS like CDE, AG, SSRI, PAAS, ETC do not. We have not been left behind, we have not missed a major rally. SO I wait patiently for the market to explain itself. 🙂
At times, I watch the YEN for clues, as mentioned in the past
XJY – The YEN did sell off sharply in May and resembles Silver & the Miners. After bottoming in May and bouncing, that selling continued after a false Pop ( like the Miners had) with the Fed Hike last week. This also seems to indicate that Precious Metals may have put in an ICL in May, but a sell off of equal force could also occur if it didn’t.

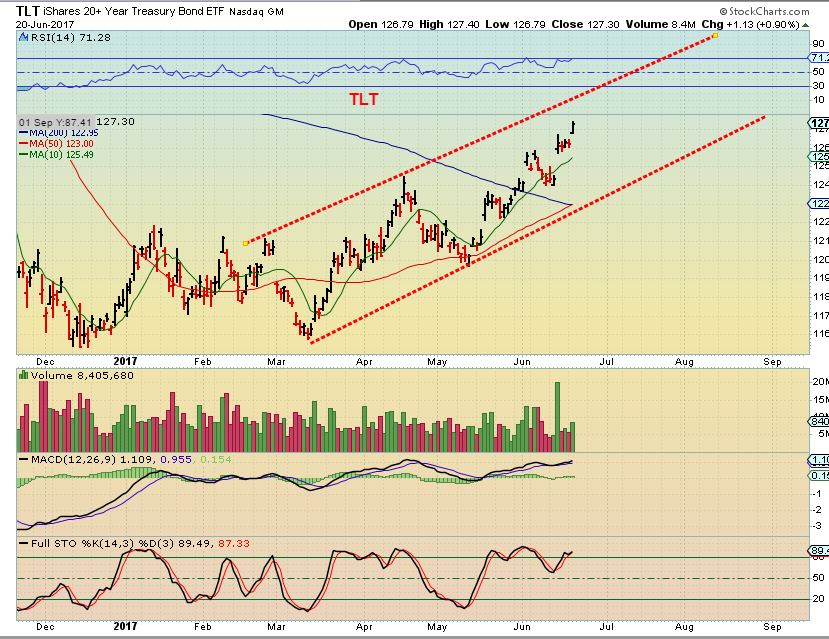
TLT – You can see that the TLT broke above the April highs and it continues to run higher. No clues on Golds circumstances here. As for the TLT trade? Maybe a tag of the upper trend line, similar to the strong March – April run?
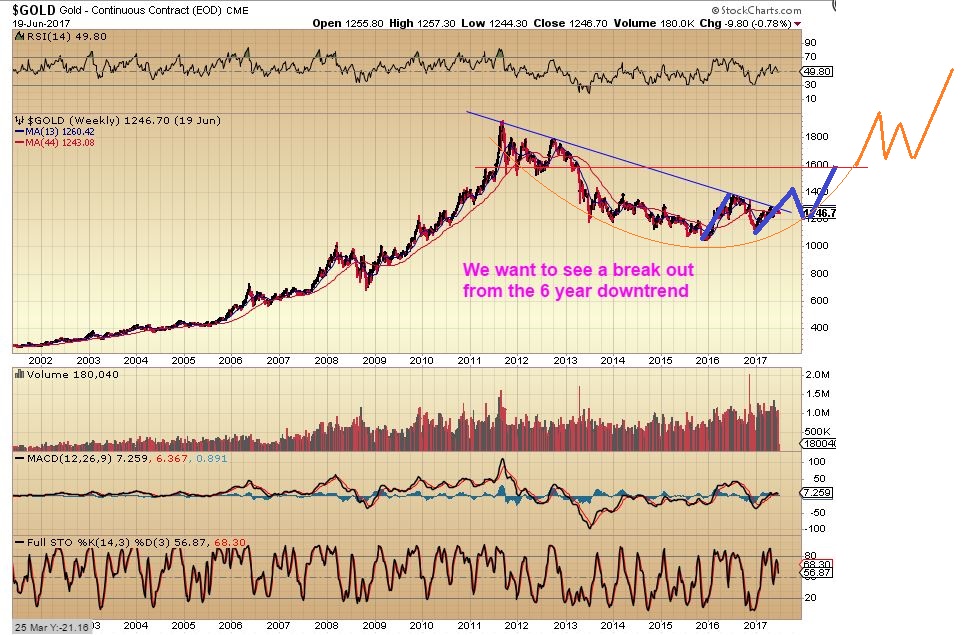
GOLD 6 YEAR TRENDLINE – This is really what we are watching. It is a pretty big deal for investors
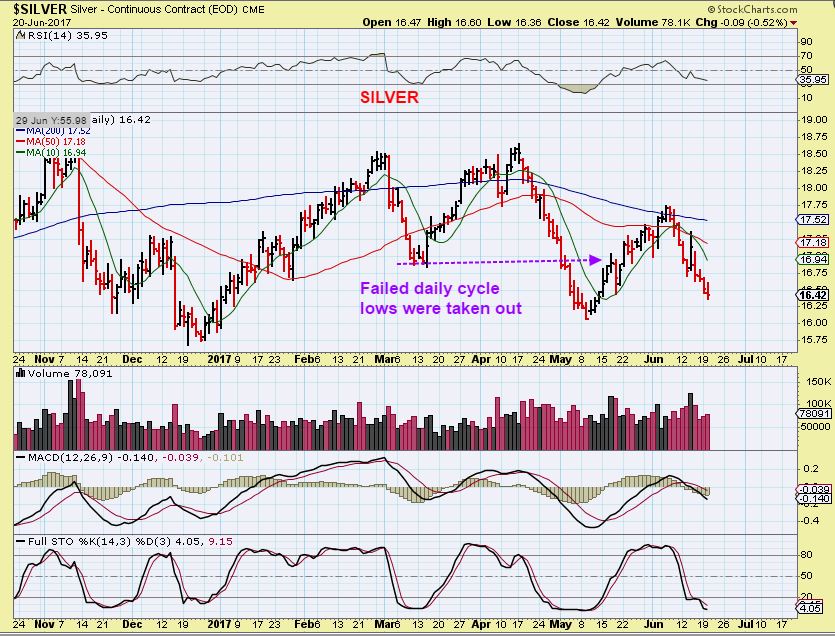
SILVER – Silver is now almost at the May lows. Obviously, if Silver breaks the May lows, May was not an ICL for Silver.
IMPORTANT NOTE:
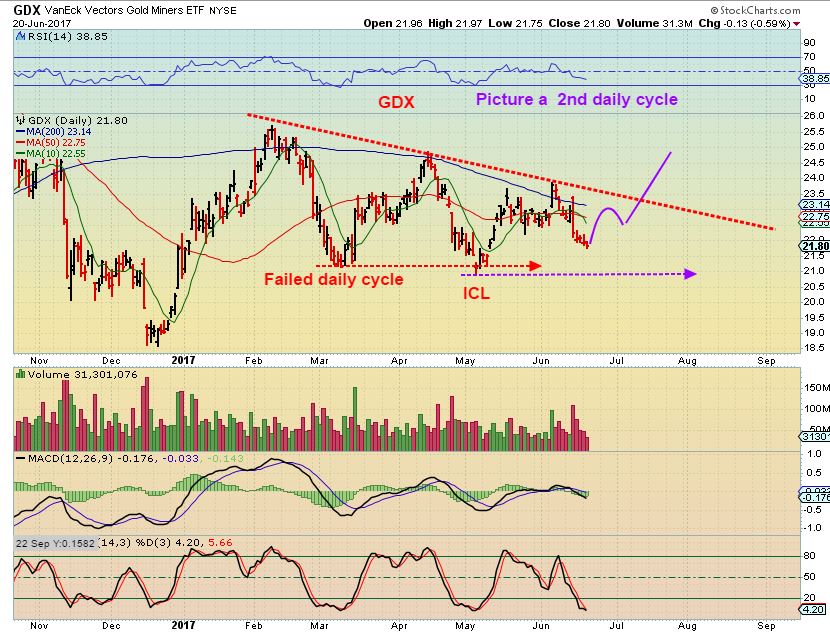
I am thinking that if we get a swing low soon, it is almost worth taking a trade or two like I did with GORO and GSV recently. Why? Just in case this is the DCL after a May ICL, and this would be the start of a 2nd daily cycle. As pointed out, we didn’t miss a huge rally in CDE, AG, SSRI, PAAS, and other Miners out of the May lows, since they are back at thier lows, but some miners are looking rather healthy. Also , the rally out of May was R.T. at this point. THAT should not happen in a 4th daily cycle that is supposed to be weak. So we definitely still are getting mixed signals. I’m looking to see if things break down soon, or do we get a proper swing low? It might be a good time to buy at a swing low, with a tight stop. I will post opportunities at that time, or maybe even in tomorrows mornings report.
4 GDX charts
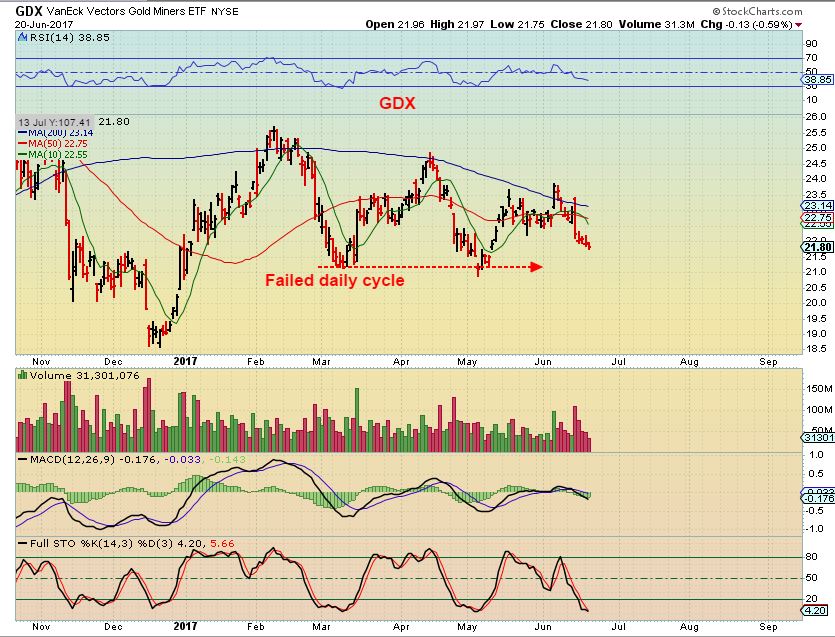
GDX #1– In April & May, GDX did have a failed daily cycle with a lower low and a lower high, so it could qualify as an ICL. This could be a higher low if we get a swing low in this area. Notice that the daily cycle peaked recently, causing this to appear R.T. unless it drops for many more days.
GDX #2 – If May was NOT an ICL, we could picture even another daily cycle and this triangle continues to form.
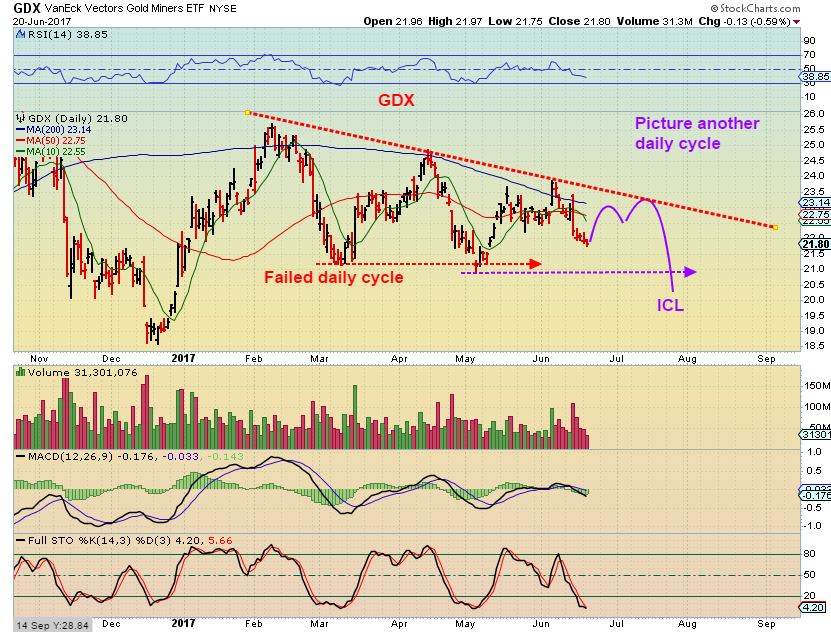
NOTE: TRIANGLES mess up cycle counts, and I have experienced it and pointed it out in the past. They look weak due to a lower high inside of the triangle, but a break out higher is Bullish. I am wondering if we are seeing that here, with this triangle formation.
GDX #3 – If MAY was an ICL, we could see a dcl soon, and start a 2nd daily cycle that breaks out. When the time is right, we will jump into those trade set ups.
Yesterday I showed that CDE, SSRI, PAAS, etc are at lows, along with many other miners, so we haven’t missed a strong run. I also noted that this looks like a possible Triangle formation and could become very bullish on a break out.
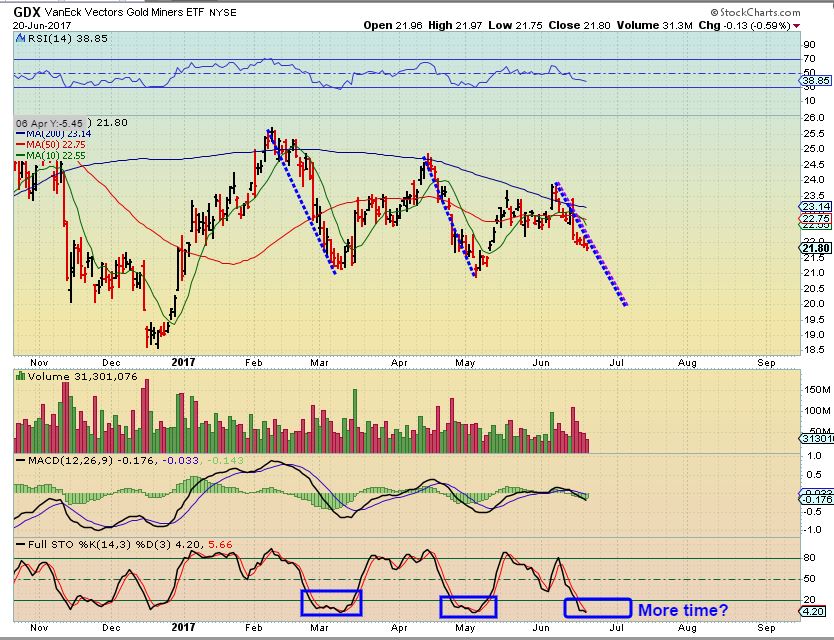
GDX #4 – A sell off into a future ICL within this daily cycle could also come from a sharp drop this week. Notice how the stochastics stretched at prior lows. This means that we would have time to sell off.
Nothing has changed, are expectations are laid out before us and the markets will eventually show us what is going on. The waiting is the hardest part!!
.
~ALEX
.
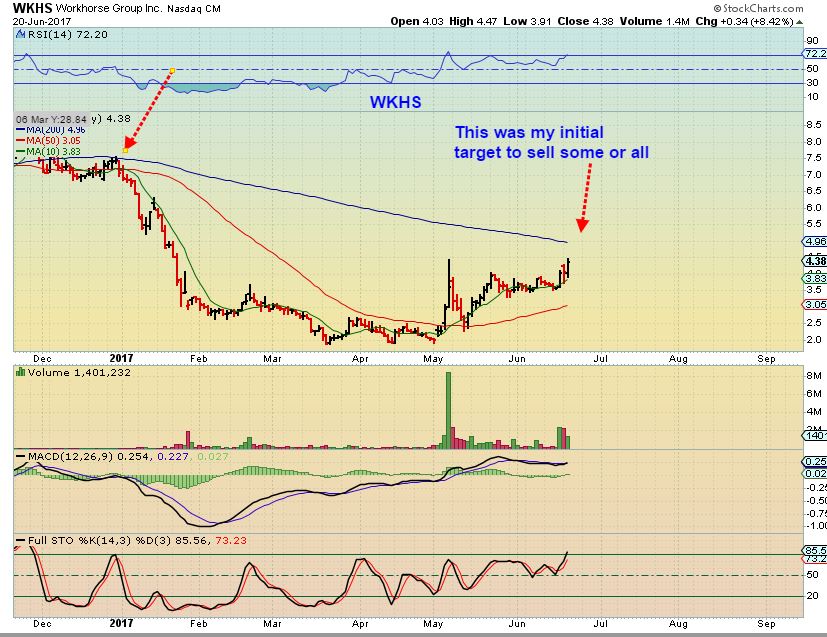
WKHS – My original target for those holding. it COULD break out, but I think that it will stall here first.
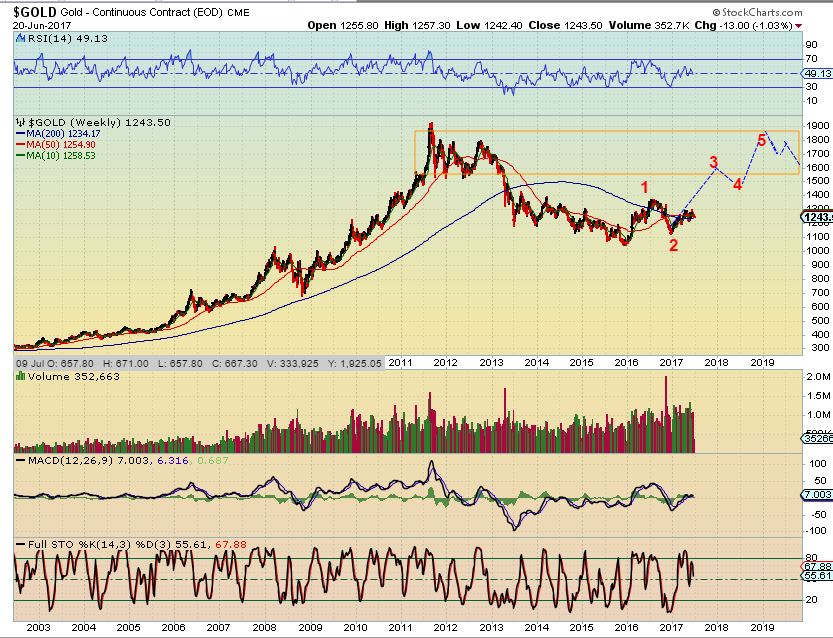
GOLD IN A LARGER CONSOLIDATION – I was toying with the idea that GOLD could act deflationary and bounce around instead of racing up to the $1500 area right away, but this is not my primary thinking.
This is my primary Big Picture View for GOLD – After breaking through that down trend line, we could back test and eventually form a cup like consolidation that would soon break higher. I DO think that we will need to see Inflation pick up for this to happen. Time will tell.
Or a 5 wave move brings GOLD back up to the highs.
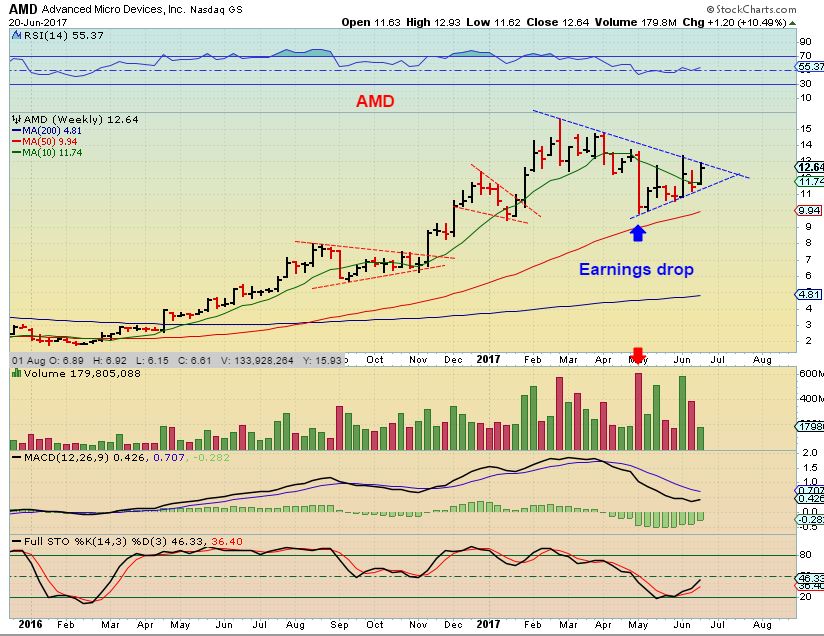
ON MAY 5th – I mentioned that in the markets I watch various stocks in sectors that are impressive. I have mentioned FNSR, CY, MU, NVDA, etc, etc, and AMD. Notice that strong run that AMD started to put together, but earnings dropped it to the 200sma. Would that slam down exhaust selling and act as support?
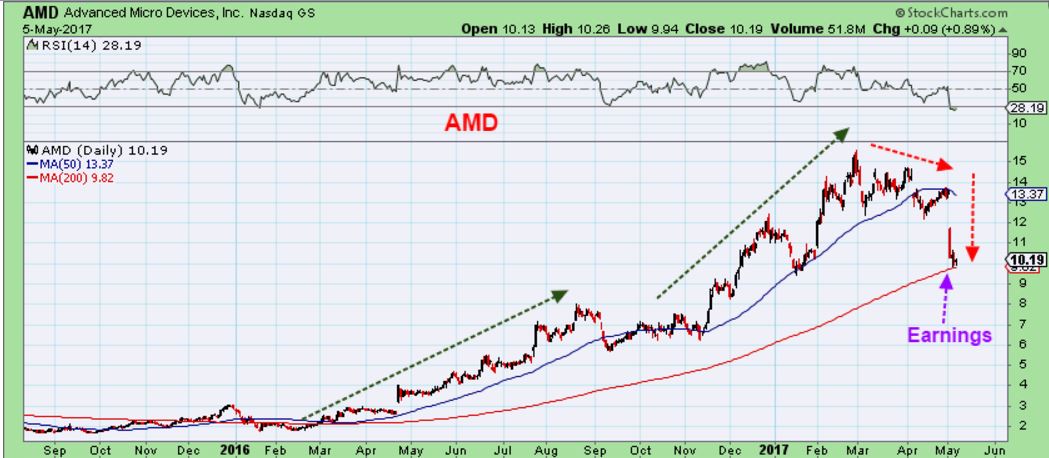
AMD – The selling stopped in that $10 area and it is recovering. If we do get that blow off top in the NASDAQ, this is one that I think could do well over that time. It also could be bought on a break out of this downtrend line With a stop, in case the markets do sell off into an ICL.


Thanks for the great report.
You are right patience is a virtue.
You are also correct that we haven’t missed anything in the miner stocks; they are just chopping around most with a downward bias. I wonder what will end up turning the tide?
Have a great day!
There is so much action in the markets, and with Energy & Precious metals, I think that it is really going to lead to some nice trades and good gains. Trying not to get chopped up in the meantime is key. Patients is the hardest trade to take for many in the markets.
Edit: Myself included at times 🙂
https://uploads.disquscdn.com/images/c39c967d62e548ee44f4f4b48398eef8df06cd0e75d442c1bc03fb1474ecd77d.jpg
u mean u R a Dr.?… all this time and u never told us? ;o)
Dr. —> patients … teehee
ps. i luv how u show the many different possibilities – ex. the different GDX charts…
pss. I have this quote close by when I need it… it really does help me get the ahhhHaa .. .quickly..
*okayyy….back to the balcony 😉
CF, how about a chart for the GDXJ?
Hi Nancy
I’m kinf od keeping an eye on a few things, no time to draw right now…
GDXJ has held up a bit better than GDX, but no real difference in cycle count or the performance.
Pull up a chart with a 50sma and a 10 sma.
GDXJ is not oversold, so it can drop further, though both GDX & GDXJ are currently up a bit.
Hope that helps for now
Thanks for the commentary.
Sure, Today GDXJ looks like it might run to the 50sma, I’d watch that and see if it keeps price from advancing, or if it can break through and close above. That would be a start to something that might indicate buyers stepping in..
Thanks
Hi Nancy, I don’t have one for GDXJ but I do for GDX. I see it as a 3 drive pattern and a Shark pattern going to around $21.25. I am biased though, I am short with DUST and GDST. Expecting GOLD 1220-1230……
https://www.tradingview.com/x/8G7wLbBK/
Thanks for the chart. I only create my own simple standard charts, no fancy ones! But like them and find them helpful. Love your colorful ones! [artistic!]
From a step back look, I just feel gold should drop more. I have one position in JDST that I want to exit, so trying to get an idea of when. Thanks again.
I think 1243 is a bit of support, so a bump higher in gold here is likely, Im holding my shorts unless I see some volume start working against me.
Post some chartage Nance!
btw… URRE.. bout bloody time, but not taken out its descending PSAR yet
I like the improvement in that dog of mine, and even my UUUU improved a bit…but I have a LONG way to go before I can get out unscathed! I want a giraffe neck like Jan. with lots of volume! C’mon…where are the big boys?! It is so beaten down, they HAVE to play it at some point.
Alex,
Thank you for the Crude ICL chart above.
You have it in an “extended” ICL currently also….I think ? lol
Yes, Oil Intermediate cycles vary in length,
Is the water safe for MYSZ? Was watching it yesterday and this morning it looks like it wants to change direction?
I like yesterdays pop, but I’m watching the 10 & 50sma on that one too, so far the 10sma is holding down price. I’d like to see it burst above it.
Yikes looks like it’s shark infested – good thing I took your advise otherwise I’d be missing a few toes
Yeah, it turned down right at that 0sma. Good thing I took my advice too 🙂
I actually took a small loss on this already. It needs to show me strength before I get back in now.
hmm… MDR tryn to do a little somethin….
Yes, I saw that too ( On my watch list)
MDR being moved onto the S&P Small Cap on Monday – might be the catalyst.
EYES looked interesting yesterday, and has a little follow through today. It has a nice base.
and ziop .. ;o) nice … come on girl… keep goin ;o)
I still own INFI
I’m coming across some very large short positions in some of the oil related stocks REGI 25.3 days to cover, RES 18.5 days, PARR 20.3 days, REI 12.2 days. Could be a powder keg
XBI seems to be popping quite nicely (thanks alex for pointing that out yesterday morning). There’s probably a good chance that we will get a retest of the breakout, but any guesses/targets on how high we might go before/after the retest?
Refresh-
I was thinking that we might be close now ( $80ish) , but this also could just break out. Tough call at this point.
https://uploads.disquscdn.com/images/f4e5ceac94db5da30131354b681da81521a97c57b55a577a6abd14bfa12b18dc.jpg
Just entered UVXY and GUSH positions. 9.67 & 18.95 .. I’m taking a shot here that ICL top and bottom are in or close enough. Still holding JDST from 67 ..
I may be looking thru rose colored glasses but I see GLD, GDX (both broke their triangles-stops-and trying to recover back into said triangles) and SLV all trying to find their bottoms, technically all getting oversold…….
VALE: moving stop up.
I was just going to ask CF about VALE. Negative post today on Seeking Alpha..but I never trust them. I had taken very good profits on this way back but held some as a core holding and still have a nice profit, but am thinking of dumping if it seems weak so I could deploy that $ elsewhere. What are your views on VALE?
Hi Nancy,
This is just a “trade” for me. I really do not have any “insights” on the co. itself other than it would be an “infrastructure” stock play so …….
OK. What is your target area for short term?
2 hr. stochs to oversold technically ? Also the Daily ?
38% fib. level @ 8.96 ? (which is also a top in late April)
62% fib. level @ 9.89 ? ( also a top in early April)
Thanks. It looks strong again. I was watching when it dumped May 18. I thought that was such an overreaction to the news I almost grabbed some. Wish I had! Is that when you grabbed?
No…yesterday afternoon entry for me…Sept. Calls. 🙂
Yesterdays XLE hammer might have worked : )
Yea…nice Ann.
I should try not to jinx it : /
For those watching UNG/NatGas (yes KenDawg.. thats you)
updated 3day chart is now showing a near identical pattern to 2013.
rising MACD t/l could do to hold here
https://uploads.disquscdn.com/images/1a32c1fcb5cba21a71e2a940b37d08e50d77249fe346822f6b9b6fdc05bab074.jpg
you might have something there sog… this is the 2013 overlay… hmmmm – has a couple candle matches…
we shall see…
https://www.tradingview.com/x/1QassPUt/
looks close.. just need a swing candle , and bob’s your uncle
Yes…thanks SOG, I am watching for an entry in UNG.
Ya want to throw up your USO chart also for us ? 🙂
certainly..
Weekly USO…bottom of lower chn marked at 8.50
https://uploads.disquscdn.com/images/e9fd70d3fcf25b265a98d3ca8d9122676fccc466ab0196d96fcacb5831b1efeb.jpg
Getting close to the extended ICL ! Thanks SOG.
I am wondering if the 6.48 low in Feb. will hold ??? r/r pretty good imo…..
I’ve a feeling it will hold..
Even if ultimately heading lower, we’ll likely get an ABC wave back up, as in late 2014
I like it
Inventory report tomorrow. Last week saw a Pop ( Then a drop this week). See what Thursday brings
Just looking back to what UGAZ did following that late 2013 low.. it put on +250% in less than 3months.
including a -35% midway pullback
For anyone that HATES money , here is a comparison of UGAZ to actual Nat gas prices. In a perfect world should kinda track. So do the same thing with UNG:$NATGAS to see the relationship on non-leveraged 1:1. It’s completely ridiculous!! Shows the slip just with the nat gas contango. With UGAZ, it’s even crazier with the 3x. https://uploads.disquscdn.com/images/19245da862912a1d52ccdb92ec02ba5ded8697fed3557d0ea181d9c3ea813f8c.png
What ya saying Cas.. not to buy UGAZ?
Not at all. Just not to HOLD UGAZ. You could have bought NATGAS at $2.80 last August and would be up 9 cents on actual natgas, but you’d be down a TON on UGAZ. So you get NATGAS “right” but you still lose on the trade! Basically: 1) you can’t hold NATGAS products due to the slippage – even UNG, it’s not just levered positions and 2) leverage of course makes it worse and 3) UNG and friends fight the worst contango of any commodity that I follow. UUP and GLD don’t really have this problem. The 2nd worst? USO and it’s derivatives!
thx C
Hi Nancy –
Alex noted that the 50day MA might offer resistance for GDXJ – fwiw, the lower purple trendline on this daily chart happens to be around the same price
https://uploads.disquscdn.com/images/15e5f1b8b8417b39b90ebe3d08e92081b5975832905adaf60d295ba655dc2631.png
oooo thanks for the colorful pretty chart….now I will go examine it!
What is the slightly lighter but fatter violet curvy line? So price has fallen below your violet triangle trying to work itself back in..correct?
That’s the 200-day MA
Thanks Cal
That break in TWITTER ( TWTR) looks real.
5 Month chart using 50 & 200sma. Break above moving averages, and break of a down trend from MAY highs
Starting wave (3) possibly ?
Nice weekly on a 3 yr chart too
What MA are you using on your weekly ?
just came in to work from doctor appointment: did gold break lower today? (i.e. did it have a lower low?)
I had low of day at 1240.90
Yes. I have the low yesterday as 1242.4 and today as 1241.7 on TOS.
thanks both, so today is day 31 of the cycle and we need to go over todays high to have a swing low.
I have day 30 today, but I don’t count the low as the first day.
Yes, today is day 30, and with a lower low, you would need to see the follow through tomorrow as a sign of a swing
Bradley Turn Date today for Gold.
Who is Bradley?
C’Mon, Ask all the questions that you guys would ask me, if I make a bullish statement.
– SO how often do you see this work?
– What % of the time have you invested in these turns in the past?
– So are you “All in”
– What did you buy ?
LOL
*giggle
Hey I know you watched VSLR take off too.
I was watching WNDW to see if it would break from that consolidation, but took CSIQ instead for a trade
NO GUARANTEES 🙂
yes.. very nice.. ill check it out
And is this the ICL?
Oh yeah, that one too – lol
( But actually it would mean that May was THE ICL, since it was a lower low than the current one).
Are you kidding me that you have never heard Bradley Turn Dates ?
And that May could be an ICL, you didn’t even offer that possibility weeks ago…
And now you ridicule ? Seriously ?
Not all in btw….did buy HMY though, since I atleast post some of my trades real time…..
Attached is a chart for GDXJ (weekly). If we are still in a corrective pattern a lot of times in an A B C correction the
C wave completes in 5 waves. If so it looks like we may have a minor wave 5 down yet to complete C.
Also, since wave 4 is overlapping wave 1 we could finally be coming to the conclusion of this correction.
Time will tell.
GLTA
http://schrts.co/aM4KwP
Nice chart, thanks!
Man, oil. Wow!! And not at the inventory but later in the trading day…when this low comes it should be good. Crazy.
Why did I sell LABU!!!! Argh…
I know, right!
Refresh-
This is EXACTLY what I meant when I posted this chart today, and why I insist that patience is best . Even though I had been seeing some leaders like AREX, ERF, RES, it just wasn’t time to buy when OIL can seek out a YCL / ICL.
I do wish I stayed short
https://uploads.disquscdn.com/images/dcc00d48b0a109565664a69edde834f6b28eca26dd0bf666e98d37b9c8472c81.jpg
Yes. Knife catching is not fun.
Yeah, I see a lot of energy stocks down 6-10 %.
I do believe that the lows will produce a nice rebound, short covering rally when they get here though.
Nice call on energy stocks, Alex.
Thank You Ralph,
Once we get a real eversal, they might be a great buy for %-Gainers
Watching Nak whenever it is around the 200sma is like watching paint dry.
After watching the success of VSLR- I took a trade in CSIQ, it looks to be breaking higher.
My stop is the 50sma
nice… i took RUN….ehhh….its ok…
I couldn’t buy that today for sure – it already took off.
I just looked at SPWR…. HMMM. I need to check that out in detail.
That might be another candidate
holy cow batman… look at that 200 and 50 to the rescue…
*and the 100day
I know! I was watching WNDW , waiting for such signs of bullishness, and SPWR broke above and glided right back onto them – almost tagging them.
This is a good candidate if the solars are going to run
I just bought it. Nice close stop.
DO you mean SPWR- I like it .
It seems that this sector is benefiting from Oils sell off
Yes SPWR. But wouldn’t it work the other way? If oil is cheap, solar is not an advantage.
That would be a good point, so now you have me thinking…I need to think like a contrarian here 🙂
Maybe it goes like this…
Oil hasn’t been a good ‘investment’ for Mutual funds, what about the growth in Solar stocks?
Thus investors buying solar?
Could be. I don’t know. I know I bought VSLR a few years ago for my home here in Hawaii and was amazed at the saving at first. But then when Oil started to slid, I became somewhat disappointed because our electric bill although still cheaper then Hawaiin Electric wasn’t as much cheaper as it was in the when we first had Vivint installed.
It’s true the return on investment has been less noticeable due to Oils slide.
Similar to Gas prices when they were at $4 , owning a diesel truck you get better mileage and diesel fuel was even cheaper, but then when gas dropped back under $2, and diesel was a bit more expensive, it hardly matters what you drive.
That’s still pretty cool. The place we’ll move into next week already has SCTY installed!
Cool!
So here is another reason – there are those who are those who are investing heavy in solar to counteract the impact caused by the withdrawal from the Paris Climate Agreement
wait .. are those and those the same people?
😉
Refresh – you must have read it in almost real-time
lol…just joshin thelma….
Lol-
#spoiledBrat
takes one to know one… chotfreak
https://uploads.disquscdn.com/images/ad821b1576974b5ca97499c5efd29b57df43dae6d94ab3bac2064cca1a3774f5.gif
*ps. you are saying “i know you are always right princess jasmine… ”
lol
Of course I am…I always say that 🙂
(not)
I had already sold LABU and SCO. 🙁 🙁 🙁
I personally find it harder to stay ‘short’ than it is for me to invest in a bullish run.
Yeah, agree as over time stocks at least will eventually start to run higher. (LABU is bullish 3x). Oil was getting crushed, honestly that was a pretty safe trade with regards to r/r.
It’s really nice and lots of relief when the trade immediately goes in your favor as it lets you move stops up, take 1/2 etc. The pressure is gone as you know you are sittin’ on a winner. Doesn’t happen too often! :O
Alex, any thoughts on SBGL?
Could Gold and Miners close back Inside their Triangles ? If so that would be positive imo.
I am planning on taking a shot here before the close…..
my thoughts too. hence my SBGL question. Looks like an inverse H & S on the 15 minute.
idk … GDXJ seems to have found a comfy seat on the 34day … (on daily chart)
Party pooper….. 😉
Just above it’s 50 and playing with the 10 as I type …….. hmmm
just bot a starter in MAG
I am going to give HMY a shot…..very short leash though.
Soft commodities complex have been crushed last months. Looking out for a potential bottom in coffee here. https://uploads.disquscdn.com/images/18211bef603c20f843fcc28dd1fd38bce9ef85ed668dfcf6b94baa630adf32a5.png
Looking at JO it might be a tad early for me but it is close……
Trends in coffee tend to be extreme. So yeah, perhaps too early still.
https://uploads.disquscdn.com/images/03df8f21103b0c378f5212d6b7092cd71a91be0eecf2473a0d88738580580f7a.png
Yea….very nice Nord !
It’s the exact Opposite of XBI! 😛
These are really unusual charts [colorful and pretty too!]….what is that design the chary is laid on? It has a 3D effect.
Thx Nancy. These circles are merely “fib-circles” of support and resistance. This is made with standard settings on Investing.com (Futures has not live data feed to TradingView).
are you Nord on TV as well?
And that’s with the dollar pretty much getting totally hammered last couple months as well. :O :O :O
SPWR does look enticing……
Significant selling on strenght couldnt stop break-out chasers in XBI, I think the 82 scenario is in play and it may pan out this week.
https://uploads.disquscdn.com/images/fc2317ceb1b4f474e18291870243aaa671a7022b2f19543b5a011d59bc5e4b3f.png
Still a bit room on the heat before sentiment has to get crushed again.
Agree Nord…..
Thanks Nord….. are you going short with XBI @ or around 82?
Yes. I entered first small starter position right below 75. Around 82 I will enter second position.
It’s run away so high I’m considering shorting as well. But for me this would be a 1-2 reversion to the mean trade and nothing more. Just my play, that’s all.
AU breaking back above it’s TL…..
Thinking of you Nancy … And other CF members along the Gulf Coast. Hope you batten down the hatches and stay safe and dry.
Thanks for thinking of me…but I am on the east coast of Florida on the Atlantic and just watching how it unfolds this time for others. Hurricanes are never fun.
Miner count. Made it a while back so isnt correct regards to timing. Looks to me as the w4 of potential 5 still in play, that mean we should see a wave 5-5. Or if it want to extend even more, this might just be a wave 3-4. Find that less likely though. C wave should take out december low.
https://uploads.disquscdn.com/images/c0ae5540cee13ea3c0b0290170aa65aad86a469fc1980e1d8ac463ee715f1fa8.png
any idea on the timing according to this? thanks for posting all these charts
No, but that last bearflag (wave 4 of wave 5) that is currently in the making could pop soon to the downside. I count 5 moves on the “flag walls”. I expect it very soon along with gold break of trendline, but thats just my opinion.
Or 5 could truncate as well…
It could, but these things seldom go in goldbugs favour 🙂
Hmm…well i took a starter…my guts a flutterin… Im voting truncation in gdx..;-)
Need better buy point! Is one more flush just too much to ask? I mean, come on!
well on the 8 min i can count 5 up… if it’s real .. should get 3 corrective wave back for the 2…that’sthe best buy for me usually… but i figured i could add or be stopped out low rr for me…
Same here…also took a starter..my gut feeling also…GDX.
https://uploads.disquscdn.com/images/44d1e513d04ea334bac6ebc84628c269cf274392d30685db96825b6806b807d7.png Quite similar
https://uploads.disquscdn.com/images/bb2270557f7cc3122b839935947b95fe7806fcd7e87e5ac87a7184e0afd2d08a.png
About 40 bucks in a quick drop to go?
What could halter the last drop here would be shift from electronic coins to gold. Etherum dropped (96%?!) of its value I read in an article during a flash-crash!
More in detail how I want this to play out more exactly.
https://uploads.disquscdn.com/images/5c3d75f92798e332aff4961089a4a4771ce48a00eecbe3e598f17bcb96c79c76.png
https://uploads.disquscdn.com/images/13b029c9f011f6f7e569621c08bf1e1c2787ce47f5ecf787b4e81c9cdad91439.png
GDP has not been much of a market mover recently…
It hasn’t, but it is the only “big thing” on the program these days that can fit into my view.
PLEASE!! If only it would become simple again!
mr. market rarely gives us what we want … 😉
Can I still post here? Just checking, since I took Gary at SMT up on his offer to compare trading results, but offered a better way to gauge, that is to use past statements instead of tracking future trades. He deleted several comments and now I can’t log in, all because I answered his challenge. WEAK!!!
Yep, it’s not that my WordPress account isn’t working, looks like it’s just Gary doesn’t want to compare trading statements, as he tries to appear he does. He only says I tell people what I buy, maybe, if he takes the trades! In short, I now know Gary at SMT is a liar, and others should know as well.
Funny thing is that I wasn’t even gonna do it, because I don’t care what strangers think of my trading results and have nothing to prove. I finally couldn’t take his repeated calling out of people saying they had no balls if they didn’t want to go head to head. He is frustrated because he is losing, happens to everybody, but it is still a weak way to handle it. SHOW STATEMENTS, GARY, and I WILL DO THE SAME. WE CAN GO BACK AS FAR AS YOU LIKE, and in this way we can quickly determine who the better trader is, since YOU issued the challenge to all readers on your public blog.
Coffee tend to move in a triangular pattern over time:
https://uploads.disquscdn.com/images/2c71aeec43b449f1f3ce5710d835d501e0f9a70e8a42723a13c52b07092ad3f8.png
We might have bottomed yesterday with hit on trendline. Long entries would be a good July investment if decent entry is offered.