Weekend Update Dec 15
SPX NOVEMBER 16 – With our daily cycle move out of the lows in October, this chart pointed out that if the lows of October were broken, the ICL could be lower in an A-B-C move.
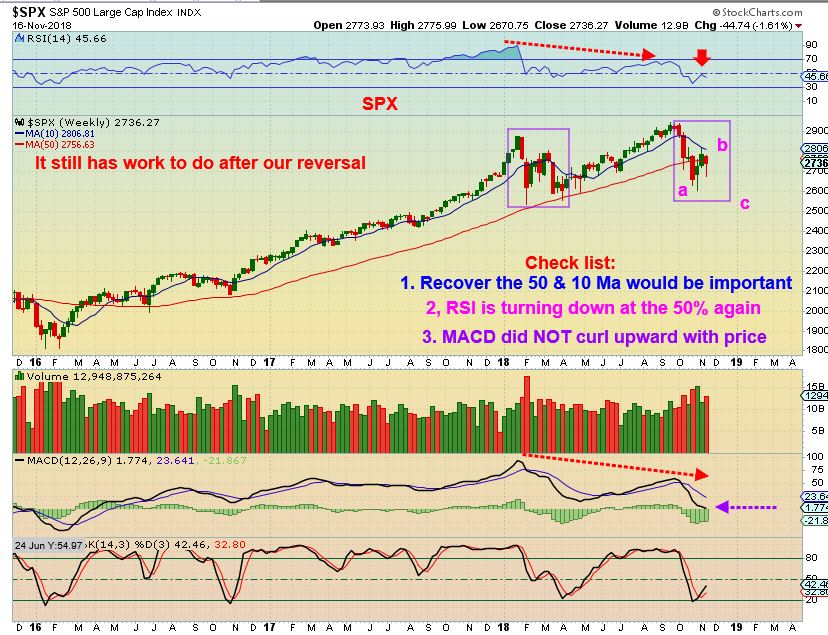
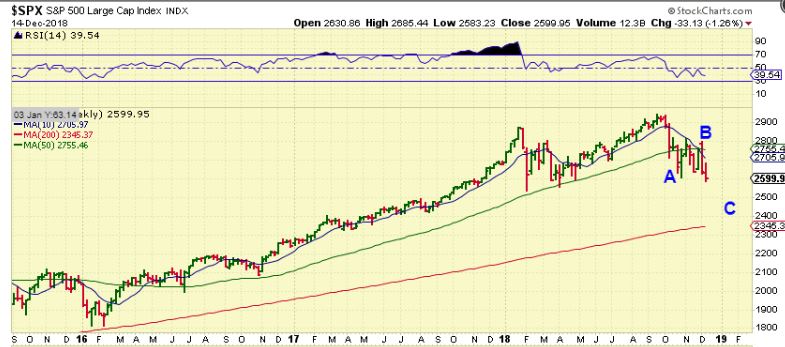
SPX WEEKLY CURRENTLY – That A-B-C type drop looks to be playing out.
This chart showed that the Russell 2000 broke those lows, so it would seem likely that others would follow. 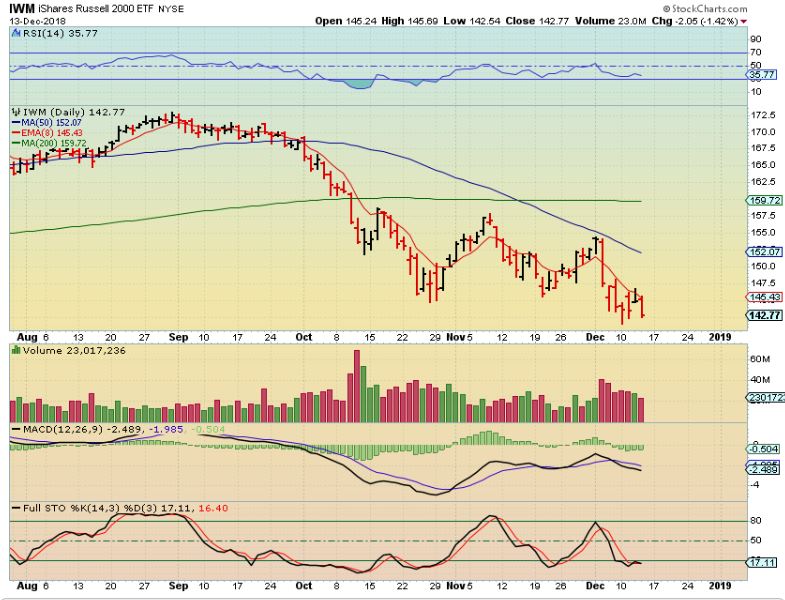
The TRAN has broken down too
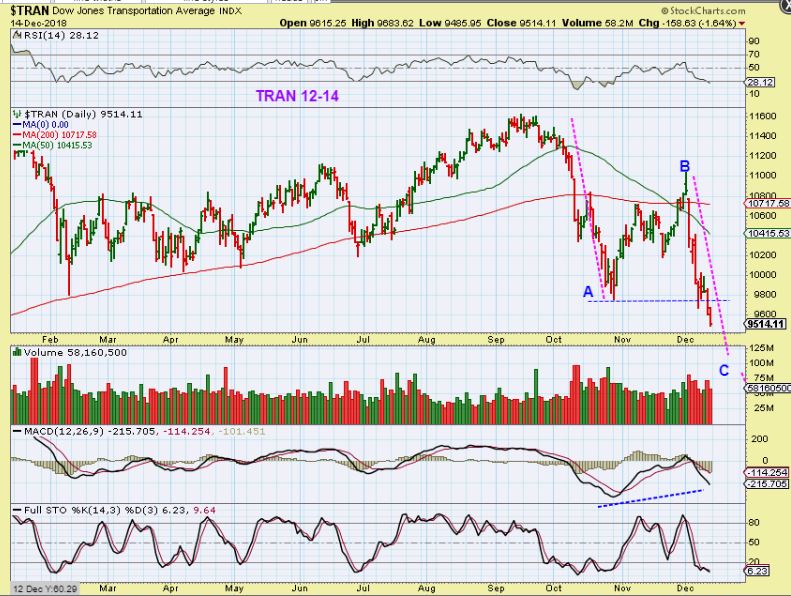
So This could drop right to the 200ma, but that would be a pretty big crash. I am not really expecting that, and here is why…
NOW SOME PEOPLE THINK THAT THIS BREAK DOWN IS WHERE TO GO SHORT. I WANT TO POINT SOMETHING OUT TO YOU…
.
DJIA The Big 2008 Sell Off – Near the top, when the market first broken to new lows, it was late in a daily cycle, so the DCL came quickly, and a solid bounce then took place. So what I am pointing out is …
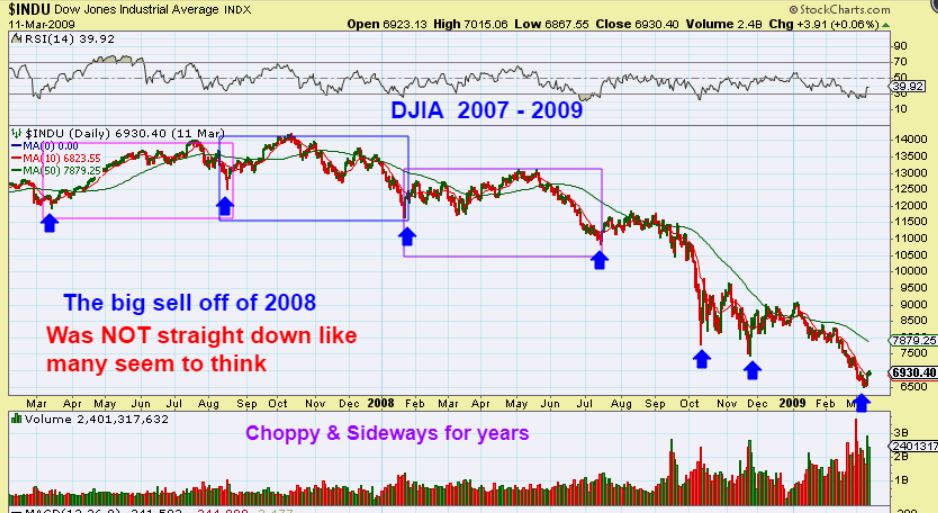
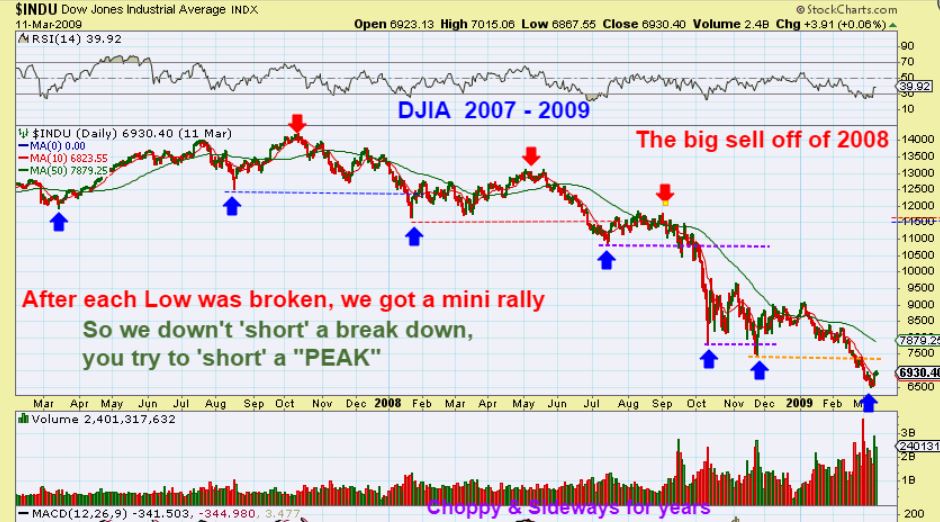
With the Jan 2008 break down to new lower lows, the markets almost immediately popped ( DCL) and did not sell off for the ‘shorts’. Then the break down in July 2008 to lower lows also bounced & went sideways for weeks too The RED ARROW is the daily cycle high, and when a downtrend develops, that is the best time to short a market, but it still wasn’t easy. These bounces lasted for weeks and it can be hard to find the actual ‘peak’ too, but shorting a few weeks after the DCL MIGHT BE better than shorting a break down…
TAKE A LOOK AT THIS –
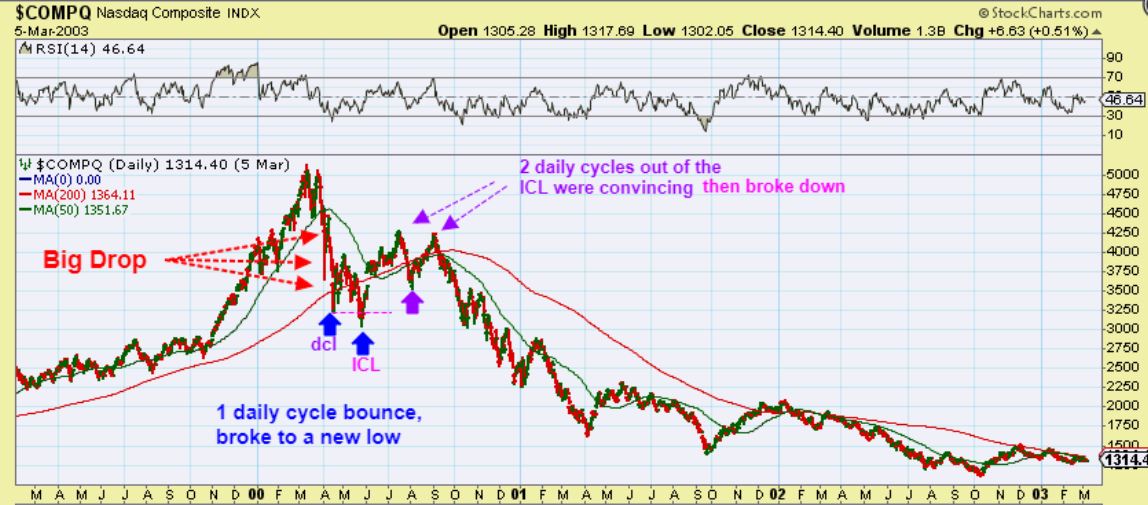
NASDAQ BLOW OFF TOP OF 2000 –
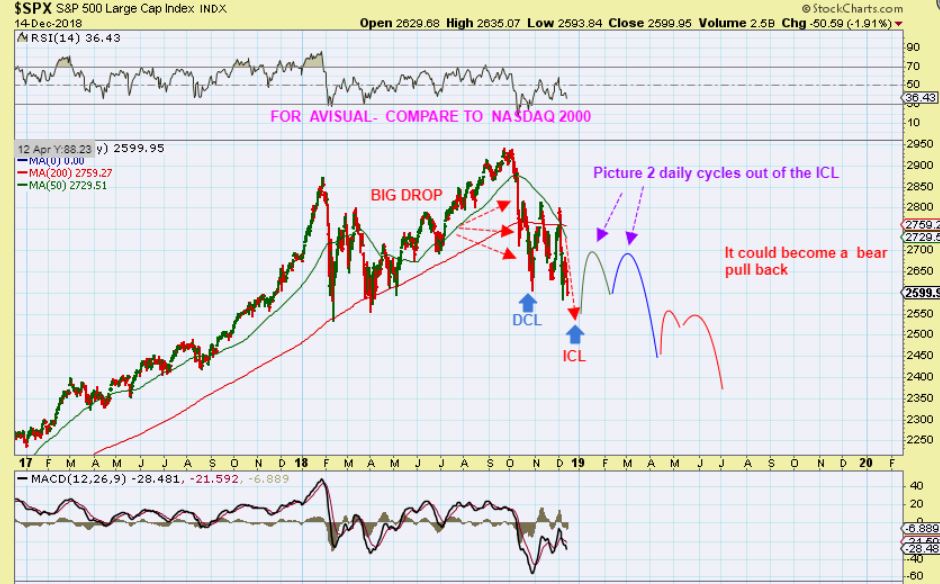
I have been saying that I expect an ICL & 2 daily cycles before a drop. The 2 daily cycles can look fairly convincing, but do not make new highs, and the 2nd daily cycle rolls over.
Now look at THE NASDAQ 2000 Blow Off Top, and compare it to our current set up on the next chart. We had a
1. Big Sharp Steep Drop with a double bottom low
2. Look at the 2 daily cycles ‘peaks’ after the ICL.
So here I drew in what I think we could see
1. Our Big Steep sharp Drop is in place, with double bottom lows
2. Then the 2 daily cycles after the ICL? We’ll see.
NOTE: THIS IS AN IDEA OF HOW I HAVE SEEN TOPS PLAY OUT. THIS COULD PLAY OUT THIS WAY, BUT IT IS NOT A GUARANTEE. THE FED IS SOFTENING THEIR STANCE, AND THAT MAY PROP UP THE MARKETS AFTER THIS CORRECTION, SO IT IS IMPORTANT TO STAY CURRENT AS THINGS DO PLAY OUT, BECAUSE WE HAVE TO ANALYZE THINGS AND WATCH FOR CLUES AS THIS PLAYS OUT. I COVER THESE MARKETS ALL THE TIME, DAILY & WEEKLY, SO PLEASE STAY CURRENT, SINCE THINGS CAN CHANGE OVER TIME. 🙂
.
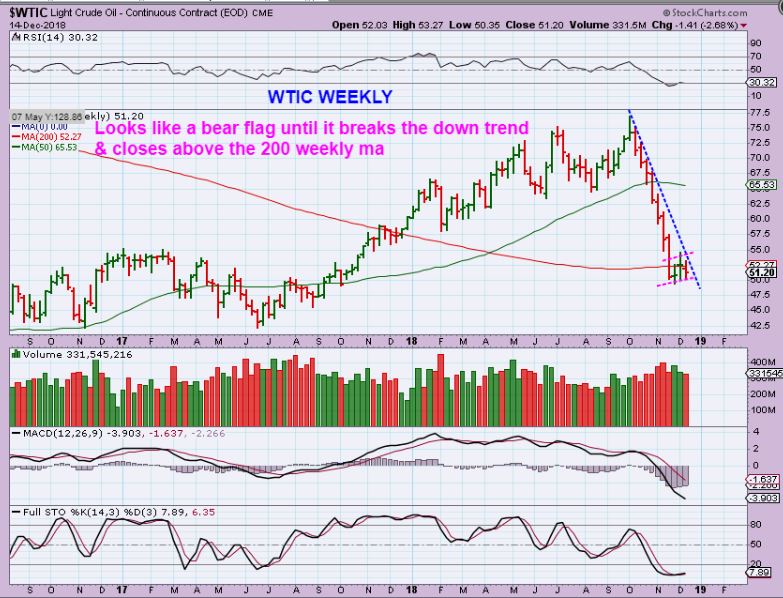
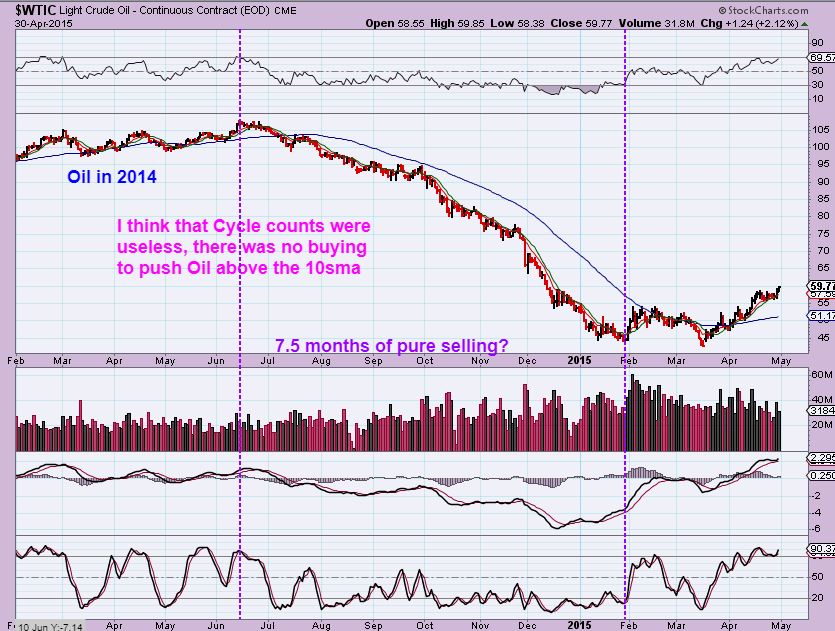
WTIC – I DO NOT LIKE THIS LOW IN OIL YET, and without upside, it looks like a possible bear flag. Oil has remained trapped under the 200 weekly ma. It is possible that this becomes a weak Weekly bear flag, and what adds to that feeling is…
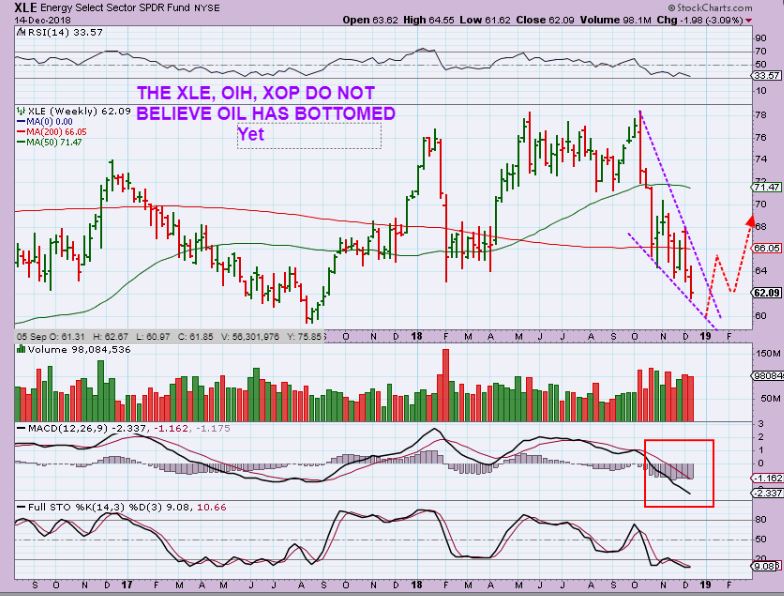
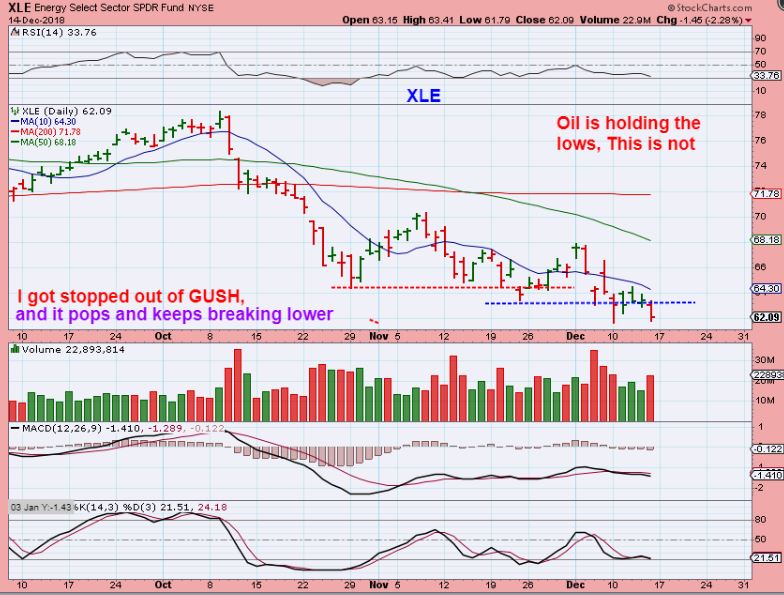
XLE WEEKLY – THE XLE broke down and closed near new lows, not believing the OIL bottom.
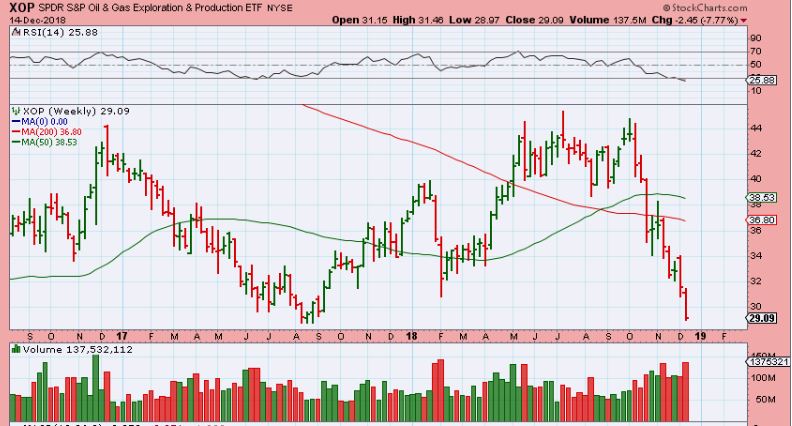
XOP WEEKLY – XOP has been selling off too.
Now this is OIL again. I WANTED TO DIG DEEPER, because I dont like this bear flag trapped under the 200ma. So now notice that OILS SELL OFF Started in OCTOBER. So that is 2 months of steep selling.
The 2014 Oil Sell off started at the end of June and lasted for 7.5 months? ! I do Not see much of a bounce from September to February lows either. This is just a warning that Oil sold off for over 7 months in 2104, and now 2 months into Oils recent selling, it is not out of the question that Oils lows may break down. I’m not saying 7 months of selling, but what I am saying is that we have seen 7 months, so 2 months may not be all we get here. The XLE , OIH, and XOP are not bottoming with Oil. I got stopped out of GUSH and never re-entered. I’ve been looking for a low
XLE DAILY – I was stopped out and did not re-enter. OIL is holding its lows, but XLE is not.
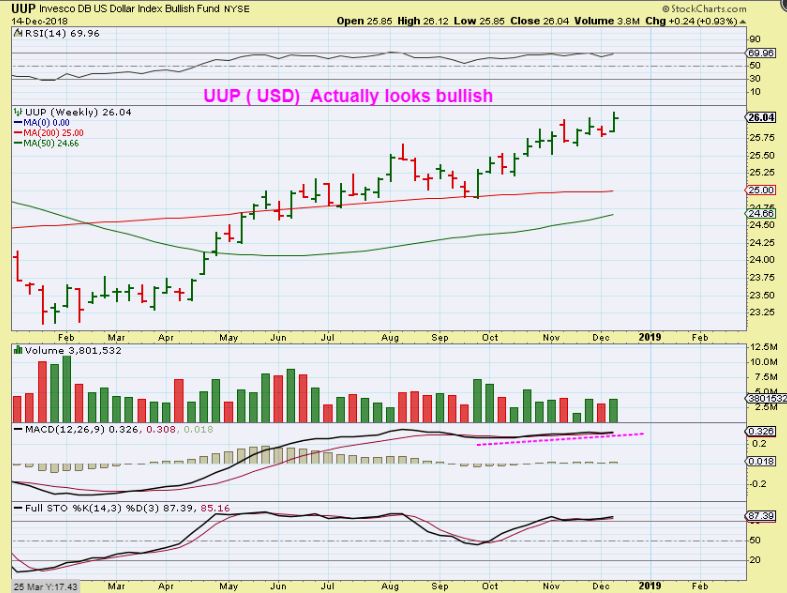
UUP WEEKLY – The weekly chart of the USD ( UUP) looks pretty good actually. This has been bullish, but it is not hurting Gold, since GOLD and the Miners have been moving higher lately too. Let’s look at the Daily chart.
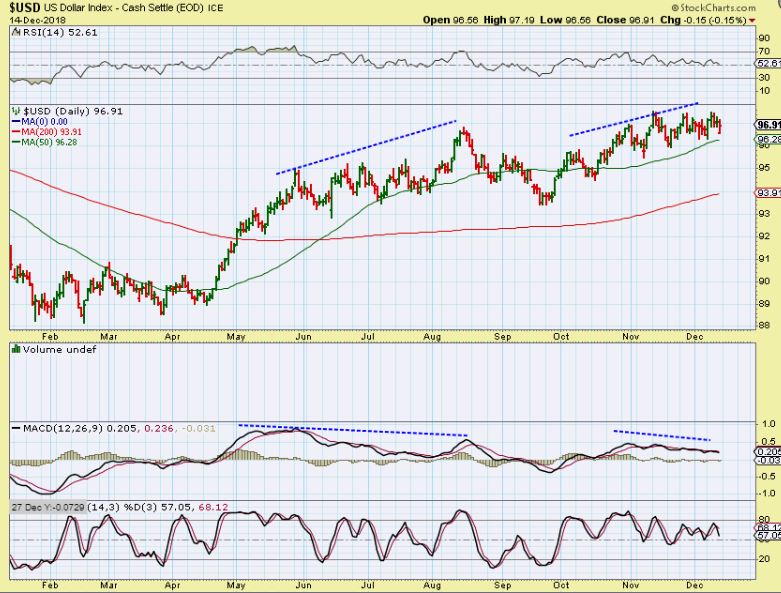
USD DAILY– The momentum does look to be weakening over time, and the daily cycle is coming due for a dip into a DCL, so we will probably see a dcl, another push higher, and then it could roll over from there. That would line up with timing for GOLD to bottom after a pull back, but again, the USD and GOLD do not seem to be as tied together as they have in the past.
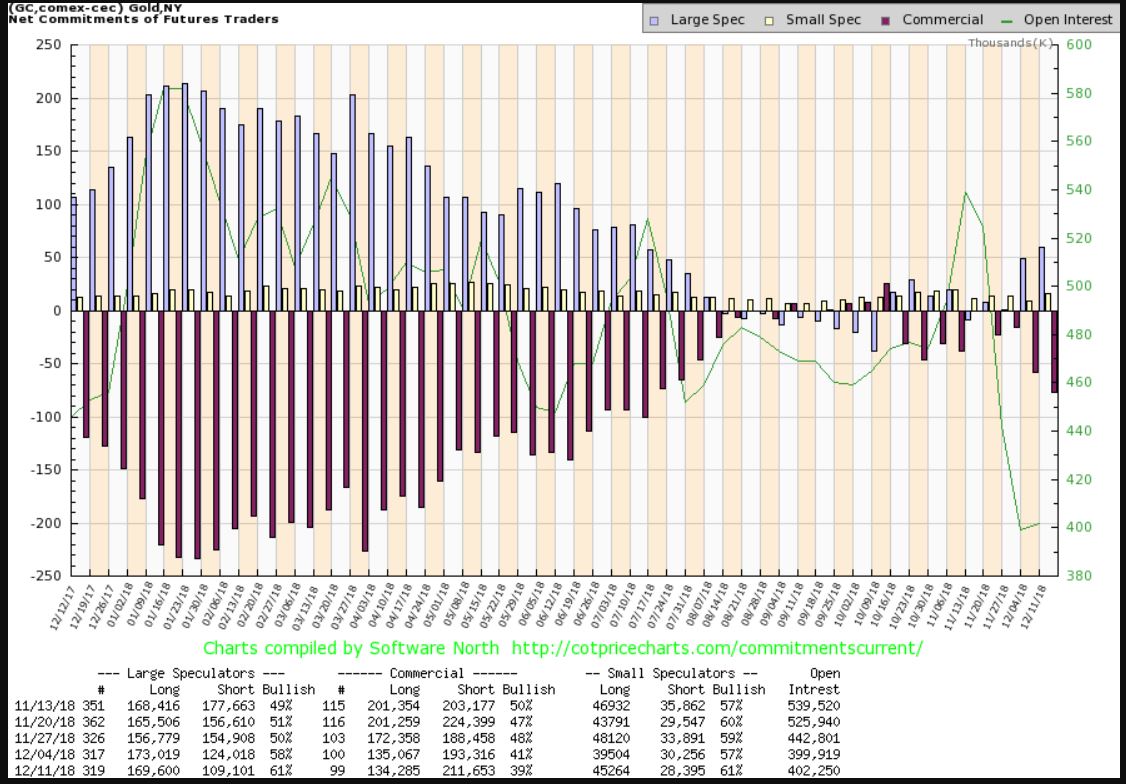
GOLD COT – We see that the Smart Money has been building their “short’ positions recently, while the specs have gone long. It is not extreme, but it is noticeable.
GOLD WEEKLY #1 – And this week Gold dropped.
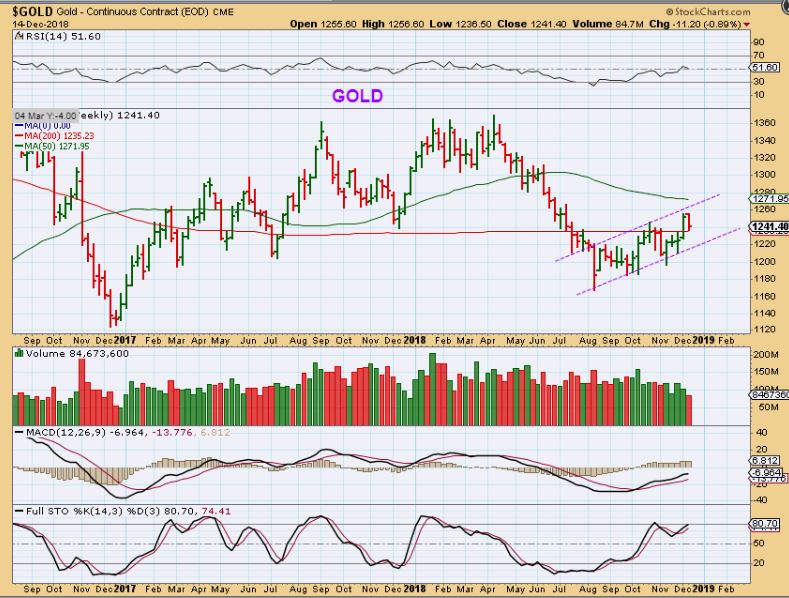
From the Thursday Chart, I pointed out that this could be the peak of the 3rd daily cycle. We are in a resistance area too.

SILVER WEEKLY – Silver has simply formed a base. We could drop and then rally or …
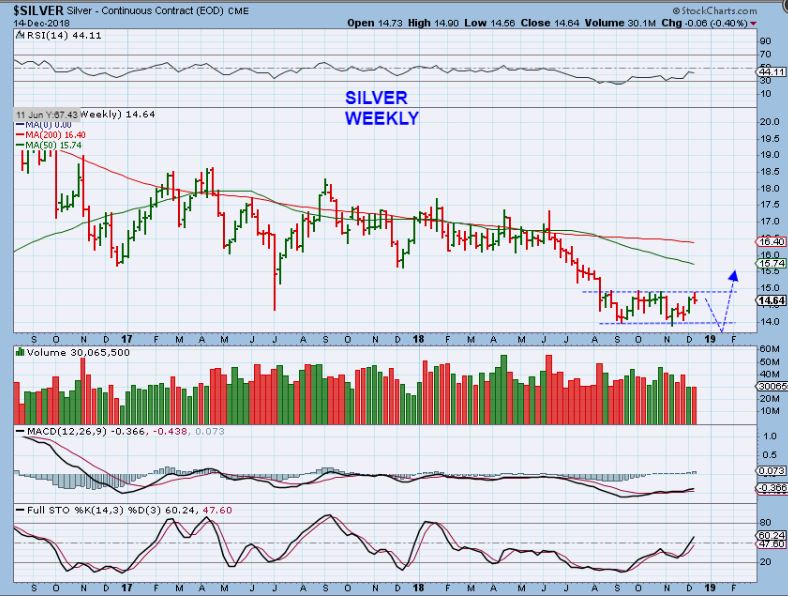
SILVER – Go sideways (xyz) at the highs and then drop. Silver has basically been sideways.

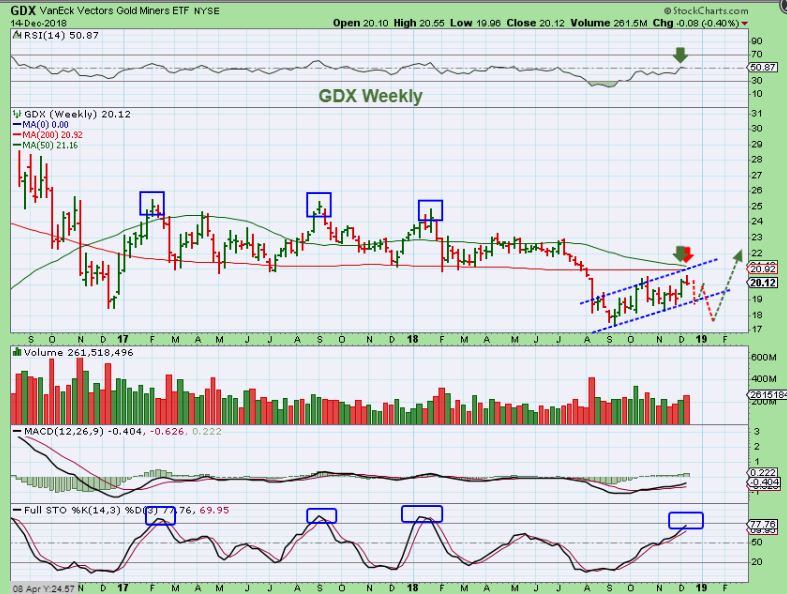
GDX WEEKLY #1 – Miners may be topping here too, but reversed just shy of the moving average resistance. They COULD run a bit higher and tag that area, but basically speaking, this is a weekly reversal just under the resistance.
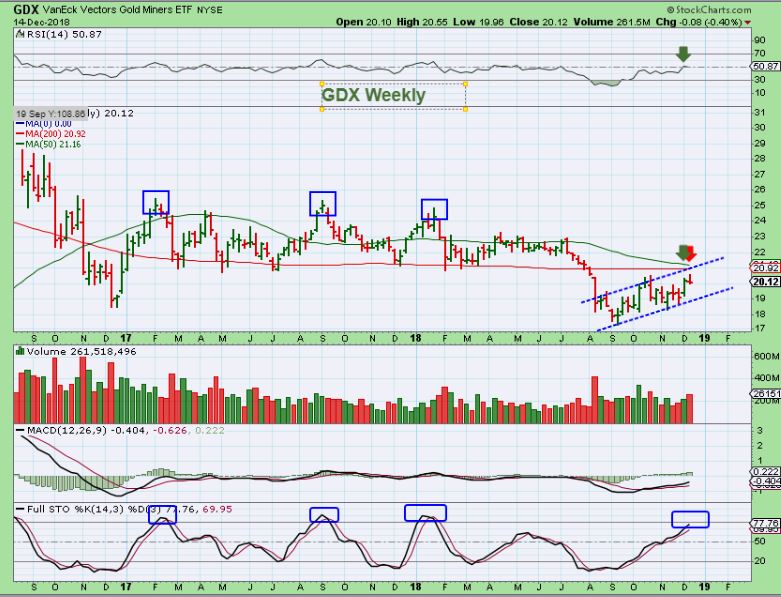
GDX WEEKLY #2– We could drop to an ICL as shown here, or we could even put in 1 more daily cycle and reach that resistance, since it seems to have pulled up short. We’ll have to see how this plays out. We have reached weekly overbought.
.
Enjoy the rest of your weekend, and I will have a couple of trade updates below.
Thanks for being here at Chartfreak!
.
~ALEX
.
Just a quick review or Update, for a couple of trades that were in play.
.
I have pointed out that lately, even thought we saw a pull back, some of The MJ Stocks have been holding up and acting rather bullishly.
.
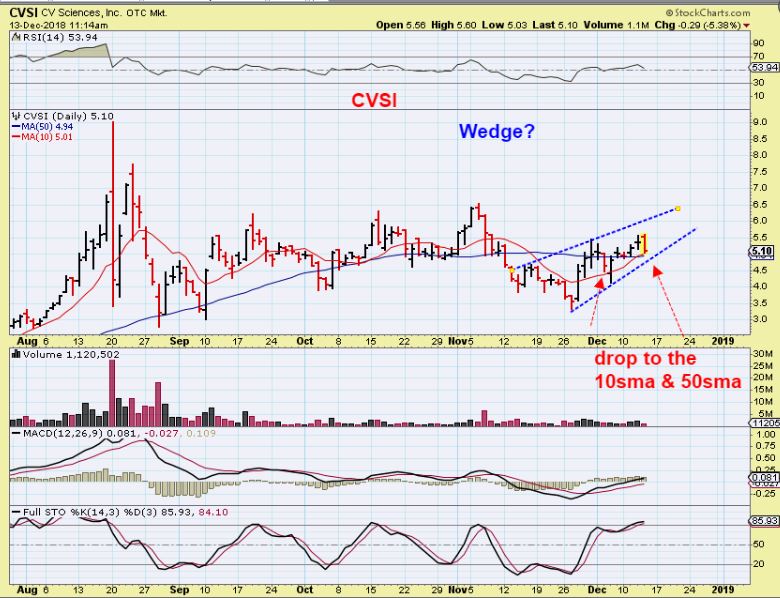
CVSI – CVSI had a wedge form and I drew that in. This would call for a break of the lower wedge trend line. So far it held up at support though.
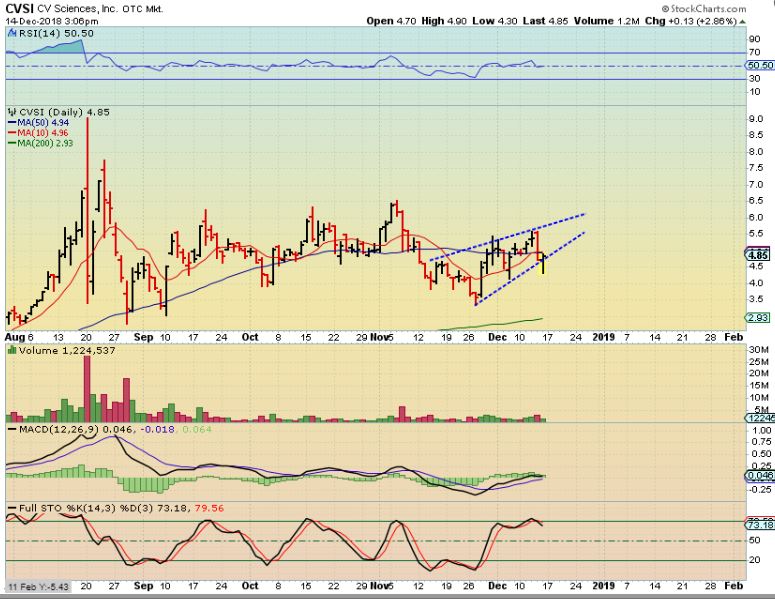
CVSI – Friday CVSI actually dropped and reversed into the close Friday. Was that enough? …
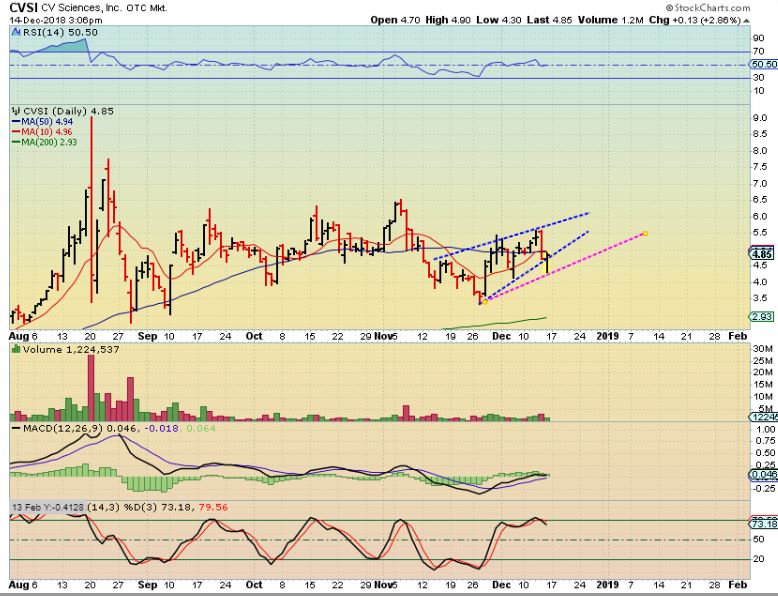
CVSI – That may be all it needed to do to get a parallel upward channel in place. We can now watch and see if this has follow through higher Monday, to recover that 50sma.
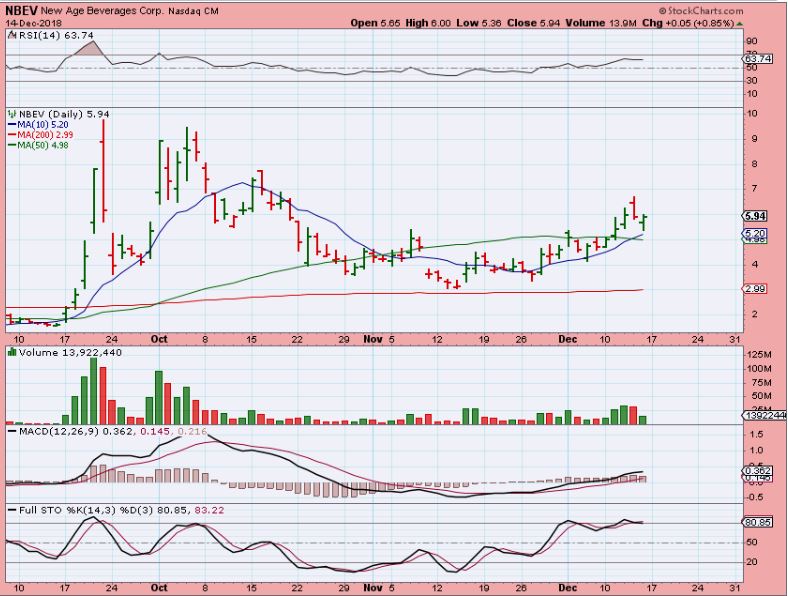
NBEV – I have also discussed the fast bullish action in CBD infused beverage producers NBEV & WTER .
.
NBEV reversed Wednesday and dropped on Thursday. I drew this Magenta cup to show support if this round cup like formation is to continue. I thought maybe a drop to $5 would be a good place to look for a reversal, at the 50sma. Look for a reversal there…
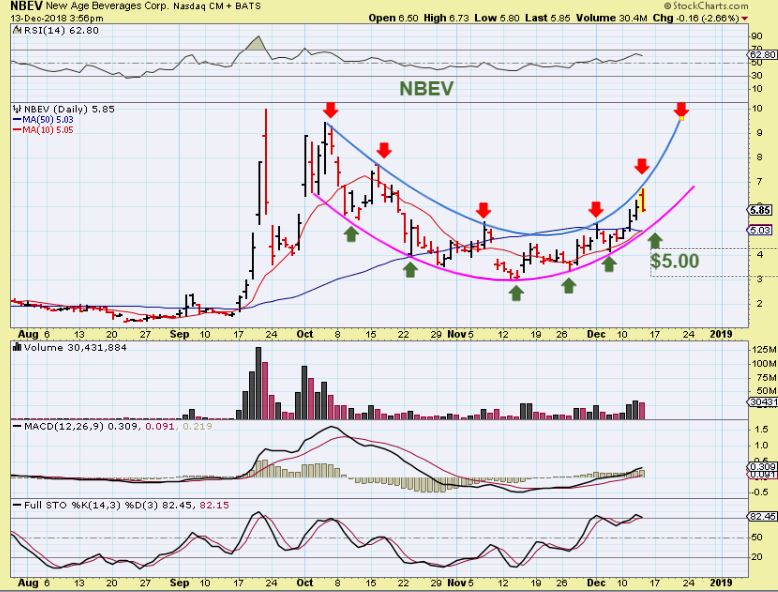
NBEV – This actually reversed early at $5.36. Is this the low? It may be, if Buyers keep rushing in to own it. Using the 10sma, that reversal looks proper and a lot like the Dec 3 reversal. I own this one, and have said that I Missed WTER, and would like to get in…
LET’s walk through the WTER trade ( I missed the first entry).
.
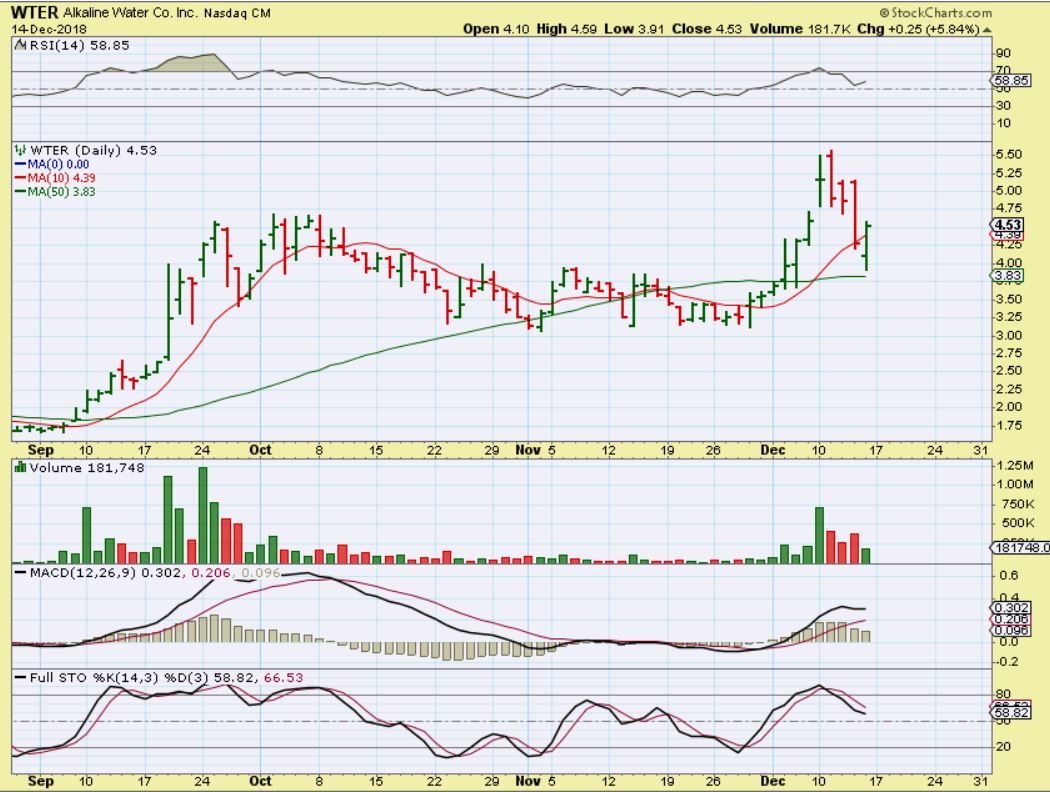
WTER #1 – Pushing on the 50sma, this was bullish. I bought NBEV above $4 instead and then WTER took off!!
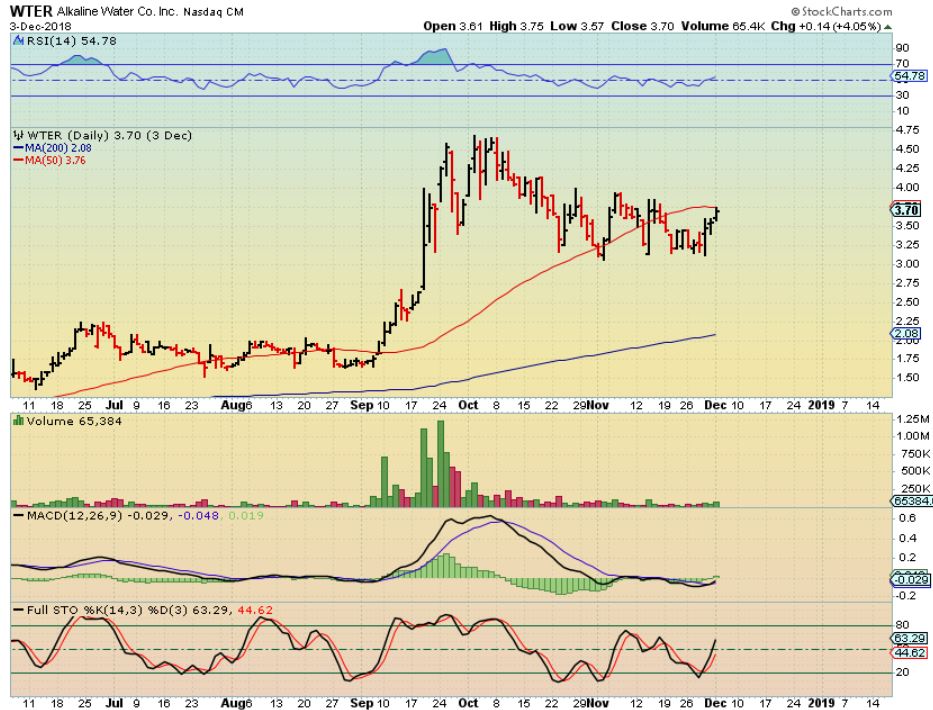
WTER #2 – As it raced off, it formed a DOJI ( possible reversal) so I wanted to buy the ‘back test’ of the 50sma that could be coming, ( but it might only do a ‘gap fill’ & bull flag) ….
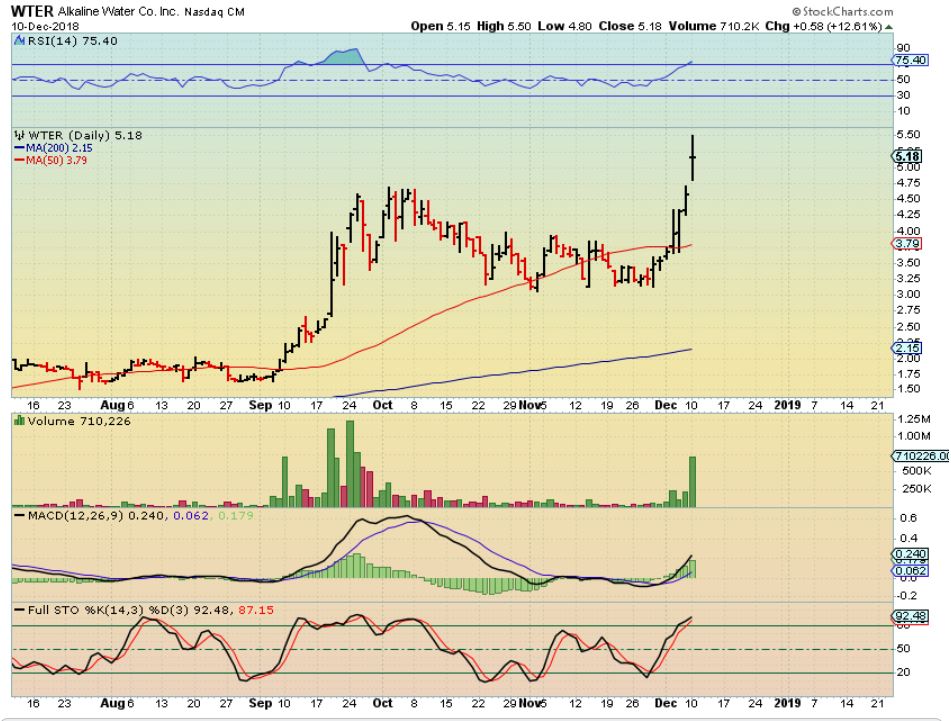
WTER #3 – Well, it dropped VERY FAST. IN ANSWER TO AN EMAIL 1 HOUR BEFORE THE DAY ENDED, I saw a small reversal above the 50 sma, but I actually expected that this could drop further or chop around & consolidate, so I drew this for one of my readers Midday Friday. I too was looking to enter, but said that I was waiting…
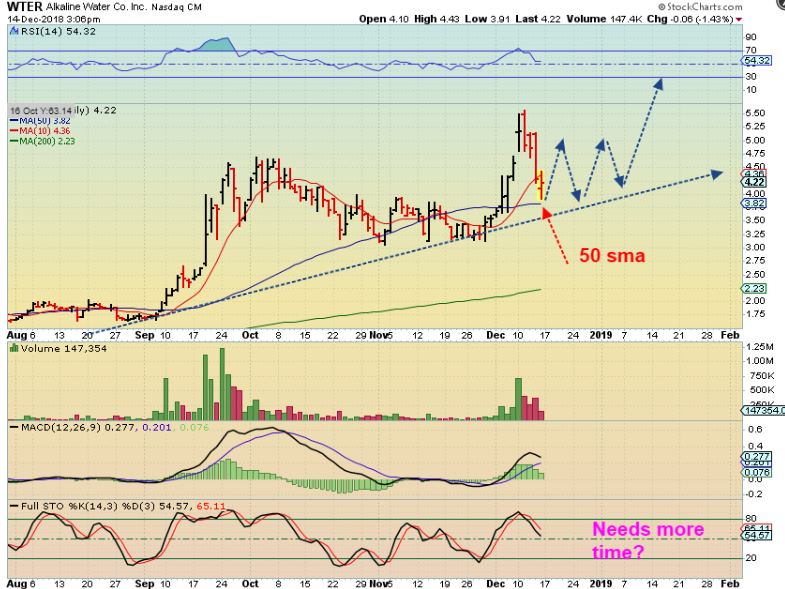
WTER #4 – WHAT? I may have missed that perfect entry again. That little midday reversal in the above chart turned into a 6% gain as buyers rushed in. This is still a buy as a reversal near the 50sma, but you do see how quickly and how much this moves right?
SO ACTUALLY (same chart) This is still a buy as a reversal near the 50sma, but you do see how quickly and how much this moves right? $5.50 to $3.80 in his week. This could still chop around and be a tough buy & hold, but it also could just take off from here and run quickly higher. ( Start small if you enter?).
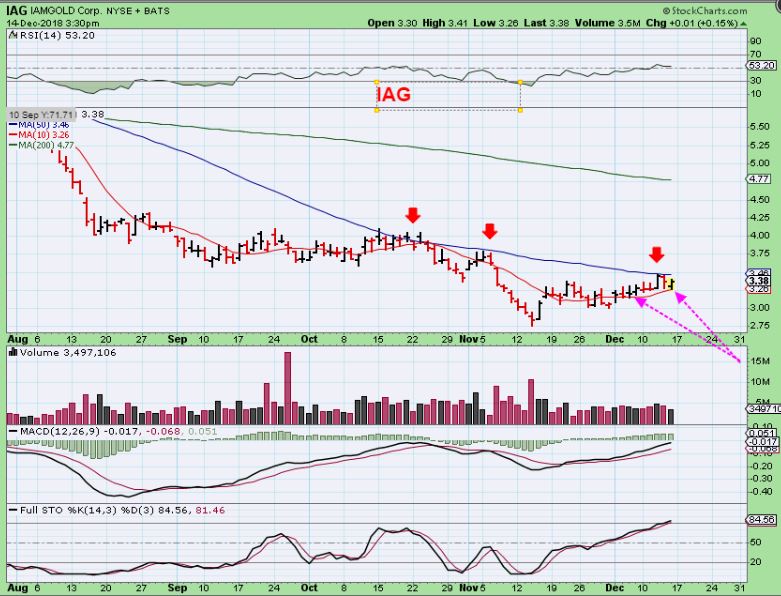
IAG – I am still watching IAG & EXK for clues about Silver too. So far they were held back at resistance, but they also reversed at the 10sma Friday, so this sector keeps finding buyers on the drop too.
.
FINALLY – A TRADE I DECIDED TO TAKE FRIDAY & POSTED IN THE COMMENTS SECTION
,
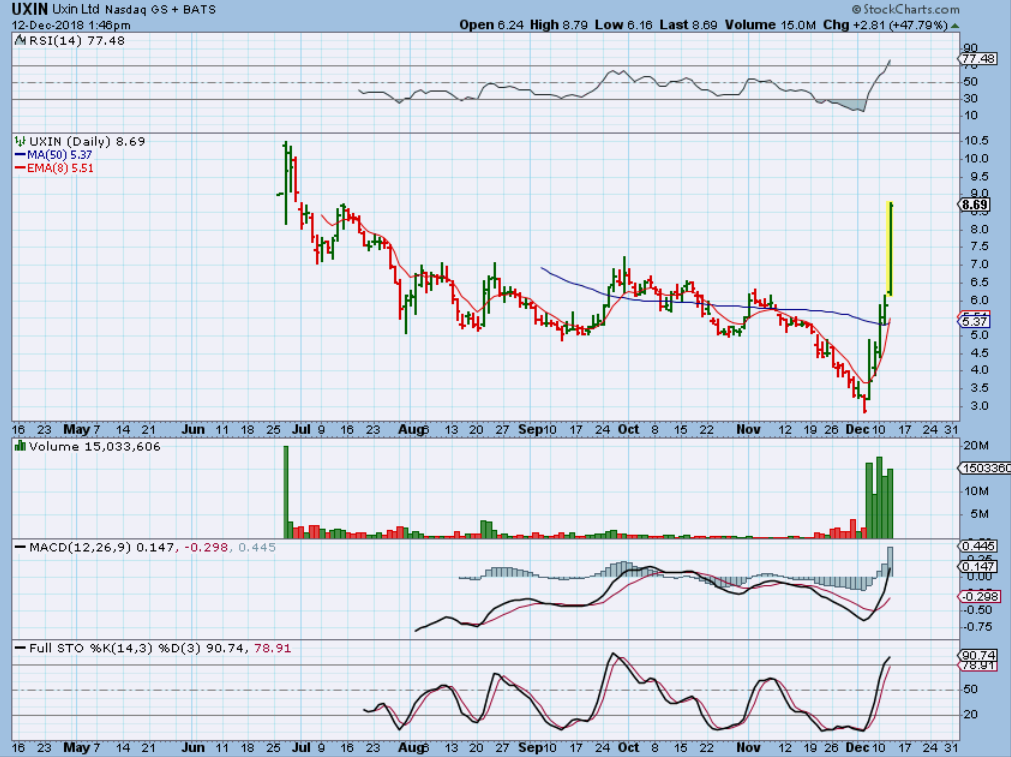
DO YOU REMEMBER UXIN? High volume breaking the 50sma…
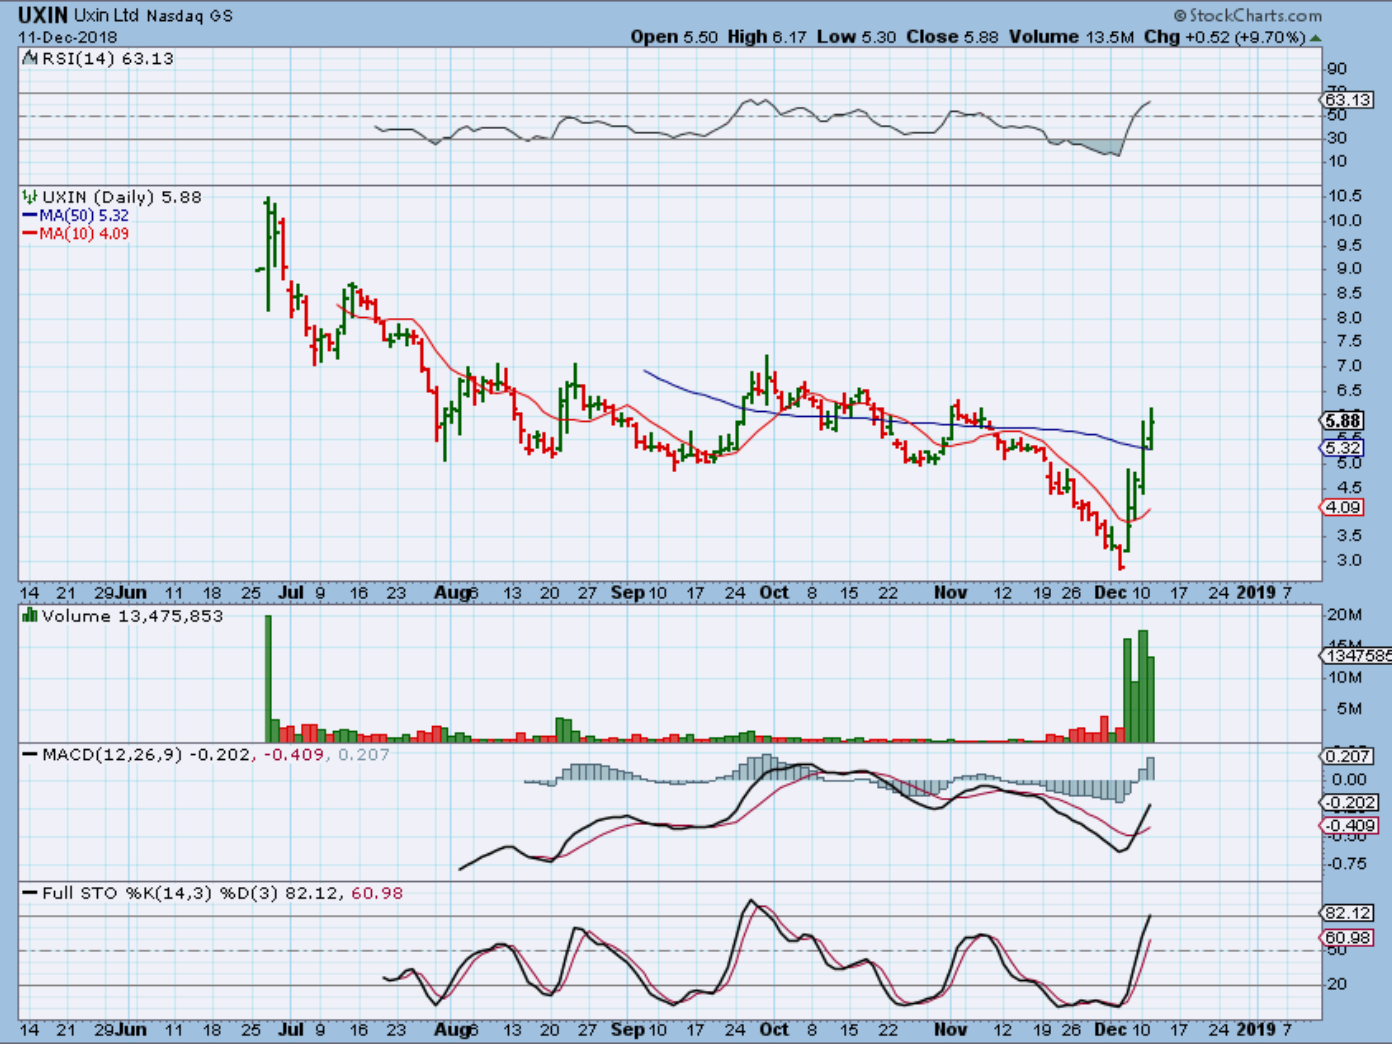
UXIN – Took off like a rocket
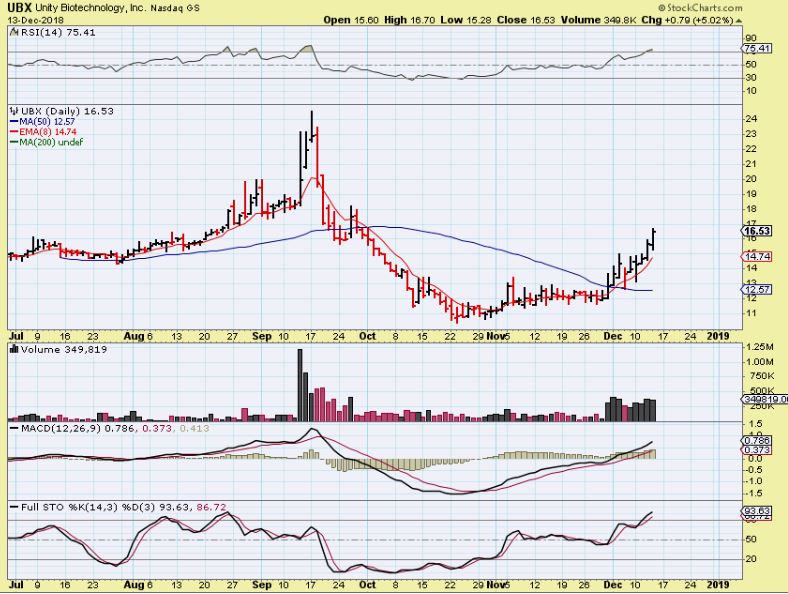
AND UBX – I bought this at the 50sma , because it also had Good volume at the 50sma, and …
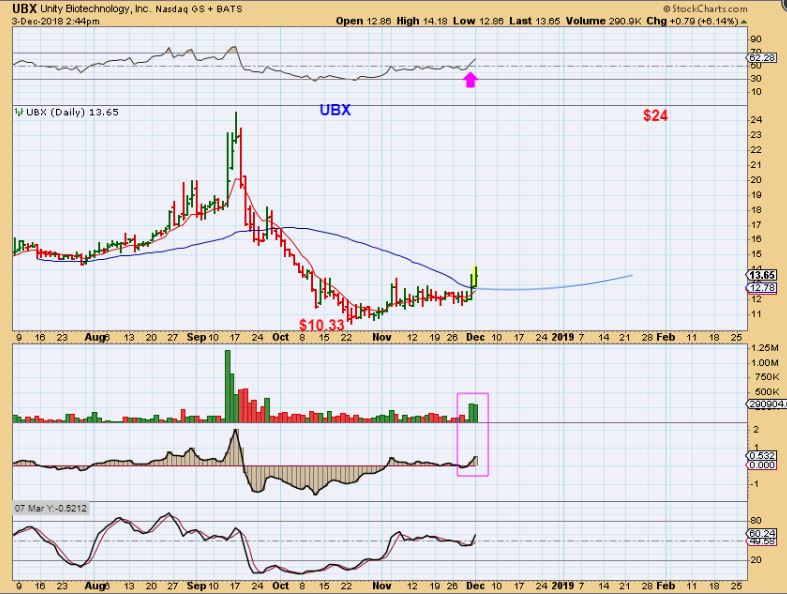
UBX – The follow through has been good. Well…
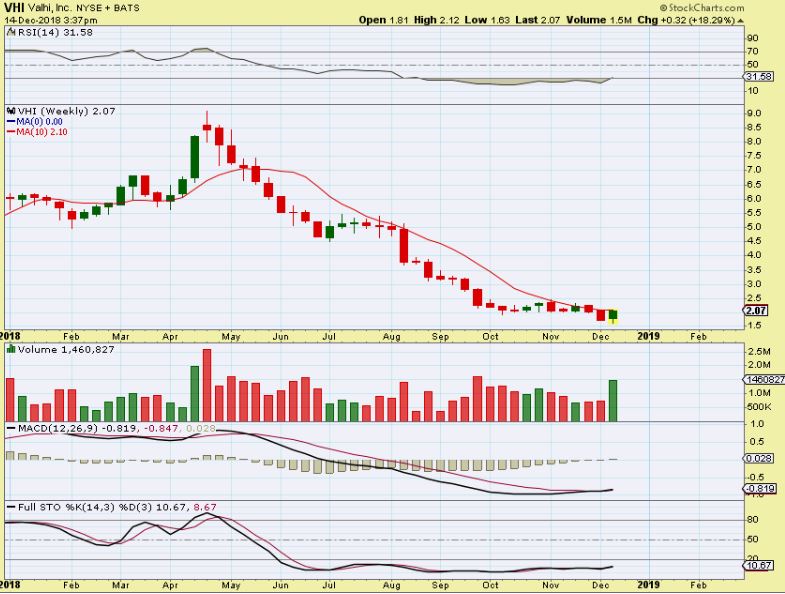
On FRIDAY I saw VHI at the 50sma with volume increasing, so I took a starter position and will add if it breaks above that 50sma, just like UXIN & UBX. And …
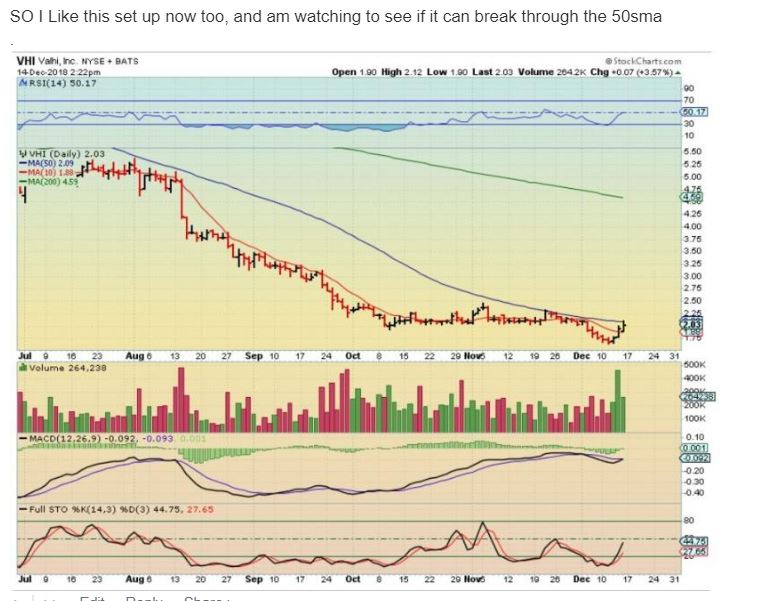
VHI WEEKLY – This is the weekly chart . It dropped from $9 to about $1.50 & now has a high volume weekly reversal in place.
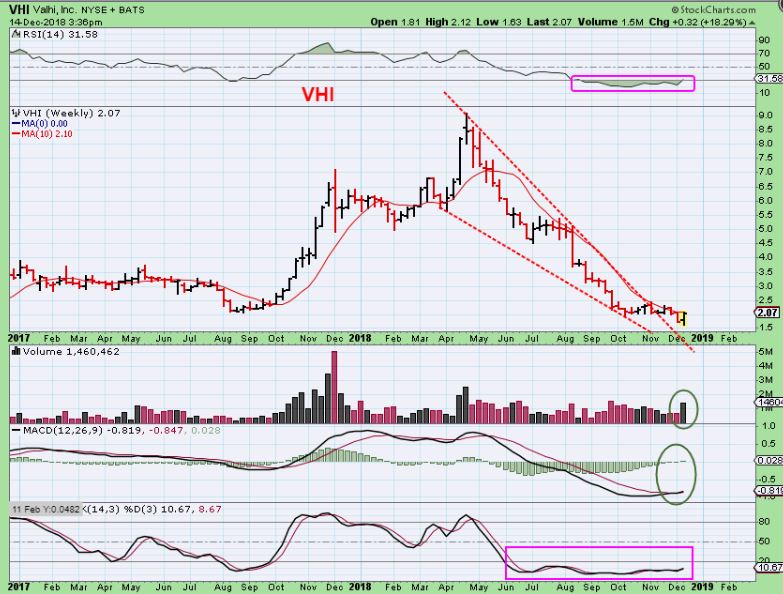
VHI WEEKLY – A push above the 10 ma on a weekly chart is a buy signal in technical analysis, and that will be the 50sma on a daily chart too. That weekly MACD is looking good too. This is very oversold on a weekly basis, a small bounce to $4 could be a 100% move from here. I’m starting small and will add on a break out.