You are here: Home1 / Exclusive Strategies
This was my IBB Weekly chart on June 20th. It is breaking out in bullish manner ( It hit 316 yesterday) and has the potential to get to 330 in a few weeks. The daily chart could back test the break out or it may just bull flag and continue higher.
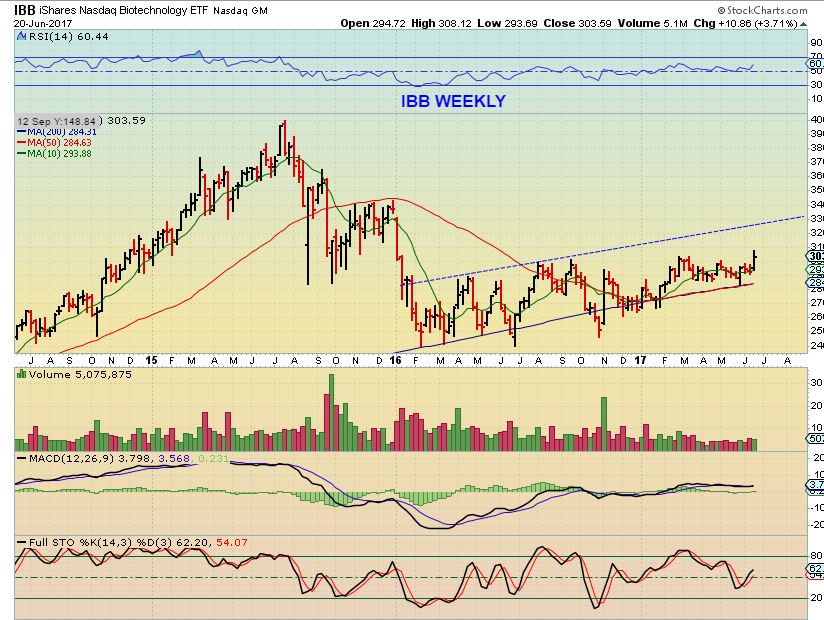
I will discuss this further later in the report.
Read More
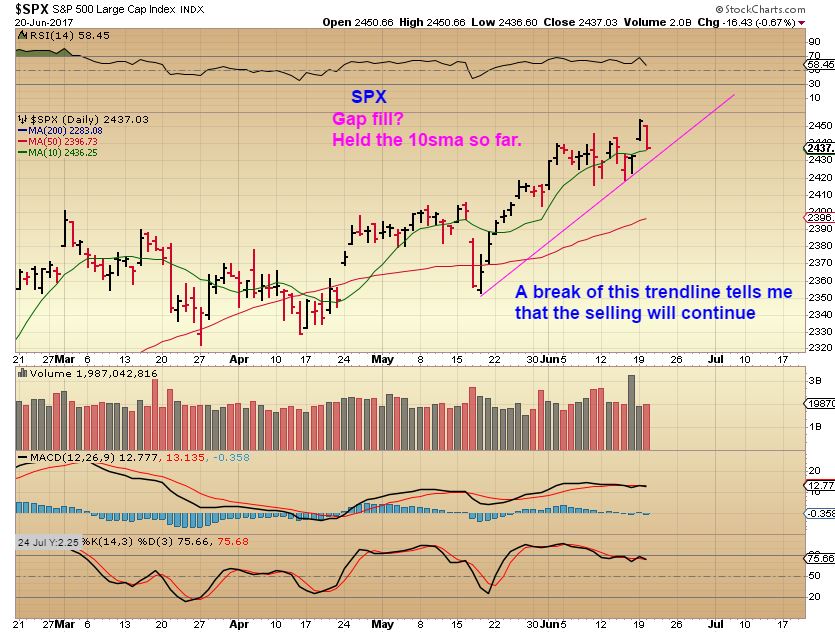
So far, The SPX has put in a swing high every 4 days or so, 🙂 and here we see another one. Since we are getting late in the intermediate cycle, and since we are on day 22 of the daily cycle, I am watching each swing high as a possible top. A break of the lower trendline could escalate the selling, so my stop would be below that.
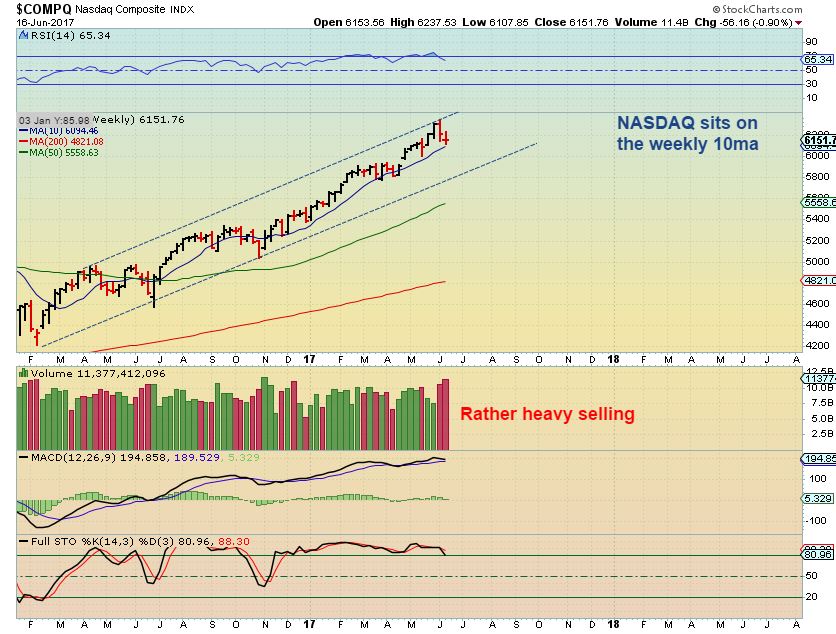
The NASDAQ...
Read More On the weekend, I used this chart to point out that the NASDAQ did find support on the 10 weekly MA. This is often an area that holds as support, so would the markets move higher from here?
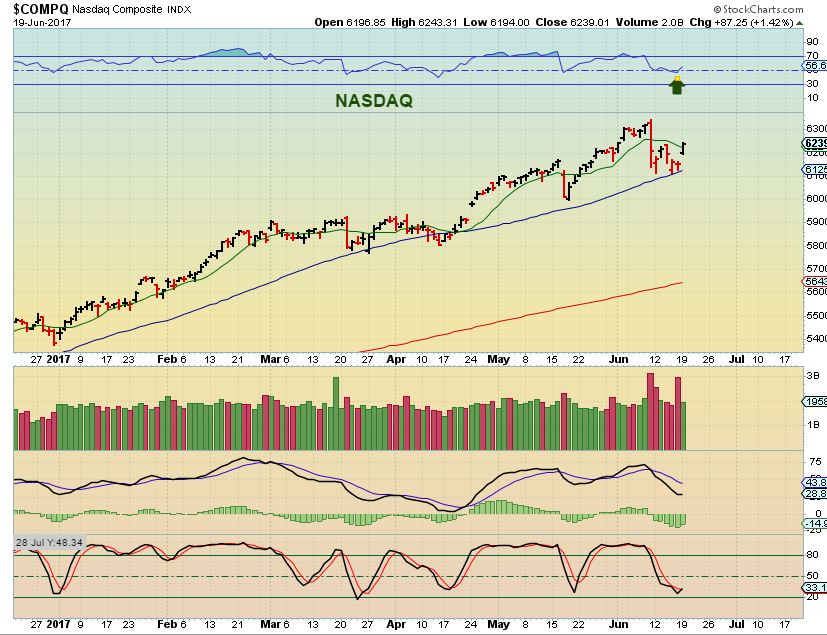
The markets did move higher, and I would use recent lows as a stop.
 Read More
Scroll to top