You are here: Home1 / Exclusive Strategies
In the weekend reports, I like to visit the BIG PICTURE look of various sectors and see if things remain on track with our expectations. Since my day to day reports cover the daily market action and fluctuation, let's take a look at the Big Picture, shall we?
.
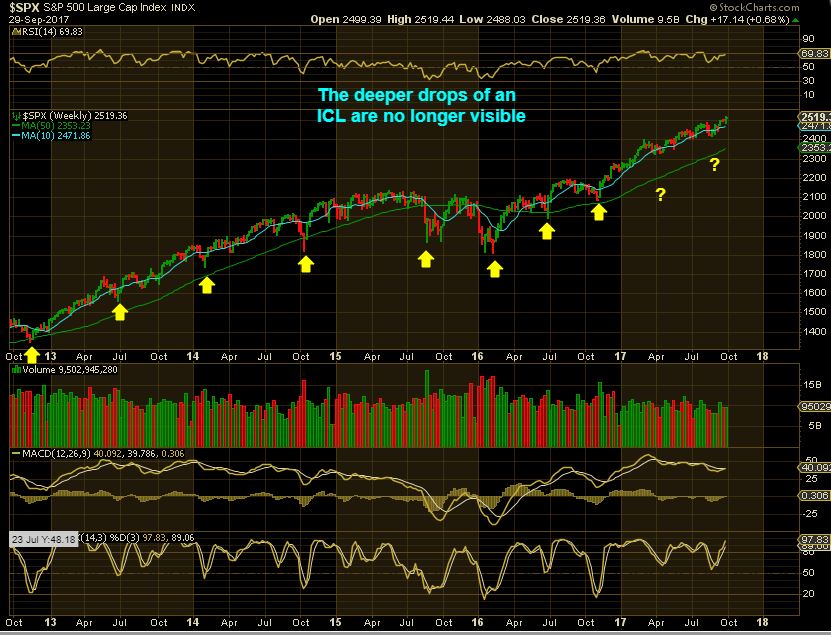
SPX - I mentioned in many past reports going back to last spring that if the markets begin to enter a more parabolic move, we will not be able to see the ICLS, based on past parabolic moves.
The highly visible ICLs come from deeper sell offs, but with the recent bullishness and 'buy the dips' that we've seen in the markets, we no longer see the ICLS clearly. The small dip / consolidations that you see above my question marks ( when considered timing -wise ) would represent where the ICLs should be. A Steeper ramp up and less sell offs is a bull run. The big picture simply remains very bullish, until we see a change in character.
 Read More
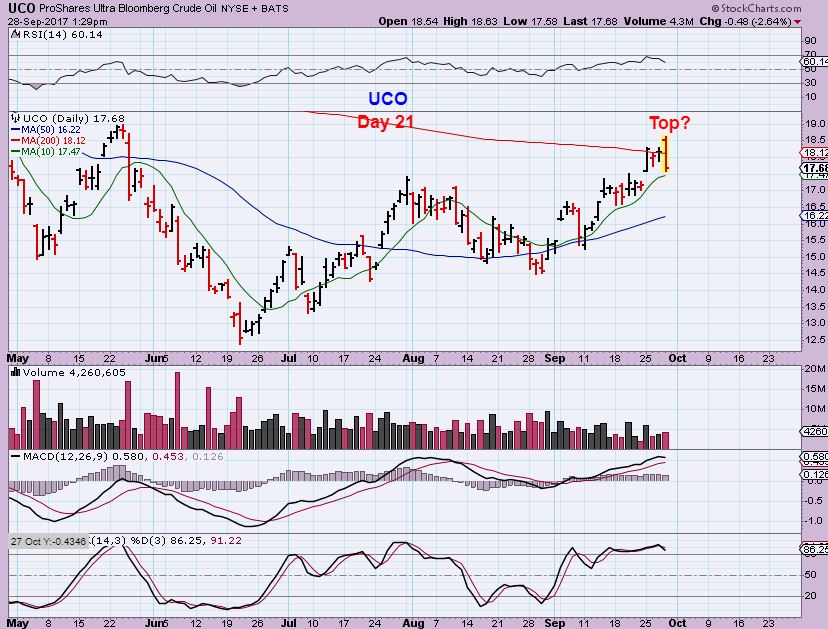
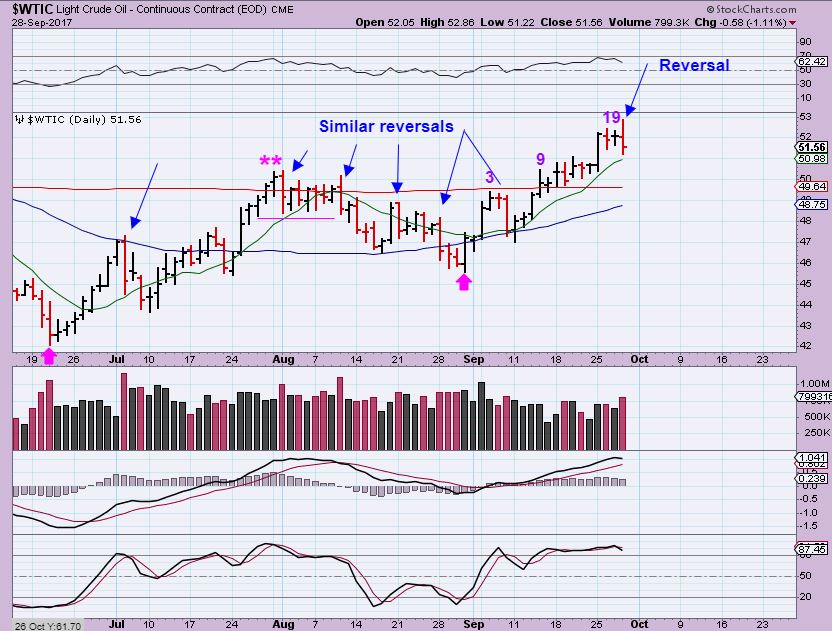
I have been bullish on Oil and Recently the XLE or OIL & ENERGY stocks. Well, nothing goes up forever, but a pullback can also be a buying opportunity. I saw a fairly strong looking reversal in UCO & USO midday yesterday and wrote in the comments that this could be a temporary topping candle. That doesn't mean I am suddenly bearish on energy stocks now, so let me just discuss UCO & WTIC first, and then I want to also discuss the Miners.
UCO - Due to the gap open and then the selling, we have what is seen as a bearish engulfing. Look where it happened. Usually price dances or crawls around the 200sma as a resistance point, so I expect some sideways movement or a pullback at this resistance area.

WTIC- Look at Oil however. It already rode along the 200sma, and we have seen many reversal candles in Oil along this run, so we may just get a small pullback and even back test the 200sma. We are seeing a 'peak' on day 19 so far, but this CAN peak even higher. The set up remains bullish.
 Read More
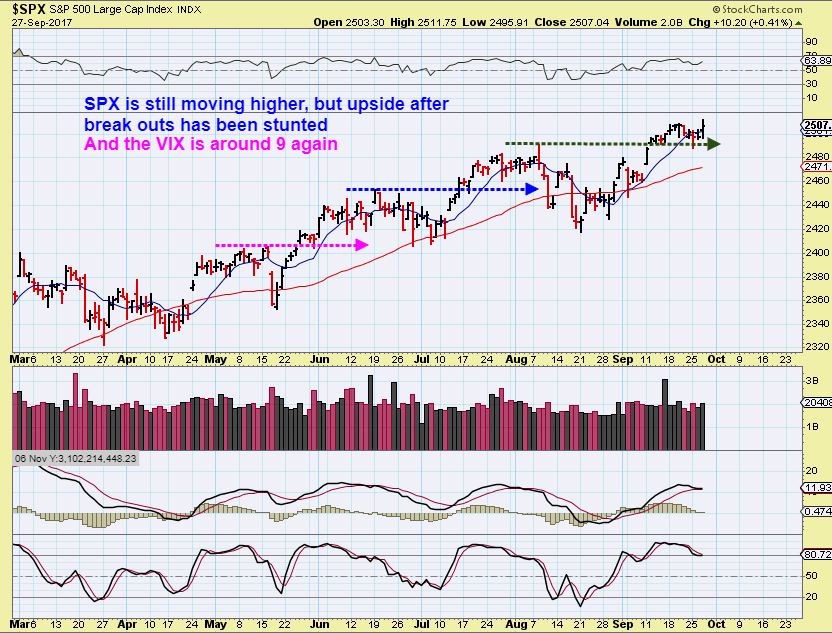
Last week I pointed out the differences that I was seeing in the General Markets. For example the SPX, NASDAQ, RUT & IBX , XBI ( LABU) were all acting a bit differently. Let's revisit a few of those charts ...
.
SPX - The SPX looks ready to break out higher, but I had mentioned that I felt that the upside is limited, since each prior break out has simply moved up, gone sideways, and then dipped back to the 50sma. I'd still be ready to lock in profits in the near future.

Now let's look at the NASDAQ...
Read More
Scroll to top
 Read More
 Read More


