Public Post – That Popular Gold Bull Fight
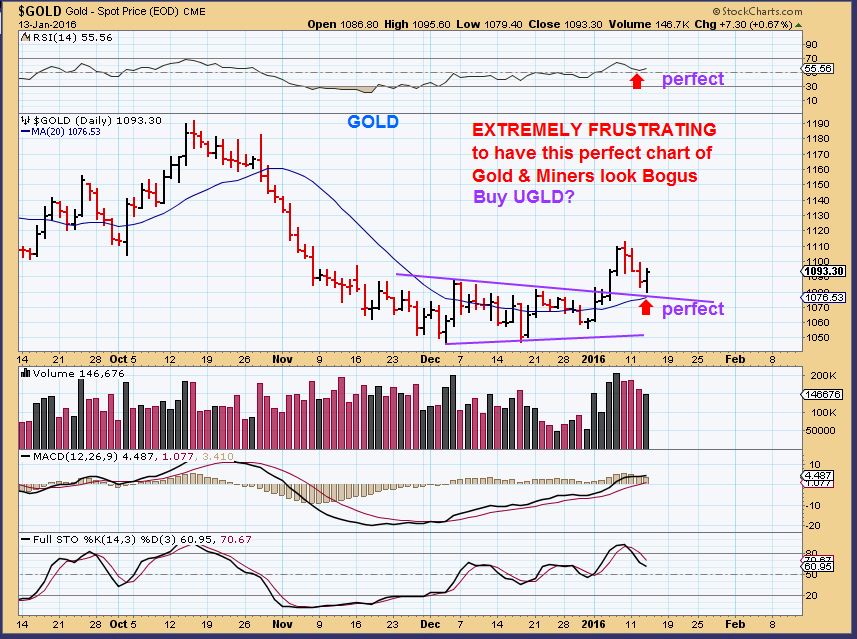
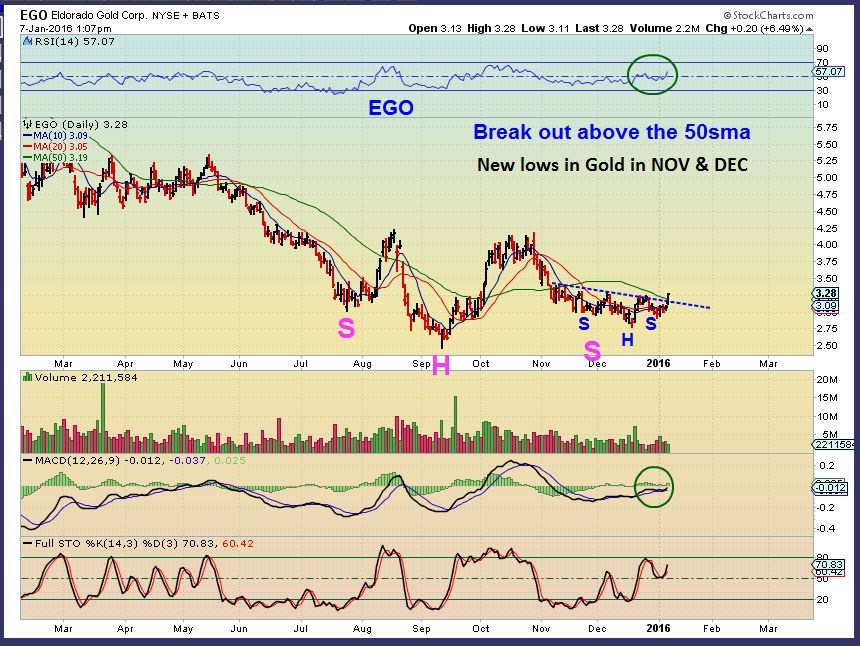
In my last public report, I pointed out that I expected Gold to back test the break out & 50sma area. I posted this chart.
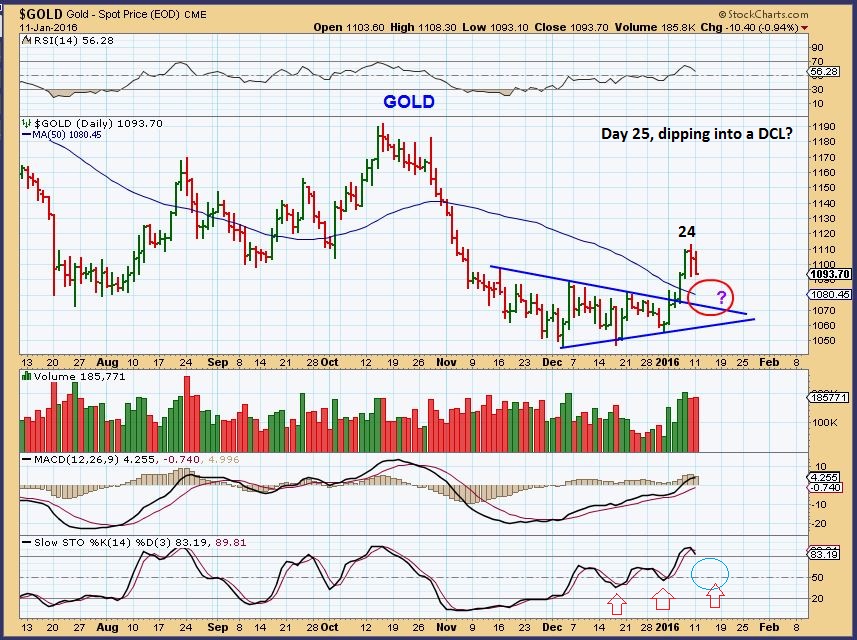
We got a perfect back test as expected and reversal. This chart from Yesterday looks very Bullish, but Miners didnt react strongly.