Author Archive for: Alex - Chart Freak
Entries by Alex - Chart Freak
What’s New? July 25th
We have an FOMC Meeting this Wednesday, and the weekend report covered a lot of the general markets and various sectors expectations. With that in mind, we will review a few of the things that took place on Monday, and then I will point out a few more stock picks...
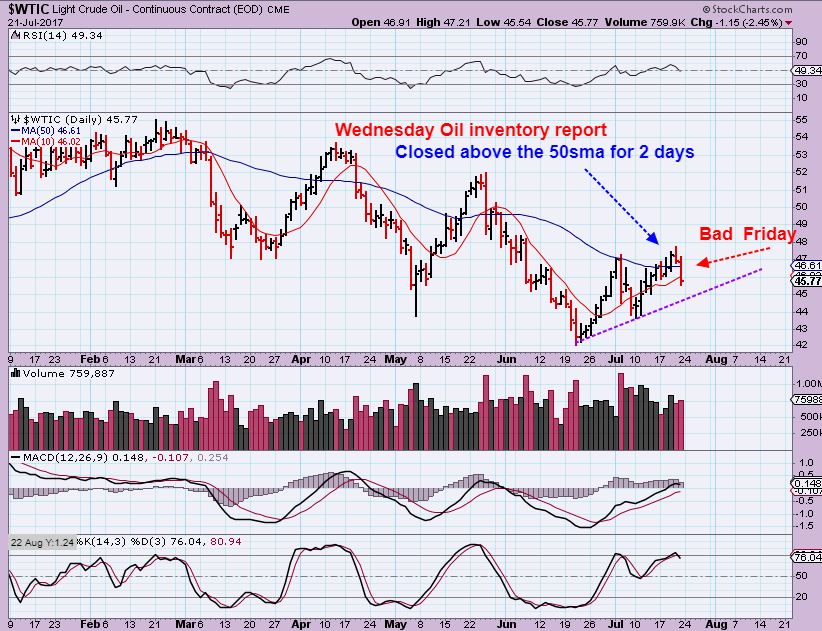
WTIC JULY 21 - From the weekend report I pointed out that Wednesday with the inventory report, Oil broke over the 50sma. This was bullish, an then it plunged 2 days later back below the 50sma. I said that I will be watching for this trend line to support the drop, for it to remain bullish.
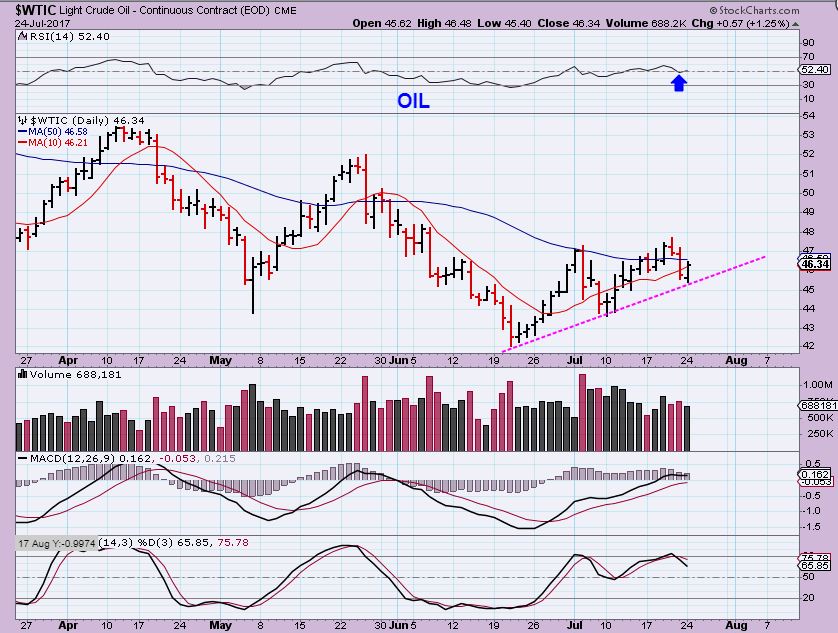
WTIC JULY 24 - Well how about that! Let's see if Oil can get back over that 50sma.
WEEKEND WRAP UP JULY 23
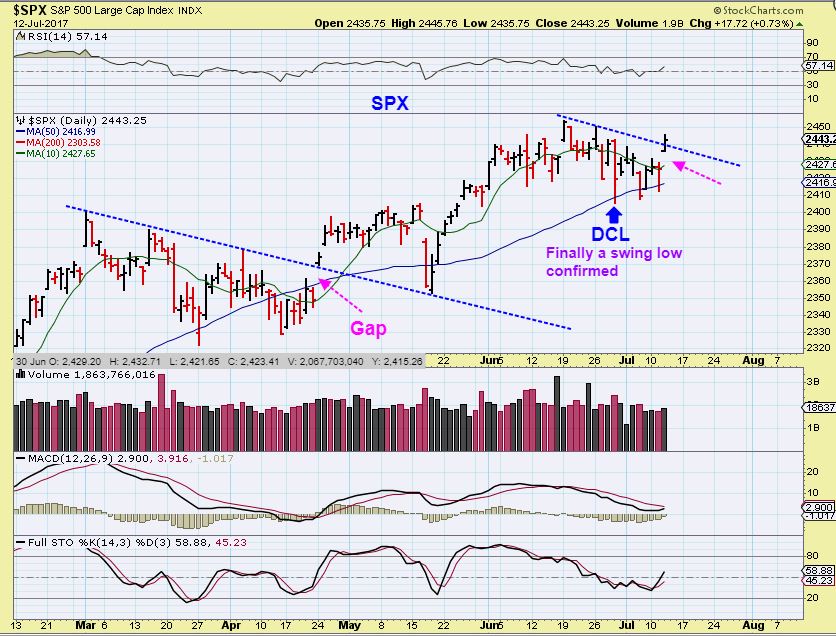
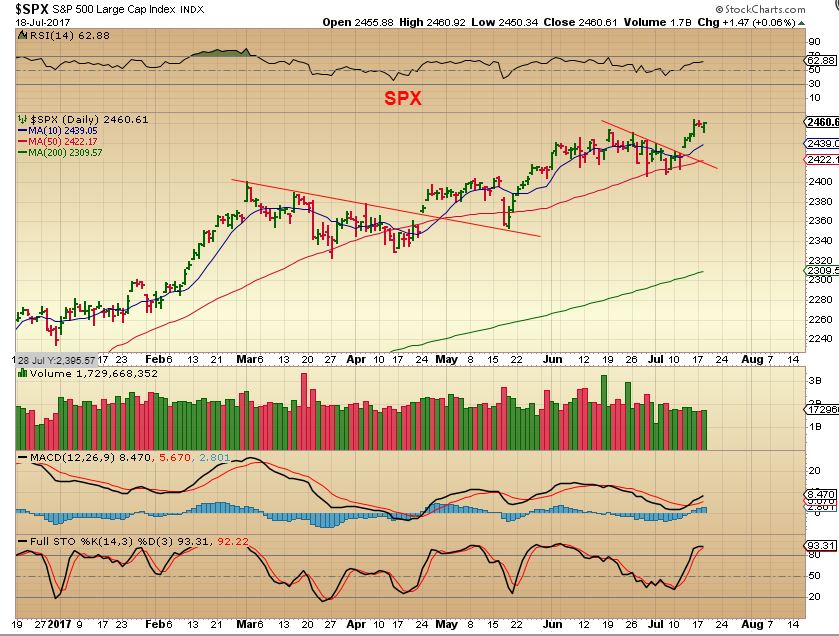
SPX - This could be a swing high, but we also saw this type pf action 5 days ago, didn't we. Also we see that Friday ended as a reversal higher, so a confirmed swing high would need to drop below 2460, at this point.

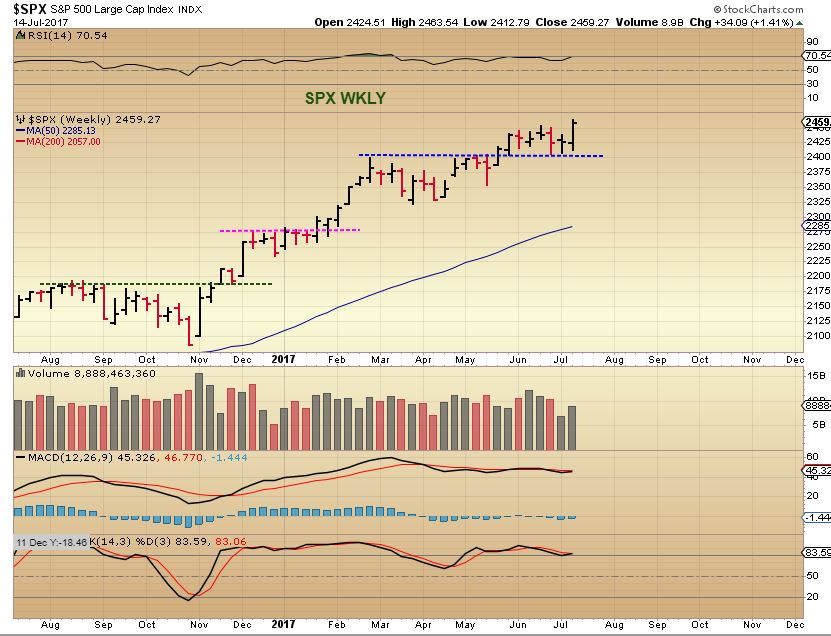
SXP WEEKLY - The SPX Longer term chart is at an area that has been toppy in the past. It can just keep climbing, or drop into an overdue ICL, so trailing stops should remain in place. 
FRIDAY JULY 21
Today is Friday and this week has seen a lot of trades setting up and following through. Let's take a look at some of the action...
Thursday July 20- ENERGY NOW PERKING UP TOO
Things are really stacking up for traders and investors now. As mentioned in prior reports, and proven true on a day to day basis, Metals, Energy, Solar stocks, Precious Metals, and more are all signaling good things to come. Let's get right into it...
NASDAQ - The NASDAQ has moved higher for 9 straight days. It even gapped open on Wednesday. We got a 'safer buy signal' on the move out of the lows above the 50sma last week, so...
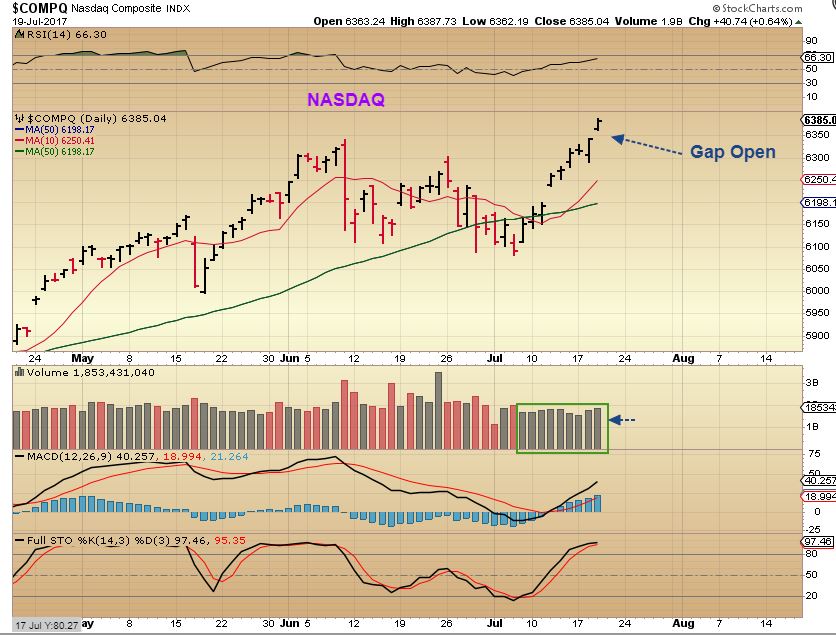
If you entered TQQQ you are up 11% in 8 days. Not bad for a fairly safer trade.
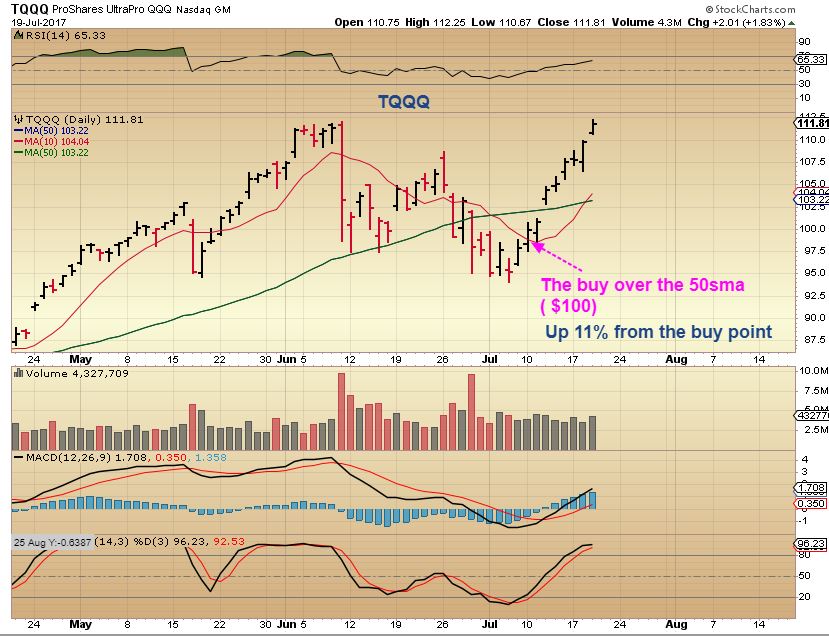
I do want to mention 1 thing though....
Wednesday July 19
SPX - Going long the break out is still working with a loose trailing stop, after this long sideways consolidation. The SPX held the 50sma in the recent drop.
Just Take A Look
For more than a month now, following weeks of choppiness and sell offs, I've been pointing out some nice set ups in various sectors. We are now seeing decent trades and some follow through, so today I want to point out an area that I think we all should take a look at...
JULY 16 WEEKEND REPORT
SPX - When we gapped up over that trend line ( Again, see April) and held above the 50sma, it was obvious that the bull market remains in tact. The SPX also experienced follow through last week. I'm not saying that we will drop soon, but that last Gap in April was filled at the next dcl as a back test of the break out. If we get more sideways movement than upward , that may be what is happening.

SPX WEEKLY - Bullish, though extremely overbought.
Friday July 14
We traded LABU ( XBI, IBB) in June and made some quick gains. I believe that it may be time to go biotech again.
XBI - After a solid run higher from a bullish W pattern consolidation, the XBI & IBB has formed a bull flag. Both broke higher with increasing volume yesterday. This can be bought here with a stop under the bottom of the flag. I want to point out that this Flag MIGHT turn into a longer consolidation pattern too. See the next chart...
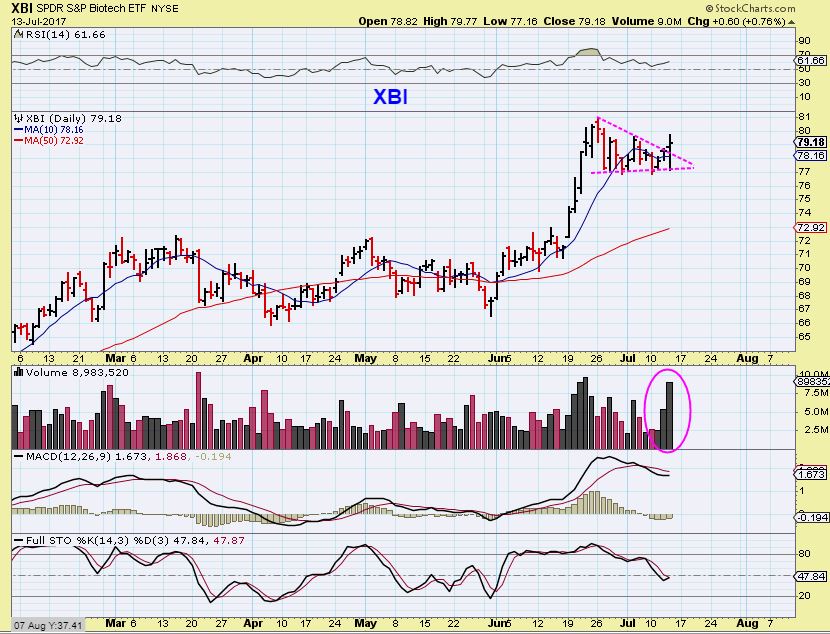
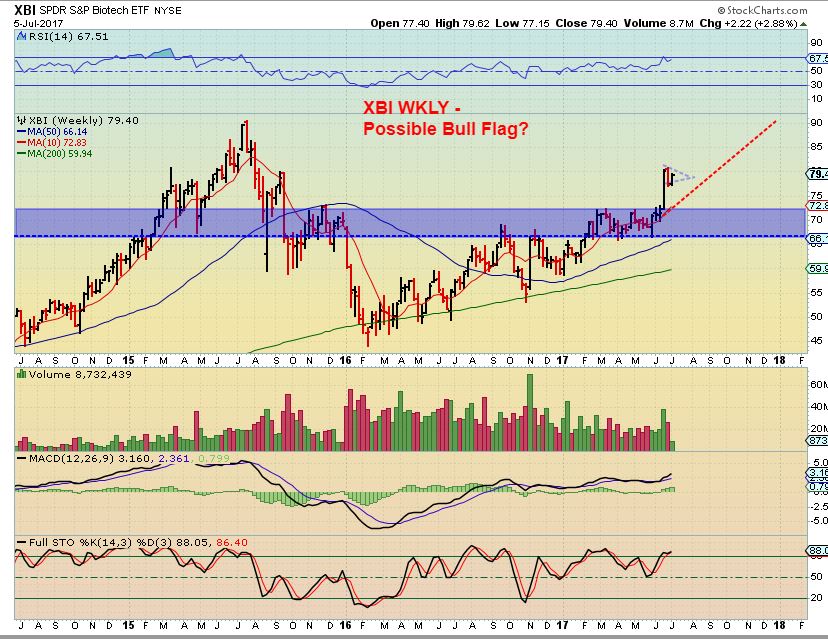
XBI JULY 5th - I noticed that some readers were shorting XBI & IBB in early July, so this was my chart from July 5th showing that a bull flag could form, not making it a profitable short. It could run sideways for weeks until the 10ma on a weekly basis catches up. My target has been the former highs around 90 .
Thursday July 13
The climb is hardly ever straight up.
.
SPX - We were anticipating a trend line break and a close above the 10 sma to help confirm a dcl. We got it. The last time that this happened, the gap filled one month later.