Entries by Alex - Chart Freak

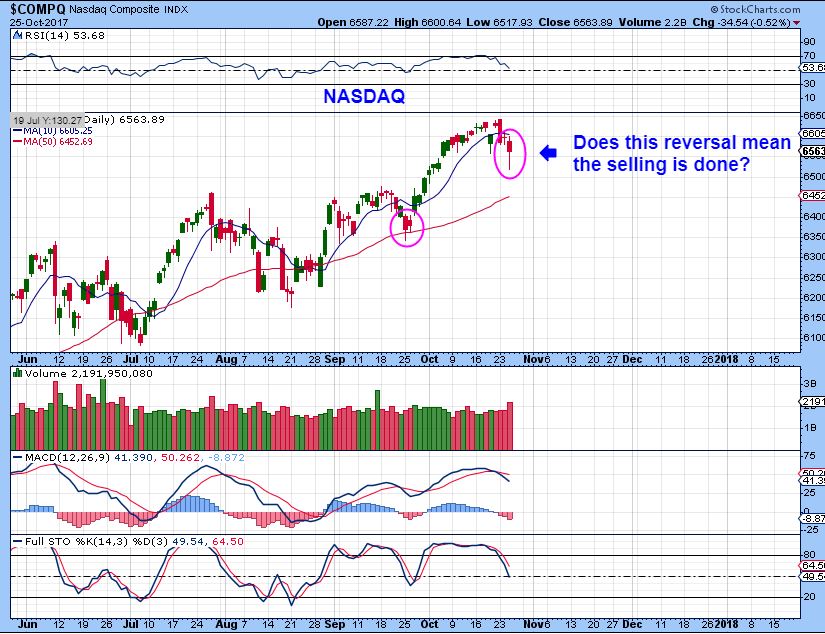
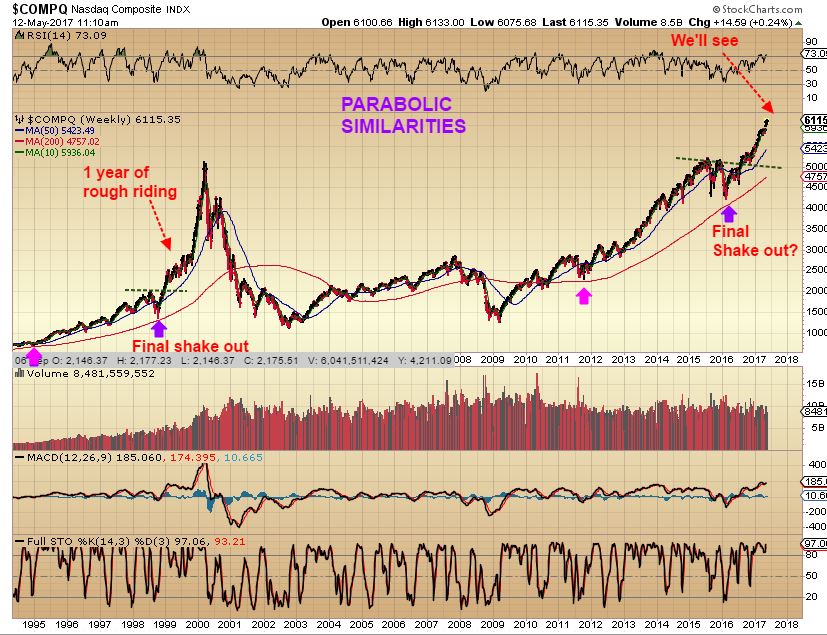
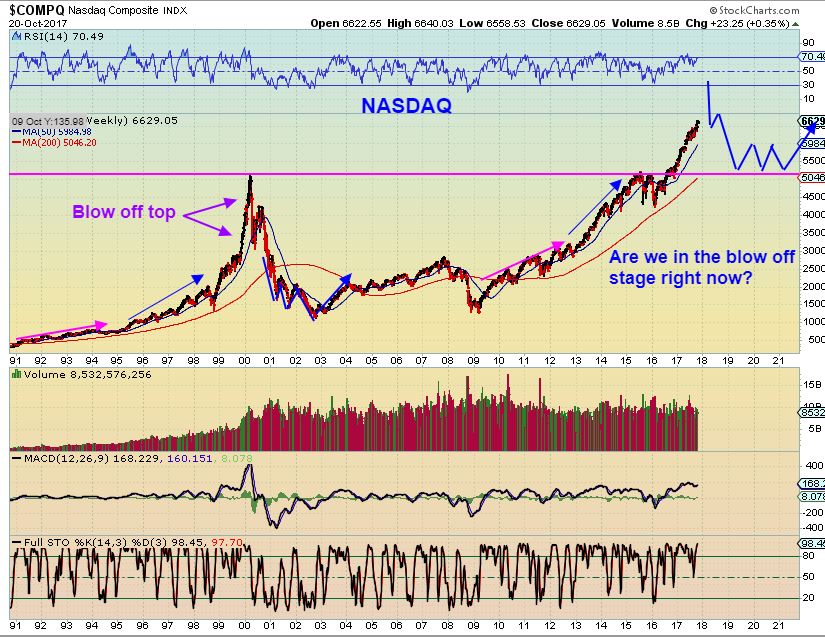
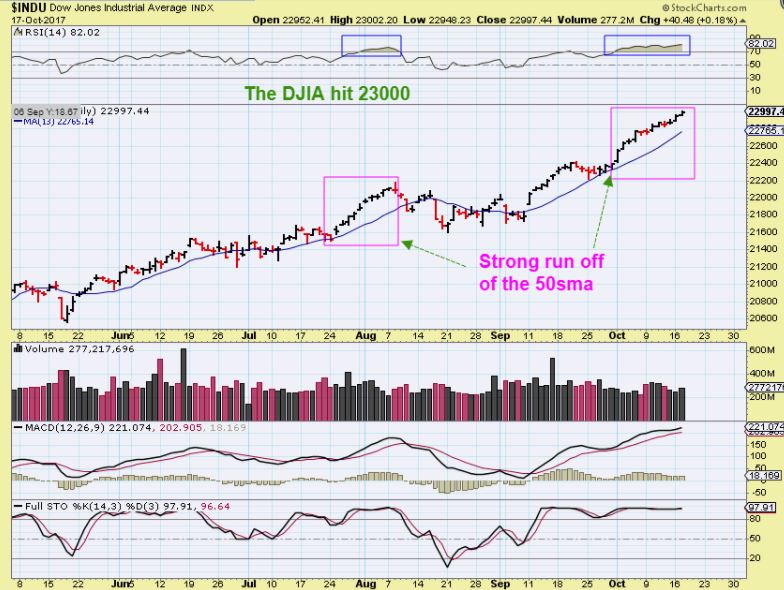
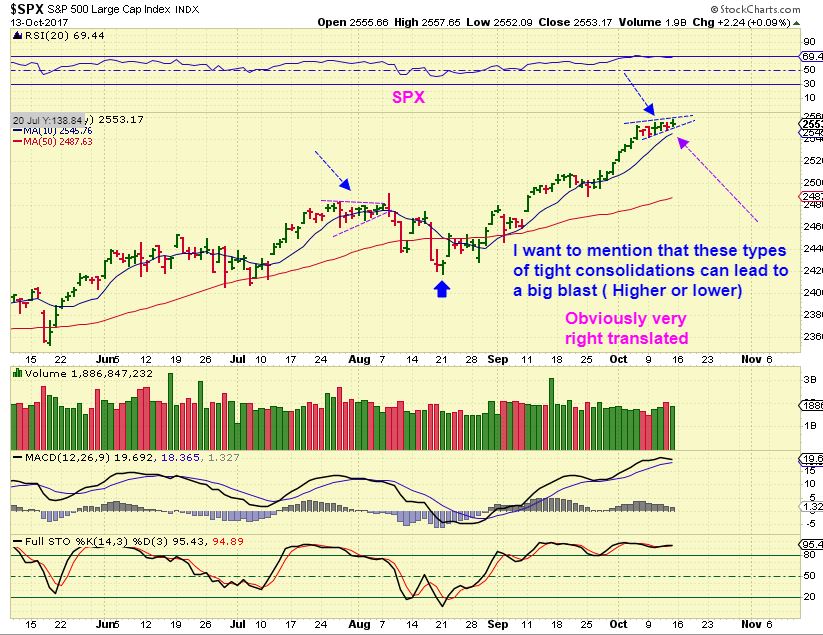
October 25 – Are We Rolling Over?

Are the markets starting to roll over? If so, will it be a deep dip, a 'Buy the dip", or is this just another 'one day sell off and recovery'? Let's take a look at the charts and see what we can take note of...


NASDAQ - So here we see that the NASDAQ sold off yesterday, but by the end of the day, some buying came in and gave us a reversal candle. Does this mean that onward and upward we go?


Read More

Tuesday – Oct 24th

As I proof read this report written last night, the Futures for the General markets are actually higher ( Green) .  The markets signaled a possible pullback yesterday.  When we discussed the possible Parabolic blow off top scenarios, it was pointed out that the ride was a bit choppy before that final straight shot to the top.  With that in mind, Let's discuss our markets as of Monday...

 .

NASDAQ OCT 20 -  The 'choppy' run higher would involve dips and surges.

NASDAQ -  I pointed out that dips to the 50sma would be a good entry point if we were to get one.

SPX MONDAY -  We now saw a 'Bearish Engulfing Candle' taking away Fridays gains.  These are usually bearish and can see follow through down, so let's discuss market dips as a possibility going forward.

Read More

Oct 23rd – THE BIGGER BIG PICTURE

I AM OPENING UP THE WEEKEND REPORT TO THE PUBLIC.  IT IS A LONG REPORT, SO IT WILL TAKE SOME TIME TO READ, BUT I HIGHLY RECOMMEND IT. IT IS A BIGGER BIG PICTURE VIEW.  ENJOY & THANKS FOR CHECKING IT OUT!


This weekends report is going to be a bit different.  I often give the Big Picture review, and with that, we have been discussing since last January the possibility of a Blow Off Top / Parabolic move resulting from the general markets' bullishness.   Well, this is going to be an even Bigger Picture discussion, with a number of different Markets discussed.  It is a long detailed report designed to answer many emails that I have received about the bigger big picture , so grab some coffee or tea and let's begin...


NASDAQ -  This chart was from last May.  I posted this idea of how the current rally that we were seeing could be becoming  parabolic. Parabolic moves seem like they will never end, and you'll hear that "Nothing can kill this market", and it feels so true. Then suddenly, they die a brilliant death as you can see in the year 2000. See the chart below, where we examined similarities of a final shake out consolidation, a ramp up with somewhat choppy trading that would still having higher lows, higher highs, and then the final Ramp higher...

NASDAQ - Here we are now and the choppiness with higher lows and higher highs seems to be playing out now, and a blow off top would follow. OR, is this the blow off top in play as it just continues higher?  This move is verticle and could lead to the blow off top.  Just ride it long. I have drawn in  a post blow off top scenario with a normal 'back test' of the break out. Let's dig in further...

NASDAQ - Currently, the 'choppiness', when examined close up, is normal.  I have advised buying with a reasonable trailing stop. Each dip to the 50sma can be bought as a low risk entry. Was that tiny dip the DCL, because we are so late into this current daily cycle?  I'll show you why that could be possible later using the RUT AND TRANNIES. If it isn't a dcl, and we get a dip to the 50sma (even with a shake out there), that would obviously be a 'buy'- please read the chart. THis is a healthy strong bull run.

Now let's also look at the BIGGER PICTURE  SPX, RUT, TRAN, DJIA


Read More

THE BIGGER BIG PICTURE

This weekends report is going to be a bit different.  I often give the Big Picture review, and with that, we have been discussing since last January the possibility of a Blow Off Top / Parabolic move resulting from the general markets' bullishness.   Well, this is going to be an even Bigger Picture discussion, with a few shorter term charts at the end for update purposes. It is a long detailed report designed to answer many emails that I have received about the bigger big picture , so grab some coffee or tea and let's begin...


NASDAQ -  This chart was from last May.  I posted this idea of how the current rally that we were seeing could be becoming  parabolic. Parabolic moves seem like they will never end, and you'll hear that "Nothing can kill this market", and it feels so true. Then suddenly, they die a brilliant death as you can see in the year 2000. See the chart below, where we examined similarities of a final shake out consolidation, a ramp up with somewhat choppy trading that would still having higher lows, higher highs, and then the final Ramp higher...

NASDAQ - Here we are now and the choppiness with higher lows and higher highs seems to be playing out now, and a blow off top would follow. OR, is this the blow off top in play as it just continues higher?  This move is verticle and could lead to the blow off top.  Just ride it long. I have drawn in  a post blow off top scenario with a normal 'back test' of the break out. Let's dig in further...

NASDAQ - Currently, the 'choppiness', when examined close up, is normal.  I have advised buying with a reasonable trailing stop. Each dip to the 50sma can be bought as a low risk entry. Was that tiny dip the DCL, because we are so late into this current daily cycle?  I'll show you why that could be possible later using the RUT AND TRANNIES. If it isn't a dcl, and we get a dip to the 50sma (even with a shake out there), that would obviously be a 'buy'- please read the chart. THis is a healthy strong bull run.

Now let's also look at the BIGGER PICTURE  SPX, RUT, TRAN, DJIA


Read More

Out Of The Woods?

The markets had a bit of a drop yesterday, and some recovered and even closed green by the end of the day. Are we out of the woods now, with only upside ahead again?  Let's take a look at some charts...

TNA - We are late in the timing for a dcl, and I could paint a case for the TNA, RUT, IWM, etc as having pulled back enough for a dcl.  It broke a trend line, and closed under the 10sma to satisfy the requirements. A Follow through upside and a break out above the Magenta line would be bullish. What a beautiful run higher the small caps have had.


Read More

Thursday October 19th


SPX - Yesterday in our comments and in other blogs I read where people were saying how this market can't pull back,  nothing can drop it down, people were adding leverage, etc .  That very thing happened at the various 'tops'  before a big drop on other occasions, late in a daily cycle.  Let me show you the DOW & THE NAZ.


Read More

Wednesday October 18


DOW JONES -  No change here, just a bullish run up and off of the 50sma that seems like it'll never end, but they do. We are overdue for a dcl, so trailing stop and we'll see if we get that dip this week. The Dow hit 23,000 for the first time ever.  When it hit 21,000 & 22,000 it dipped within 4 days.


Read More

OCT 14th Weekend Report

For the weekend reports, I am trying to cover all of the sectors and point out where we are in time and what we are looking for in the big picture. During the week, I focus mainly on things like stock picks , trade set ups, day to day progress and expectations for the various sectors near term.  In some cases, when advantageous, I'll  cover daily charts in the weekend report too. This weekend I will do a little of both.  Let's take a look at our Big Picture expectations.


SPX DAILY - We are running late in this daily cycle, so it is due for a dip into a dcl. The markets have been very bullish and buyers have bought each 1 day dip lately.  Now -  Look at the Last week of July & the First week of August.  We may have a similar formation now, however a POP in any direction can take place first. Trailing stops work the best here.

Weekly charts ...

Read More