Entries by Alex - Chart Freak

February 2nd – Weekend Update


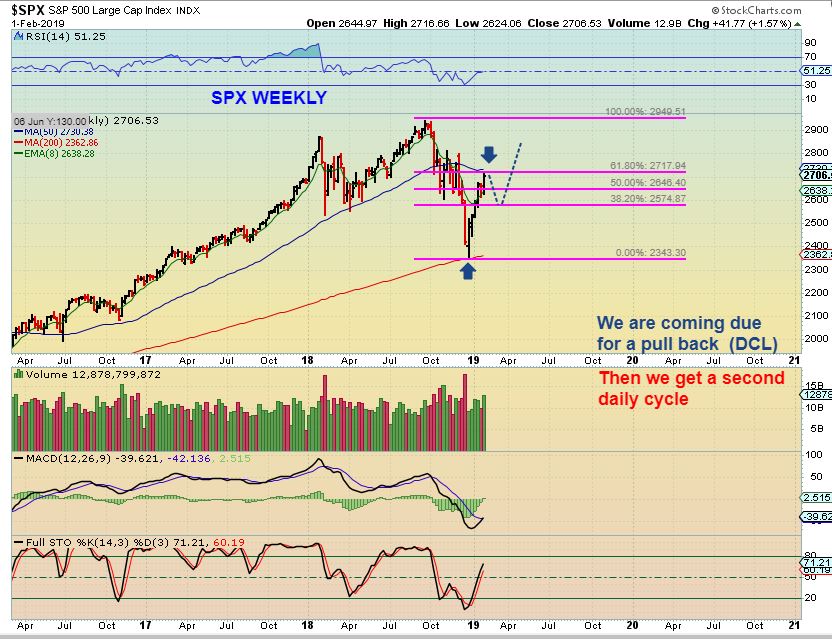
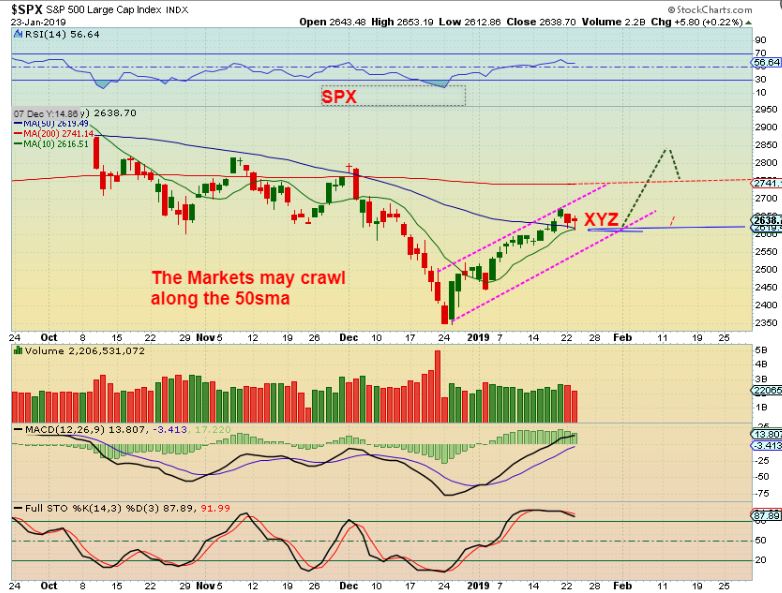
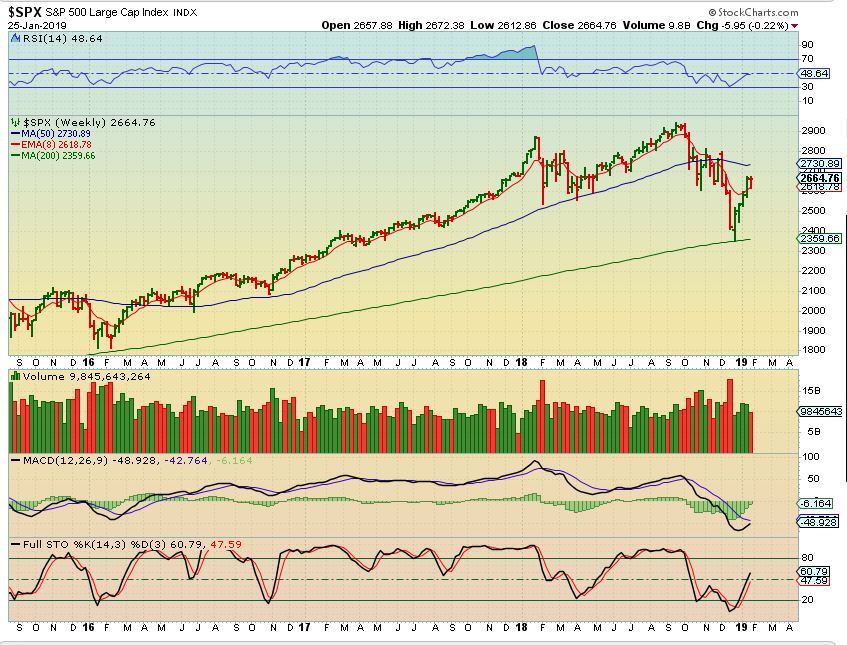
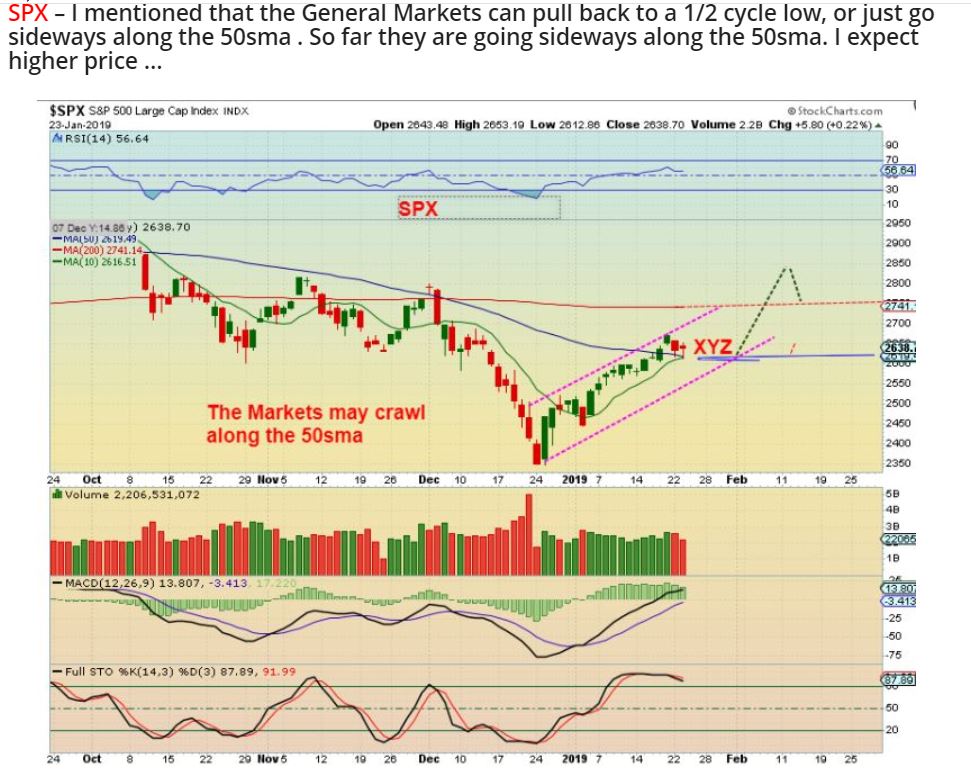
SPX Weekly  #1 -  This is what I have said that I have been expecting out of the first daily cycle, and now we are hitting 2 resistance zones.  We May or may not be at a top, but timing wise, we are close.  We will dip to a dcl soon.

Read More

Trading Technique: Go Where the Action Is

(The following is a sample of Alex’s work from the week.  This is more of a sophisticated trading technique best served for traders with some experience under their belt.) (From 2/1/19) This example is a case where a trader is holding several positions and while active trading them, notices that one is beginning to run […]

January 31st – Post Fed Pops


We had some nice action after the FOMC Decision Wednesday.  A lot of the sectors played our as expected, so lets discuss what to expect going forward too.

.


SPX - The General Markets broke higher with the Fed 'No Rate Hike" Decision.  I expect a little more upside.


UPRO - UPRO, SOXL, TQQQ, etc are good 3x etfs for 'Fast Gains",  since this daily cycle could peak after another run higher.

Read More

January 30th – Waiting On The Fed Again

 Let's take a look at the markets current set up, as we wait for the FOMC Decision at 2 PM. Eastern today.

.


SPX -  Basically still sliding sideways along the 50sma as expected, we had no  real change in the General Markets.  Are they waiting for the FOMC Decision too? 

I wanted to take a look at something else here, to see if there are any clues as to which way the Markets may break after the Fed Decision...

Read More

Tuesday Jan 29th – Hang On

When a trade is acting correctly, sometimes we just trade out of them after they hit an estimated target, and wait to see if they pull back and offer another entry point.  In some set ups, however, if the run looks really bullish,  I  may just encourage  selling a portion on the way up and trying to Hold On if you can. I will explain that a bit more later in the report, after a brief discussion of our markets...


.

SPX -  Last week I mentioned that because of the rising wedge, Price may need to crawl sideways along the 50sma as shown  (XYZ) to form more of a channel.

SPX -  So far it has done just that.   It is day 21, and I feel that we could still run to the 200sma and then 'peak' and drop into the dcl. 

Read More

The January 26 Big Picture Weekend Report

We had another very active week of trading, and opportunities were wide ranged for traders and the short term Buy & Hold investors alike.   Trading has been excellent and profitable for weeks now.   Let's take a look at The Markets and future expectation...

.


SPX WEEKLY - The run out of the December ICL has been a sharp rally with a slight pause this week.  It should continue to the 50 weekly ma  (Blue line) over time. 

Read More

Round 2. Pot Stocks

I want to show you how I follow individual stocks over the course of a month.  In this post, I’ll show you how I have been covering NBEV. [The following is a sample of Alex’s work over the past few weeks] (1/10/19) NBEV  DECEMBER 21  – Back on Dec 21, NBEB broke down through an […]

Jan 25th – Even More Hope Ahead?

After avoiding the stormy waters of the sell off in October through December, we had the hope of a nice rally out of the ICL , and some good trading opportunities presented themselves.  I have mentioned the importance of watching how the first daily cycle unfolds, and especially the 2nd daily cycle.  Well, we have some 'things' to look at that add hope that the current gains may continue for a while longer...

.


Just yesterday I said and drew these two things about the market...

Read More

Jan 24th – Swim At Your Own Risk

When a Red Flag shows up on the beach, it means that for some reason, it is unsafe to swim in those waters. Well, after 3 nice weeks of gains  in the Oil & Energy sector, I am still seeing a Red Flag in those waters. As mentioned in yesterdays report, Oil itself still looks fine, but it seems that some of the Oil / Energy stocks may not like the waters that they find themselves swimming in. It looks like a Red Flag to me.

Let's take a look at our markets...

.

SPX - I mentioned that the General Markets can pull back to a 1/2 cycle low, or just go sideways along the 50sma . So far they are going sideways along the 50sma. I expect higher price ...


Read More