Archive for month: May, 2016
Patience in the markets can be rewarding and it might come in various forms. Patience is often needed to wait for a pull back to turn into a buying opportunity or a trade set up. It also might come when we are holding positions and we are waiting for price to show follow through. This weekends report showed mixed signals in various sectors and Monday started clarifying a few things, but a little more time might be needed to truly see what is unfolding. lets review...
.
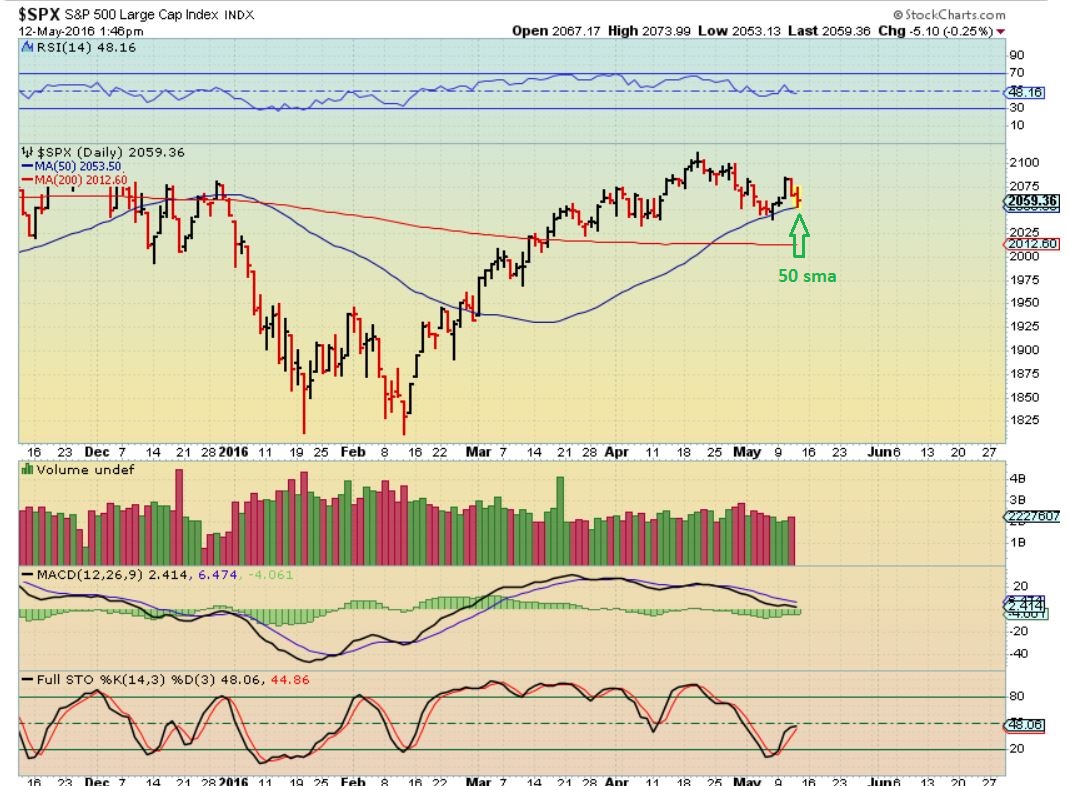
SPX -The general markets showed some upside potential, regaining the 50sma. It looked like the DCL came 7 days ago, so now we need to see some follow through to new highs to avoid having this become left translated and a repeat of last fall.
Read More Using charts like the one below, you may recall that I had been call for a low in Oil in early 2016 and snap back rally in Oil and Energy stocks. Since that time, many analysts still called for another price crash, and that includes Goldman Sachs . Is this important? It is if you missed some of the 100%, 200% 300% gains in some of the energy stocks.
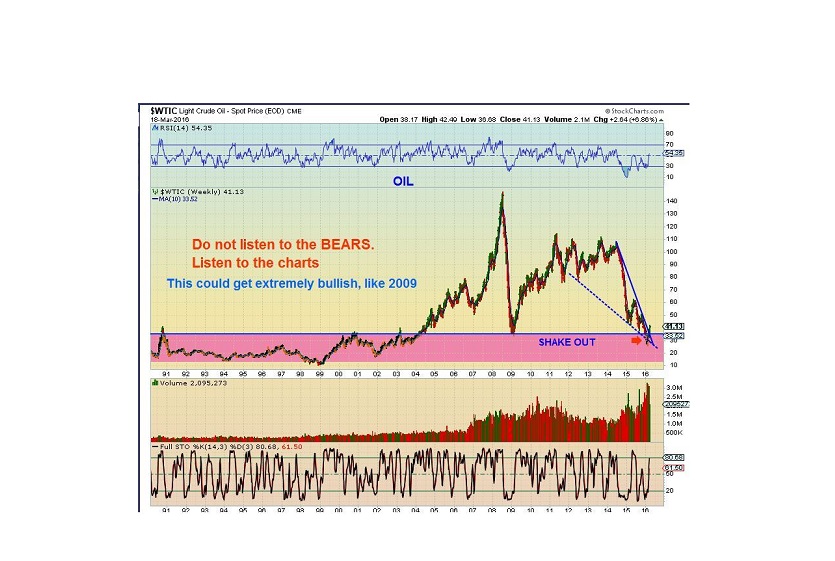
Did you see the news today about Oil by Goldman today? This was the headline.
Read MoreWhile looking at a variety of charts for the weekend report, I started to see things give us some mixed signals about he health of various sectors. With that in mind I wanted to do something just a little different for this report.
.
Read MoreThis is my "It's Friday and I dont usually do reports on Friday" report. Whenever Thursdays action raises questions that can't wait until the weekend, I do a Friday report.
.
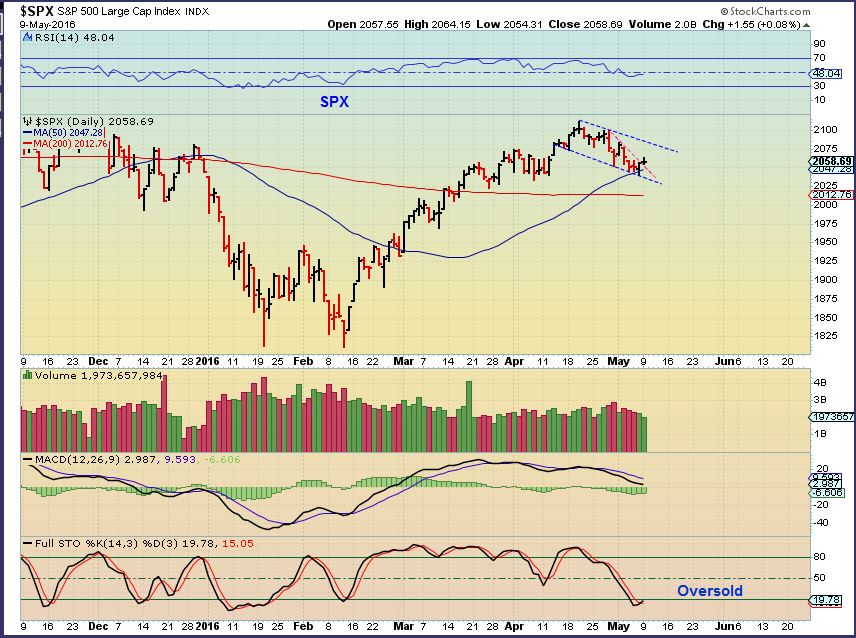
SPX - This was yesterdays chart. We likely saw a DCL last Friday with the reversal at the 50sma. AS LONG AS THOSE LOWS HOLD, the DCL is in place. Even if it goes sideways for days above the dcl, like the red circle that I drew above the Jan DCL, nothing has changed.
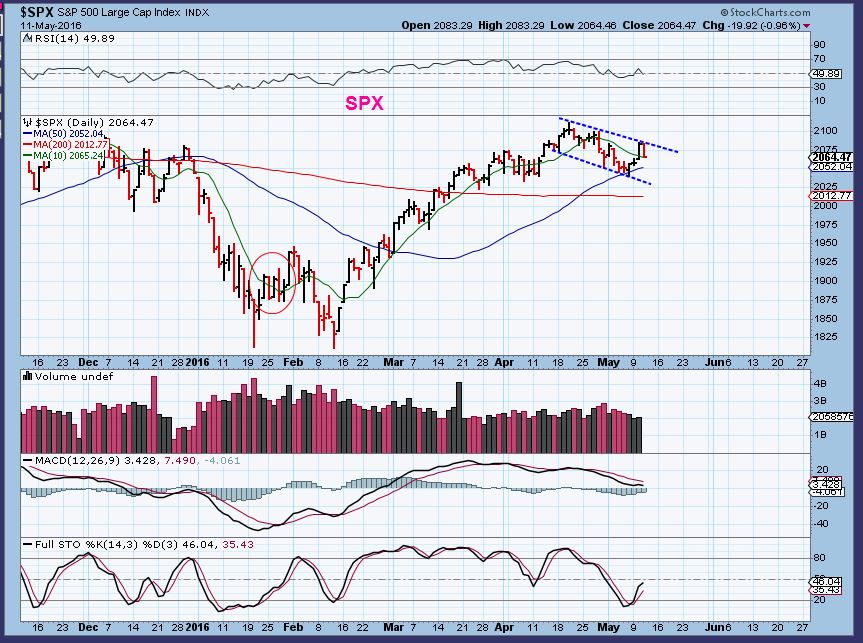
SPX Thursday - Nothing has outwardly changed yet, but this is looking weak. Volume increased a bit, the MACD looks weak, and the hrly charts look weak. If this breaks down, that H&S measures a move down to the 200sma. Do I expect that?
 Read More
After a brief market review, I want to point out something that seems to be telling me that now is the time to act. Lets begin...
.
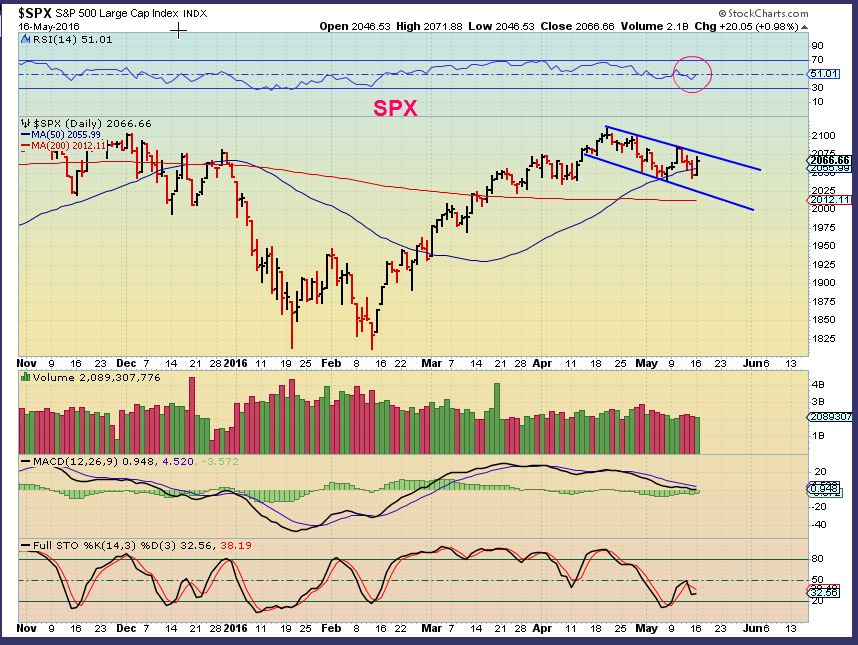
SPX - Price was rejected at the upper trend line, and it dropped down to the 10sma. The Red Circle shows that shortly after prior DCLs, price did the same thing. A drop below the dcl would not be healthy, the first daily cycle would be extending way too far and I would be suspicious.
.
From here I'm going straight to OIL, NATTY, and The CRB...
.
Read MoreHave you ever been thrown off of a Bull? Maybe your stop was triggered only to see that stock turn and move higher. What can you do? We'll discuss that after a quick market review.
.
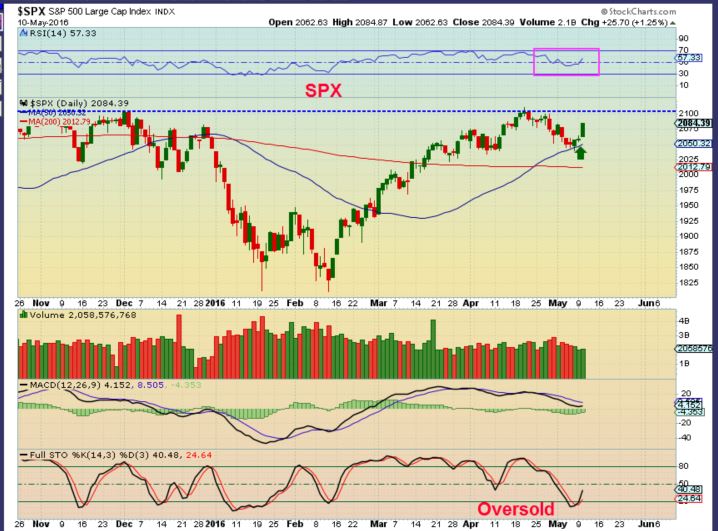
SPX - This was my May 5th chart. I have been pointing out that the SPX ( And general markets) are due to rally.
SPX as of Tuesday - That is what we see happening as the markets were green for the past 3 days.
 Read More
That is the question...
.
SPX - I'm Still expecting higher prices in the near term, with a DCL likely in place.
.
Read MoreWe will discuss the Theme Picture later in the report, lets get right into our market review...
.
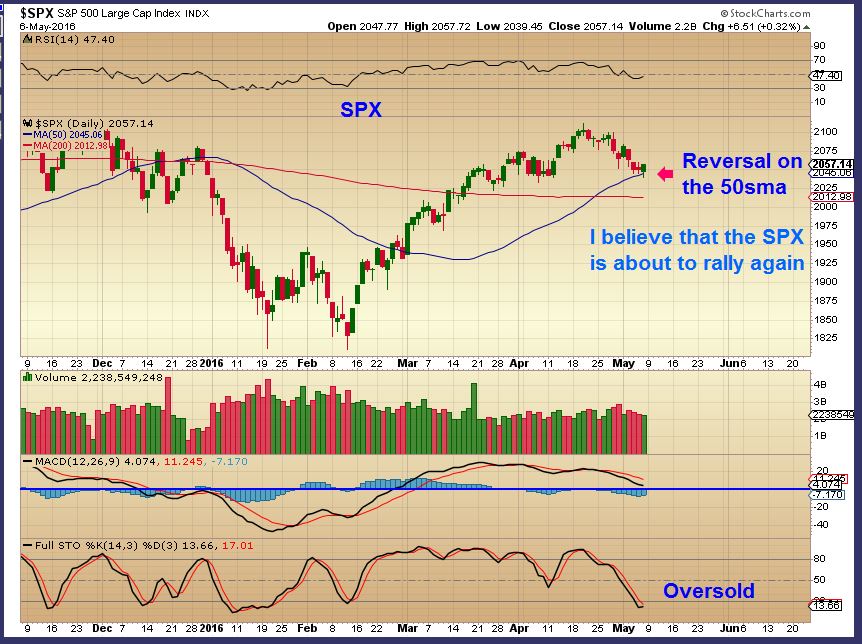
SPX - We are expecting and late for a DCL. The SPX tagged the 50sma and put in a small reversal candle. I believe that we are about to get a move higher.
That calls for a look at the bigger picture...
Read MoreOur perspective on certain things can affect our emotions. Isn't it true that how we view things often changes the way we feel about them? Especially if there are two sides to a story? 🙂 Well it can be that way with trading too. We can look at a long term bullish chart and see it as 'horrible' if it is pulling back below our buy point. The faces in the Theme picture above could very well be the many faces of trading, so I am going to discuss perspective and emotions.
.
If I show you this stock and simply ask, " Is this chart Bullish or Bearish?" How do you answer?
.
BULLISH, right? It has run up 300%, its in a channel of higher lows and higher highs, and has just pulled back from $14 to basically $11.50.
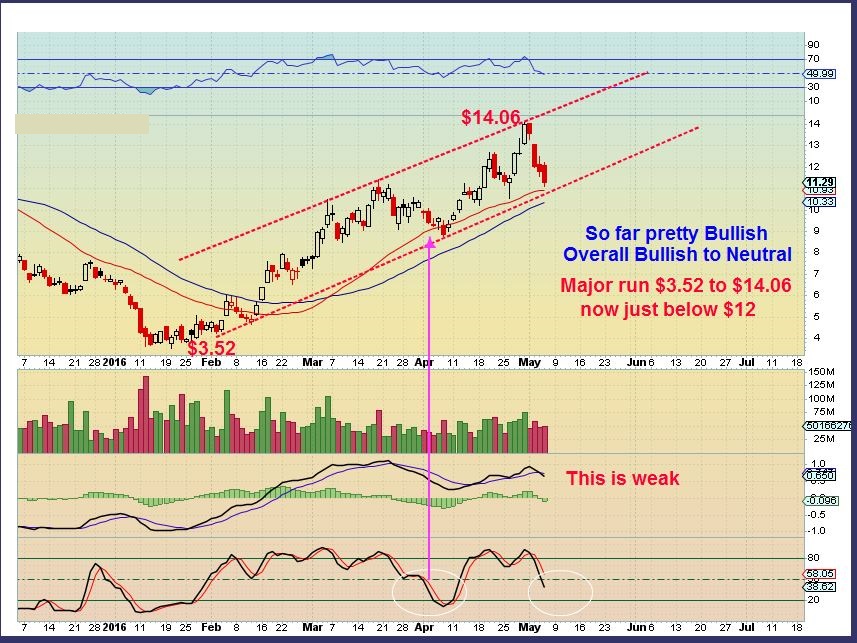
Perspective : I am being told that this is one dreadfully ugly chart. If you bought at $4, you may love it, but if you bought it at $12, $13, or even $14? It has been nothing but volatile.
.
So you see, it is a matter of perspective...
.
That chart above is FCX, and anyone who bought it in the past week may not be as happy as those that bought it lower. Lets zoom in. Please read the chart.
 Read More
We've seen some selling in the markets this week, are their brighter skies on the horizon? Yes, I believe there are. Lets take a look...
.
Read More
Scroll to top