Archive for month: June, 2015
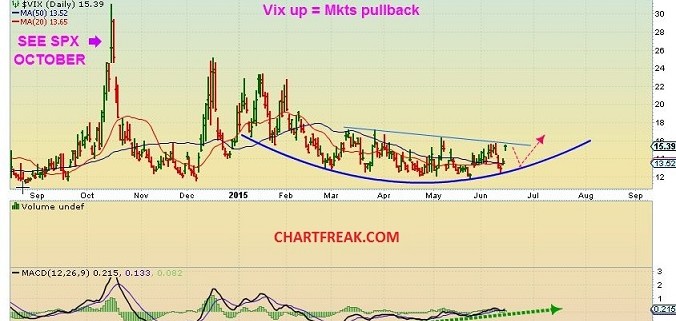
As mentioned in prior reports, sideways consolidations and bases can build up energy for larger directional moves. The Vix chart above ( click on it) seems to be basing and other sectors also have been moving in sideways in consolidations. If the VIX breaks out & runs eventually, the markets should correct. Lets take a closer look at recent activity and see if we can determine what it means.
.
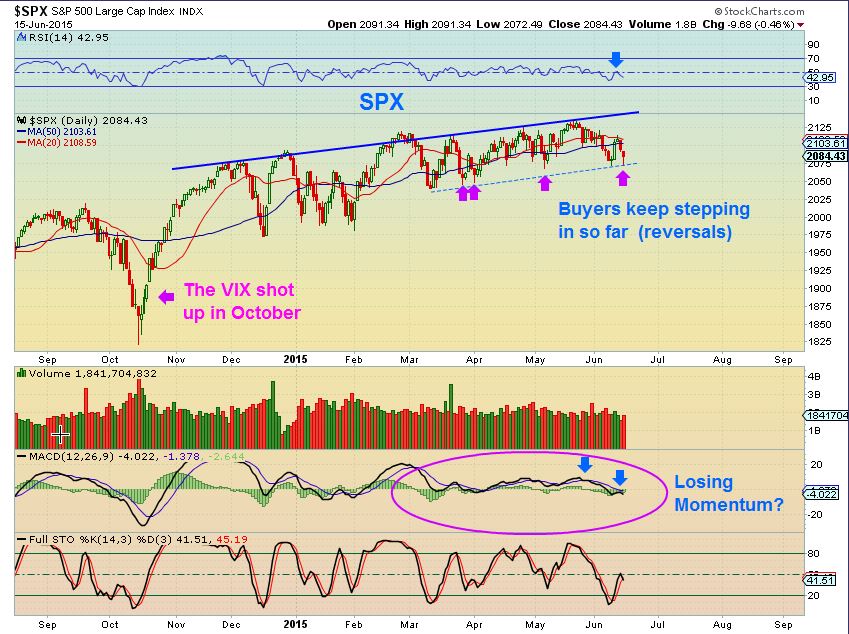
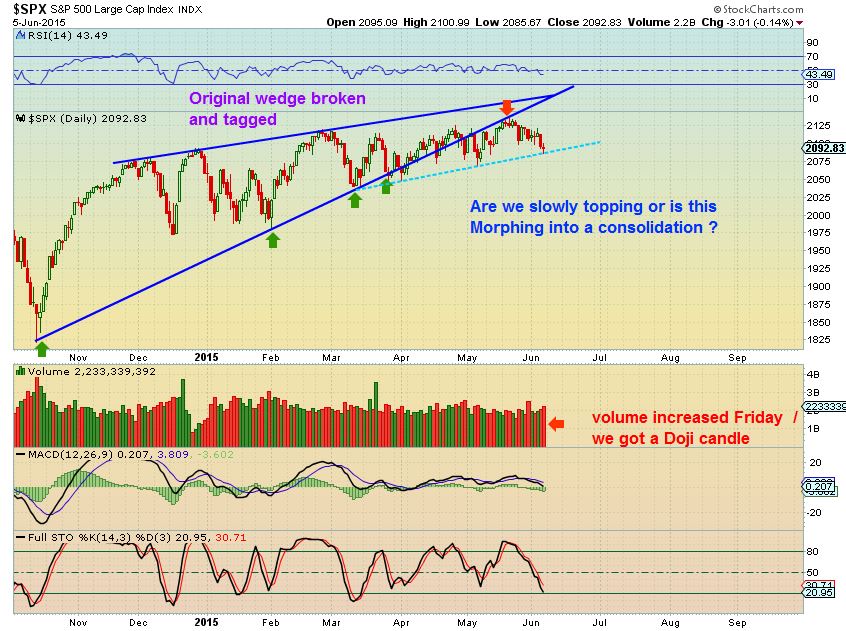
SPX- So far the dips have been bought and trading this pattern has been obvious, but is it due to change sometime soon?
Lets take a look at the NASDAQ...
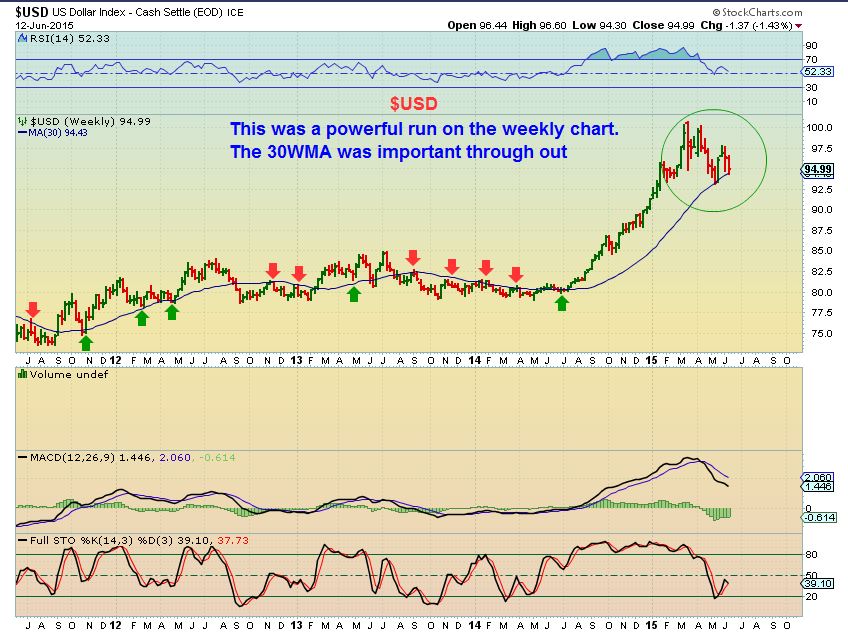
Read More USD WKLY - looks strong and found support in an important area
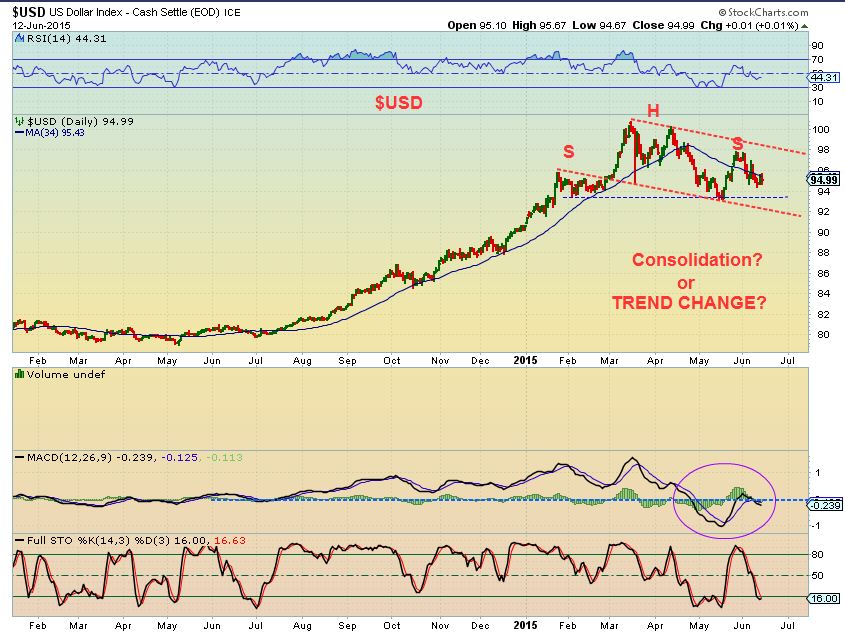
The DAILY USD - looks a bit more bearish. The MACD dipped well below the zero line for the first time in a long time. Is that a H&S forming? The outcome of this move could affect all markets.
Lets look at several other sectors...
Read MoreQuick Low Risk Trade Idea -
Read MoreHello again. I published 34 chart setup and trade idea's earlier today to Premium members. Consider a membership for just the cost of a few trade commissions per month. It really does not get any more affordable than this service. See your options here: http://www.chartfreak.com/my-secrets/
.
SPX - it was assumed that we would turn higher here. A low risk long trade.
 Read More
Things are stacking up as expected.
.
SPX - it was assumed that we would turn higher here. A low risk long trade.
SPX - this was the follow through as of yesterday, and its still oversold.
 Read More
If your favorite color is GREEN, then you probably like the futures this morning at 6 a.m. Eastern time. Is Green expected to continue as the color of the day? lets take a look.
.
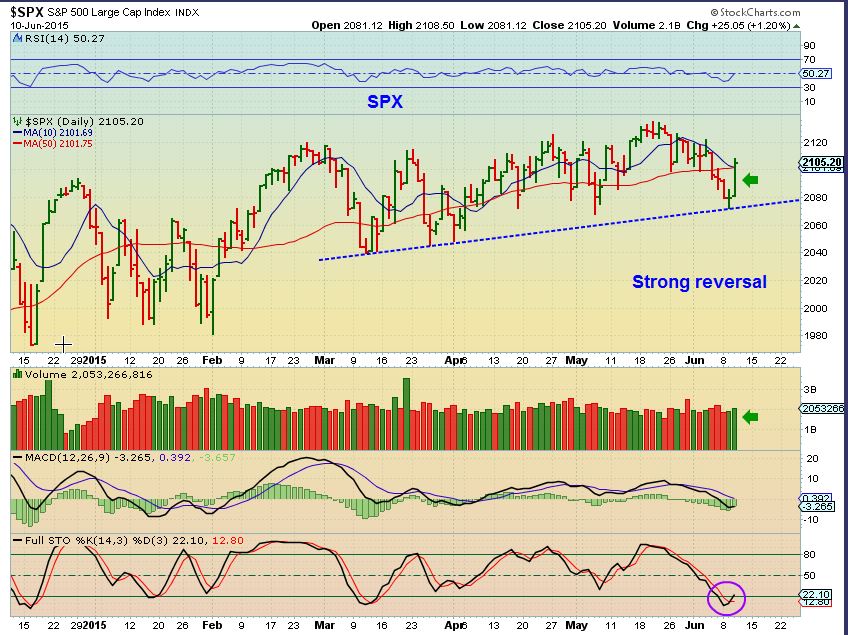
SPX- yesterday I thought we could expect a reversal and it looks to have happened
The NASDAQ looks very much the same, except...
Read MoreIt seems that things continue to play out as outlined here over the past few weeks and months. Lets look at the charts.
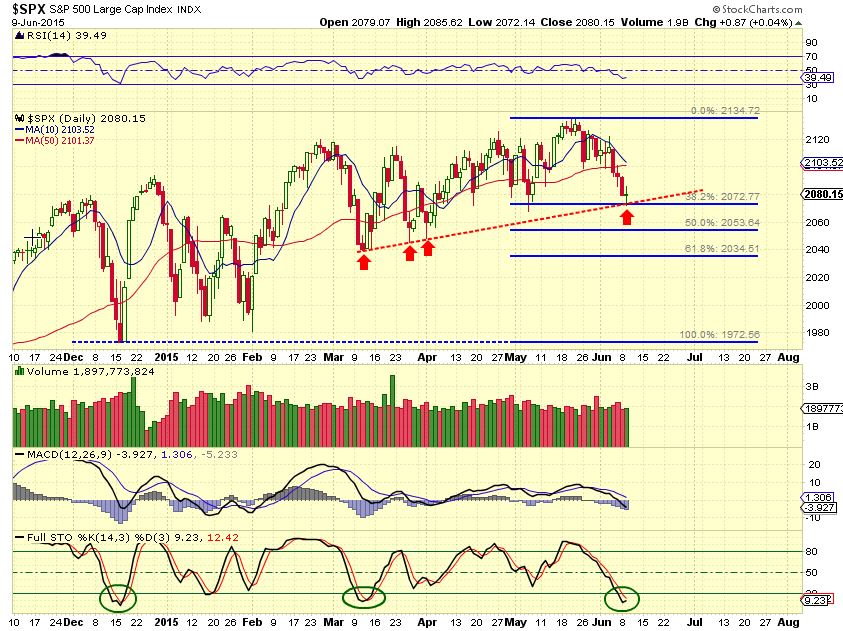
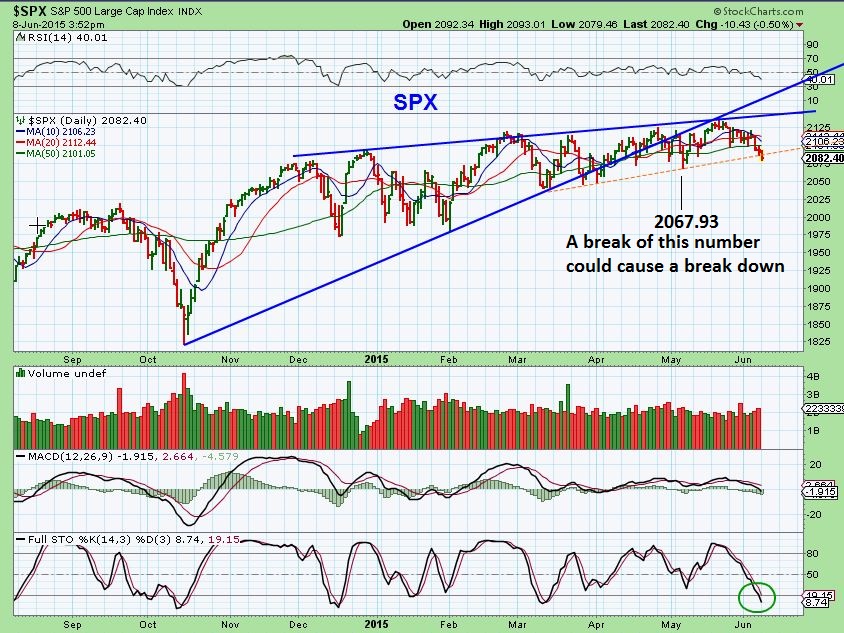
SPX- watch this number. SPX needs to bounce soon.
The markets have not had a healthy correction in years. A long term chart shows ...
Read MoreThe charts have lots to say, lets just look at the charts....
SPX- I have been watching a wedge pattern for months. It looks a lot like it broke down & back-tested (Orange Arrow) It needs to break higher real soon or it will continue to just roll over.
 Read More
I dont always do a Friday report, but things looked fairly interesting today in various markets. There is uncertainty in the waters below and it may be up to the Friday Jobs report to set things in motion. May the picture above emphasize the need to honor stops so we can trade another day .
$TRAN- We've discussed the Dow Theory and "sell In May" concepts. Will Fridays jobs report bring recovery or sell off?
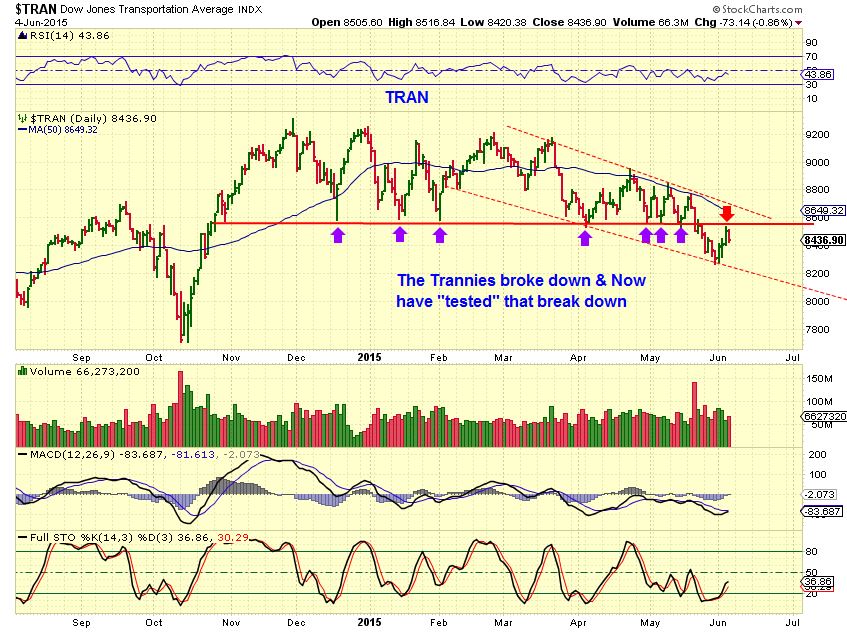
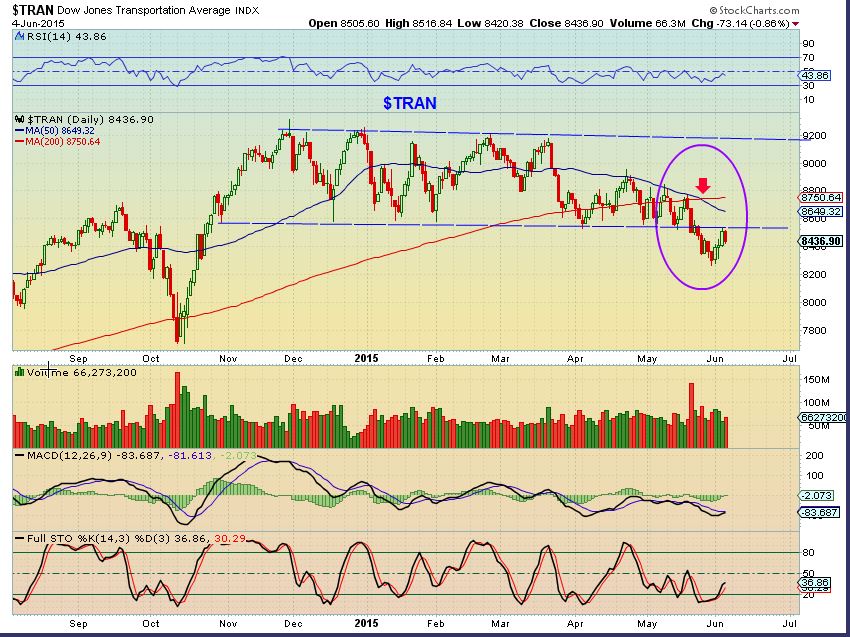
The TRAN also made the 50/200 Death cross.
Lets look at the SPX...
Read MoreI want to show you the chart that I had in my morning report for OIL Wednesday . Please notice that it says that OIL may pull back to either the upper trend line or $59.34. It also could pull back to the 50sma in this consolidation and be perfectly healthy...
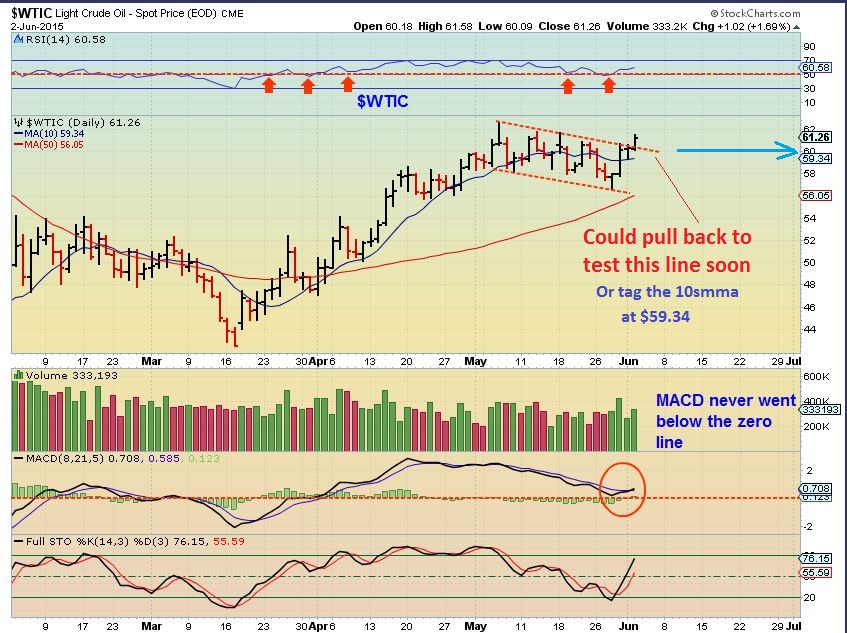
So what did OIL do Wednesday and what does it mean? ...
Read More
Scroll to top