Archive for month: June, 2015
When things start to look a little "off", or maybe something just doesn't look quite right, it shouldn't be ignored. You may be seeing cracks in the armor and those cracks can, in due time, lead to further break down. Lets review some recent warning signs pointed out here.
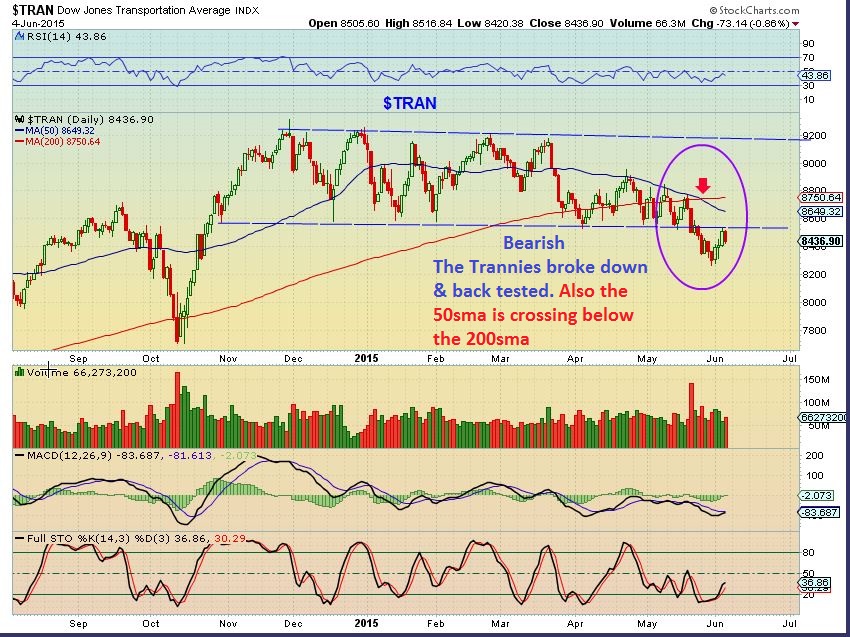
In late May and early June we discussed the Dow Theory - warnings signs were present.
This was the JUNE 4th chart
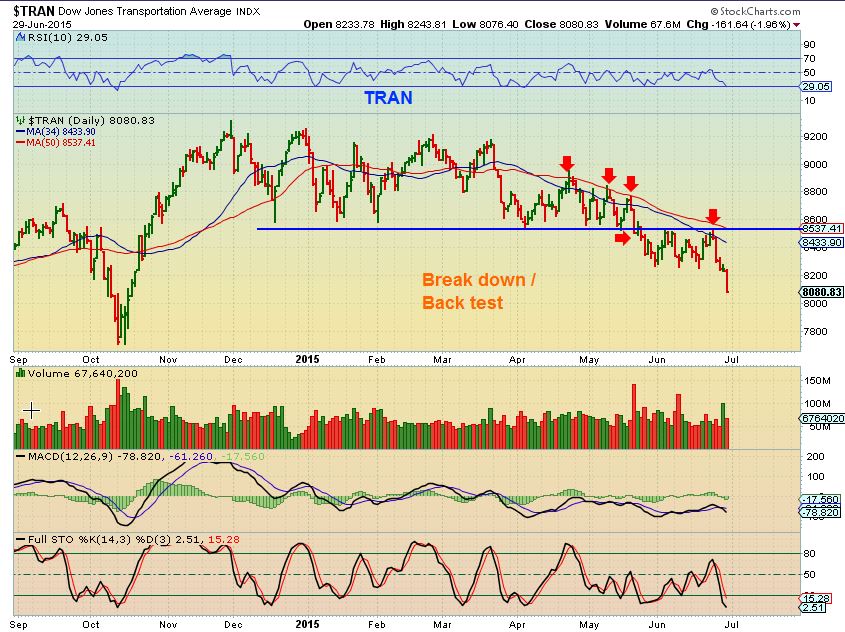
TRAN NOW-
We've also discussed the wedges in the various indexes...
Read MoreEDIT: This report was finished by Sunday late afternoon. When the futures opened, the Greece Crisis had taken a turn for the worse and the reaction was strong. Interestingly, most of the reaction is as expected in this report. I decided to wait until Monday morning 7 : 00 a.m. to release it to update as needed . Not much needs updating, since the expectations were downside anyways. Lets take a look at the charts/ report as written Sunday, and I will add new thoughts in blue if needed.
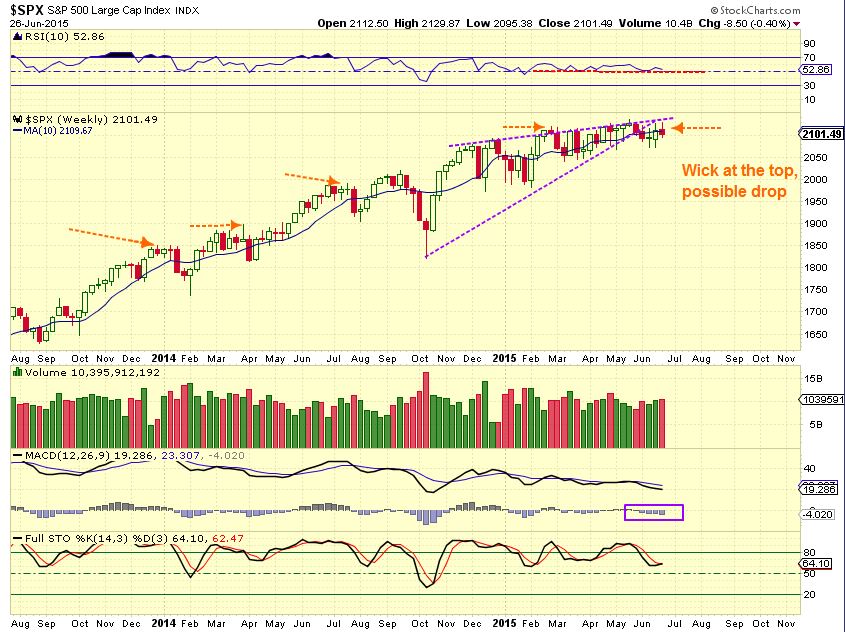
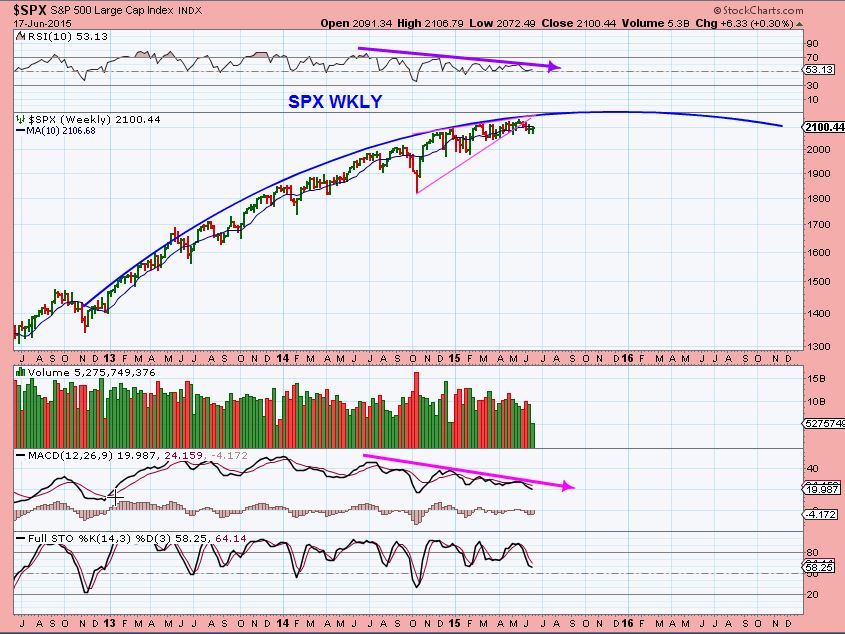
SPX WKLY - This week we still have the bearish wedge, and a wick on top could signal a drop
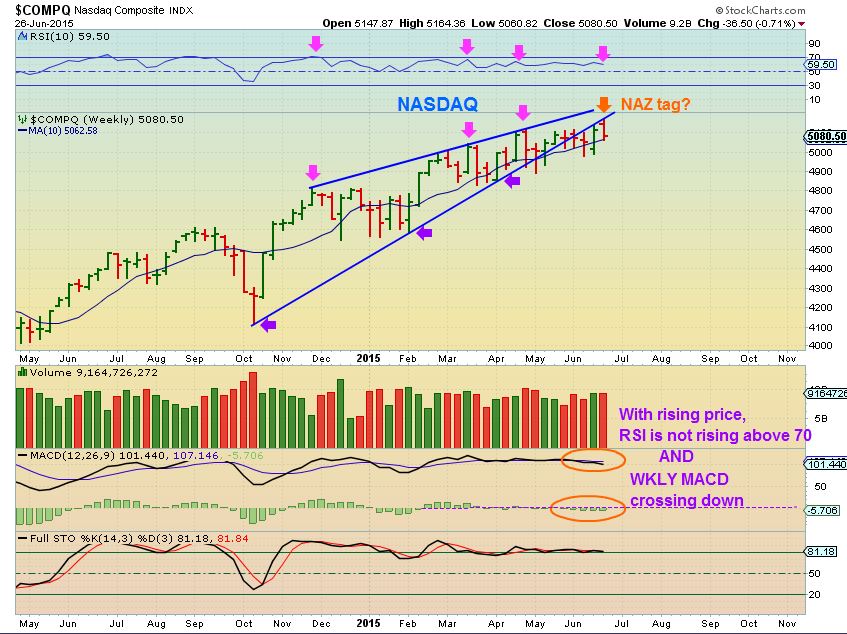
NASDAQ - several indicators are showing weakness on the weekly chart
EDIT: It has been announced that Greece will not open their Banks until after July 7th and their stock market is closed. ATM's will only allow 60 Euro withdrawls. Our futures are down as expected above, but knee jerk reactions do not always have strong follow through after the panic subsides. We will have to let the dust settle. Next is IWM, USD, OIL, NATGAS, Precious Metals, etc
Thursday the Dow shot up 230 points. Friday the Dow sold off, down over 100 points. Monday the Dow shot up 166 points. Tuesday the Dow went up another 60 points, but sold off and gave most of it up into the close. Wednesday we gapped down and closed down 178 points. Currently at 6 a.m. , the Dow futures are up 100 points. Volatility is the order of the day, I should have used a picture of a roller-coaster.
.
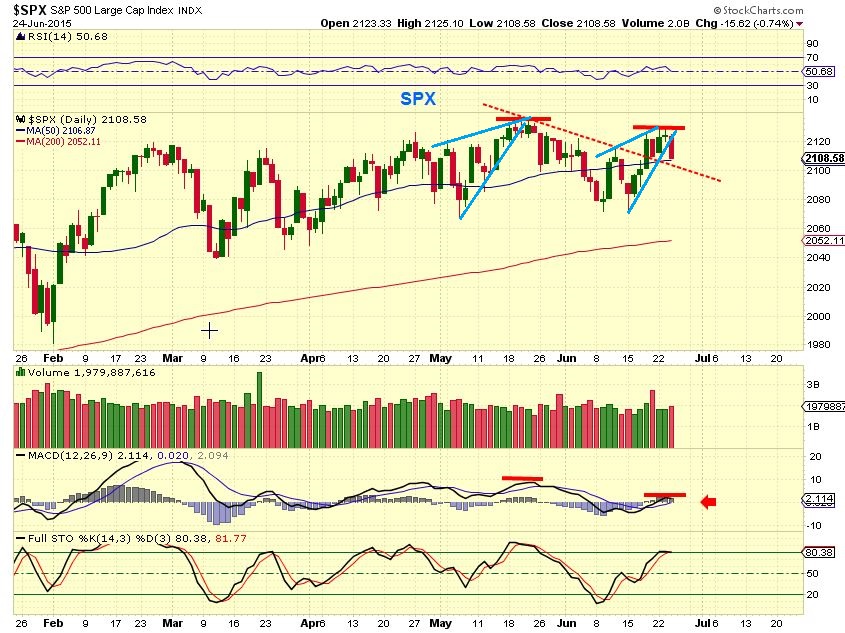
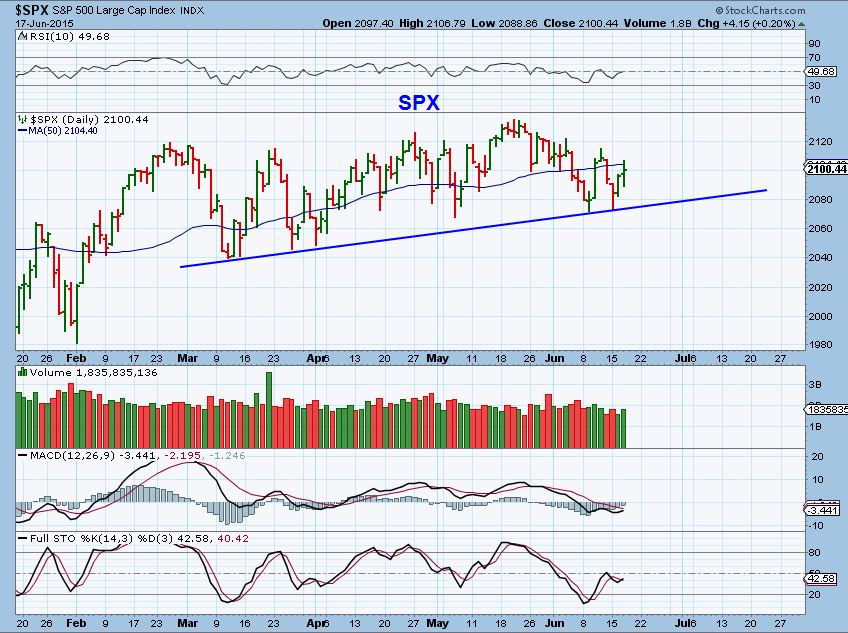
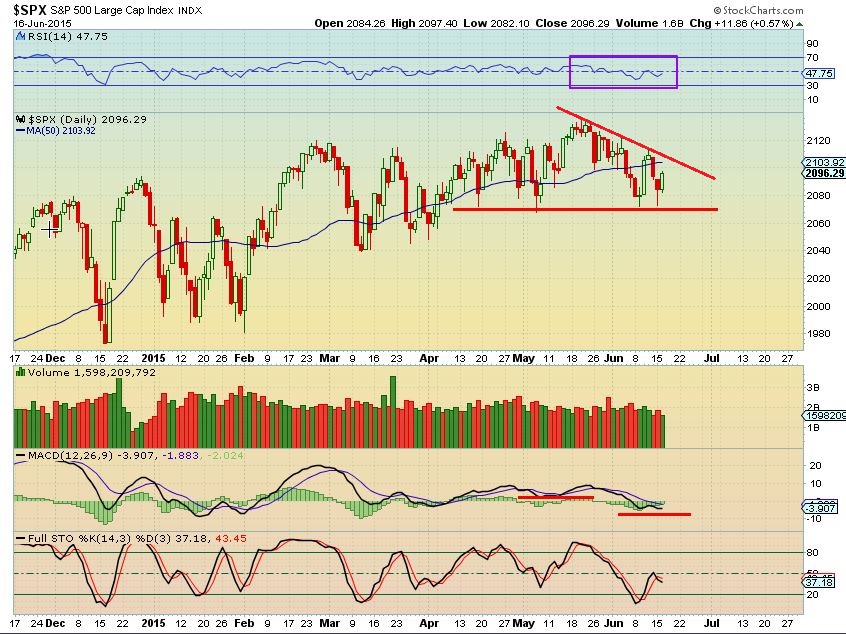
SPX - I pointed out these wedges and said I was expecting a sell off. Now we have a back test of the trend line break and a tag of the 50sma. Will this hold and give us a genuine break higher to new highs, or just more up & down action?
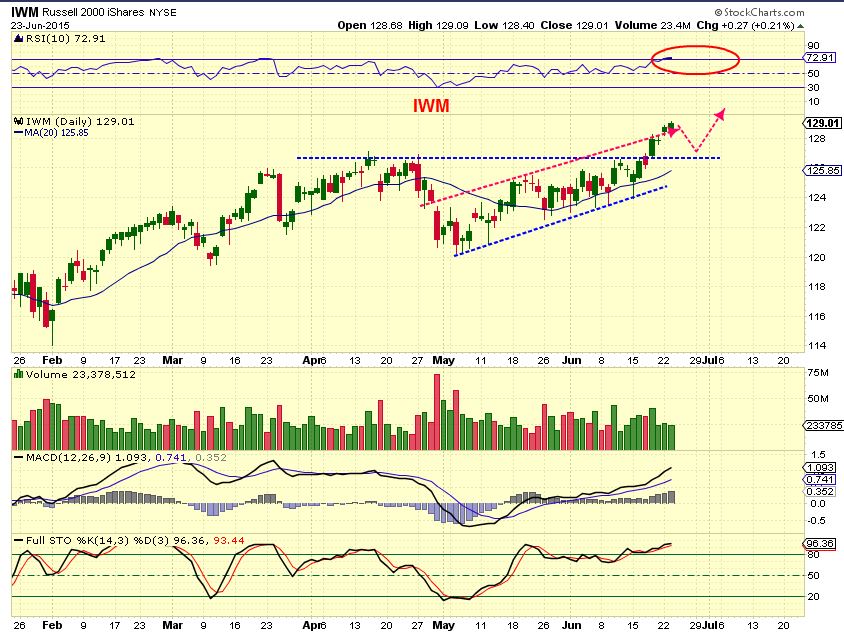
IWM - the IWM actually already broke to new highs, but I expected a back test, as shown here
This is where it gets interesting...
Read More
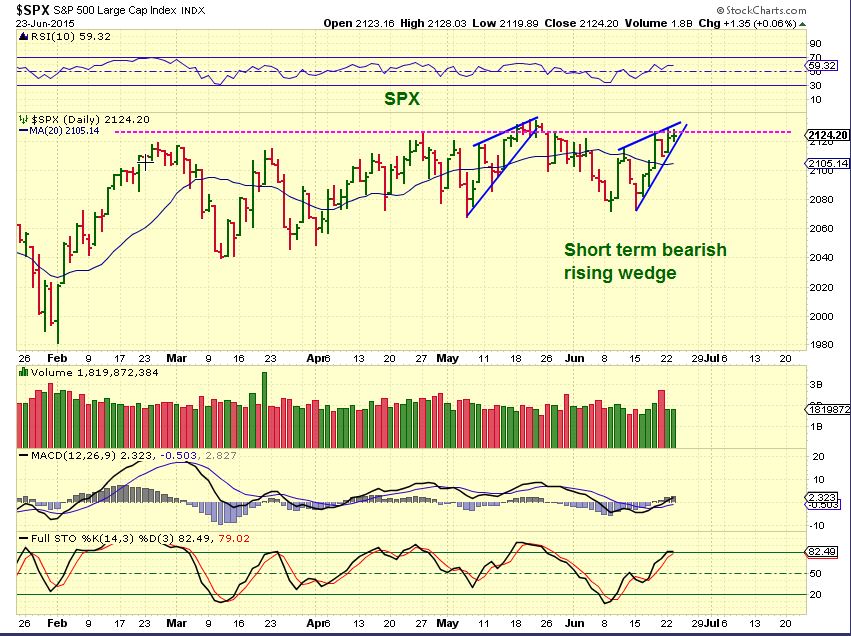
SPX - In the short term, I see small bearish wedges that could lead to a pullback or a sideways move in the short term. If this were to just surge higher and break out to new highs, that would be bullish.
Interestingly, The RUT, IWM, and IWC did break to new highs recently and continued higher. They might be leading!
Read More Short term movements in the markets are Mixed, so lets take a look at the charts and see what we can observe.
.
SPX - In the short term I see small bearish wedges that could lead to a pullback or sideways move short term. If this were to just surge higher and break out to new highs, that would be bullish.
Interestingly, The RUT, IWM, and IWC did break to new highs recently and continued higher. Are they leading ?
Read MoreNot much has changed since the weekend report, so lets just review the charts and I'll have additional comments at the end of this report.
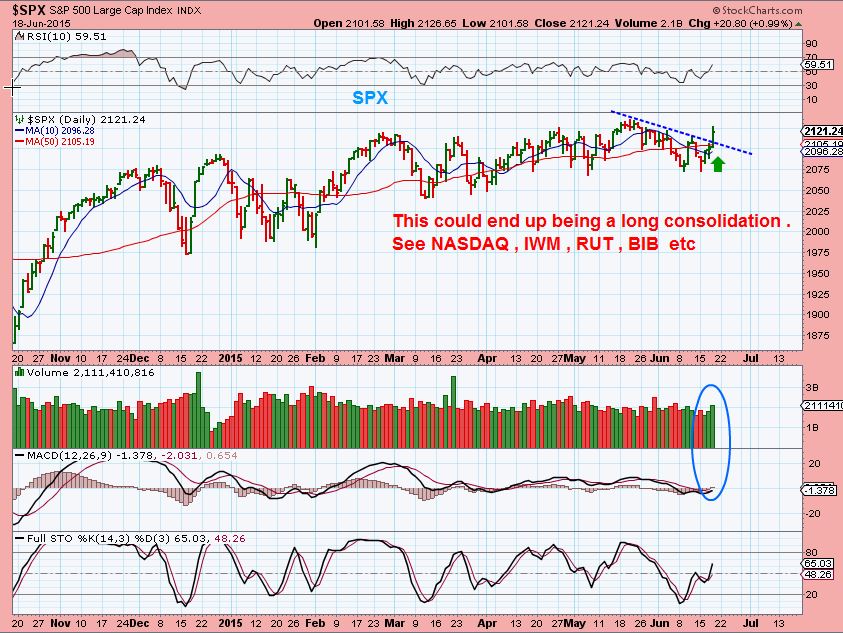
SPX - June 18 I had pointed out that in the recent past, the break to new highs can just roll over
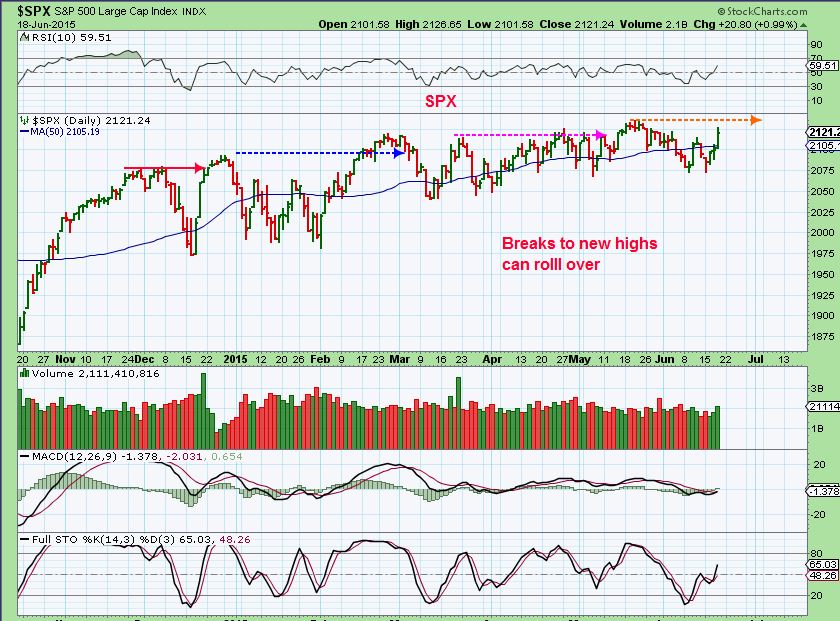
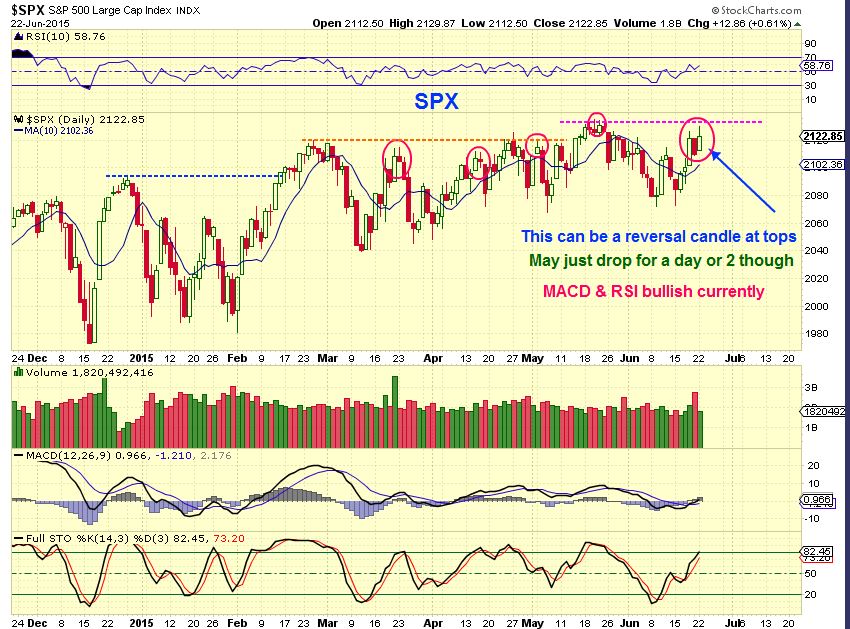
Yesterday we woke up and futures were strong. Would we gap open over 100 points on the Dow, 25 in the Spx, etc. and just run free from this sideways action into uncharted territory? Not yet, some selling that capped the gains . These can be topping type candles, but they dont have to be.
It might help to see what the IWM, RUT, BIB did...
Read MoreI started last week with a good number of trades on, and while I still see a lot of good looking set ups, I find that I am slowly going to Cash. Some trades I cashed out of and others I got stopped out. Lets look at the charts and discuss future possible opportunities.
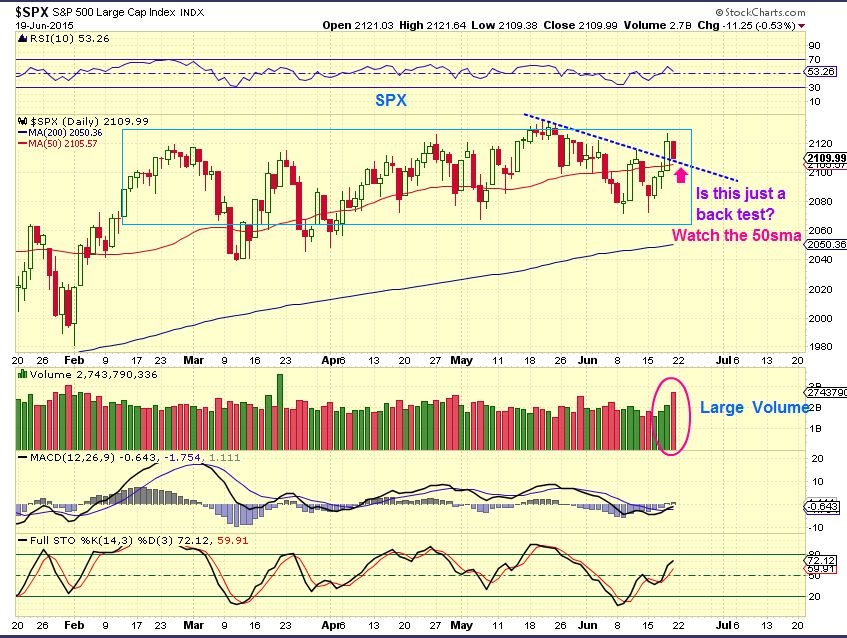
SPX- High volume reversal . Why was volume so high? Is this going to just be a back test of the break out & 50sma, or does that volume indicate a larger drop? We will know soon enough.
SPX WKLY- Doji candles can indicate indecision, and for the 2nd week in a row, our weekly chart is a doji.
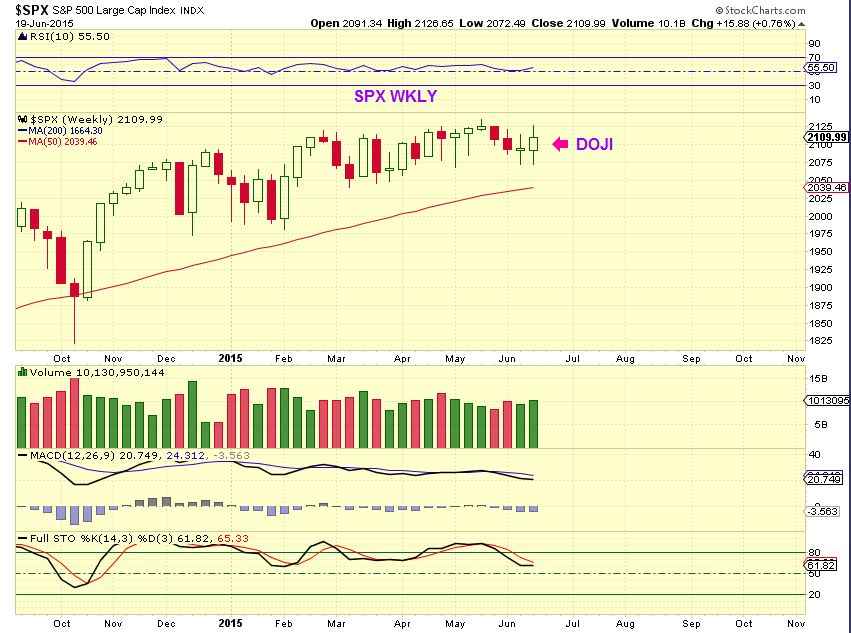
Lets look at the NASDAQ...
Read MoreI dont always feel the need to do a Friday morning report, much of Thursdays action flows into Friday and the weekend report covers that. This week we had some interesting developments , so I want to do a quick review.
SPX - I have been looking at a Wedge pattern , but lets look at things from another angle. This looks like day 8 of a new daily cycle.
 Read More
Yesterday was Fed Wednesday and as usual we had a little reaction to the Fed Release. Lets take a look at the charts
SPX- closed higher but couldn't hold above the 50sma. It still looks bullish at least for a run to the highs of this trading range. Why would that looked like a mixed picture?
The weekly SPX looks to be weakening over time. Tops are a process and we could be seeing that process playing out now.
 Read More
 First we look at the charts and see what we can learn from recent price action. Short term indecision can cause volatility or lack of direction and we see that lately. Today at 2 p.m. will we get some additional information from a Fed Release that pushes various market sectors one way or the other into a trending move? For Gold, Silver , & Miners I am thinking outside the box a bit today . Lets see what the charts are indicating...
SPX - The MACD looks to be weakening at this point ( weaker MACD & lack of follow through so far).
 Read More
Scroll to top